TIAUSD Its 1st ever 1D Golden Cross can take it to $46.00!Celestia (TIAUSD) is ahead of its first 1D Golden Cross in history, which should have been completed by next Monday the latest. Having broken above the Lower Highs trend-line that has dominated the majority of 2024, the only technical obstacle now is the 1W MA50 (red trend-line).
If that breaks, we expect the 1D Golden Cross to deliver a parabolic rally similar to November 2023 - January 2024. That was a +1018.18% rise from the bottom, which gives us a target estimate of $46.00.
-------------------------------------------------------------------------------
** Please LIKE 👍, FOLLOW ✅, SHARE 🙌 and COMMENT ✍ if you enjoy this idea! Also share your ideas and charts in the comments section below! This is best way to keep it relevant, support us, keep the content here free and allow the idea to reach as many people as possible. **
-------------------------------------------------------------------------------
💸💸💸💸💸💸
👇 👇 👇 👇 👇 👇
Cryptocurrencysignals

Bullish momentum to extend?Ethereum (ETH/USD) is falling towards the pivot which aligns with the 38.2% Fibonacci retracement and could bounce to the pullback resistance.
Pivot: 3,487.10
1st Support: 3,278.38
1st Resistance: 3,757.61
Risk Warning:
Trading Forex and CFDs carries a high level of risk to your capital and you should only trade with money you can afford to lose. Trading Forex and CFDs may not be suitable for all investors, so please ensure that you fully understand the risks involved and seek independent advice if necessary.
Disclaimer:
The above opinions given constitute general market commentary, and do not constitute the opinion or advice of IC Markets or any form of personal or investment advice.
Any opinions, news, research, analyses, prices, other information, or links to third-party sites contained on this website are provided on an "as-is" basis, are intended only to be informative, is not an advice nor a recommendation, nor research, or a record of our trading prices, or an offer of, or solicitation for a transaction in any financial instrument and thus should not be treated as such. The information provided does not involve any specific investment objectives, financial situation and needs of any specific person who may receive it. Please be aware, that past performance is not a reliable indicator of future performance and/or results. Past Performance or Forward-looking scenarios based upon the reasonable beliefs of the third-party provider are not a guarantee of future performance. Actual results may differ materially from those anticipated in forward-looking or past performance statements. IC Markets makes no representation or warranty and assumes no liability as to the accuracy or completeness of the information provided, nor any loss arising from any investment based on a recommendation, forecast or any information supplied by any third-party.

Awaiting Breakout After Oversold Hello,
FIL has reached an oversold condition during the bear market. I'm waiting for a precise entry price, anticipating a breakout the resistance.
Happy Trading,

BITCOIN $150k doesn't seem so unrealistic now, does it?Almost 4 months ago (August 14, see chart below), we made a bold prediction of a Bitcoin (BTCUSD) target at $150000 by early 2025, while the price was still at $60k:
This was received with a lot of skepticism at the time but with the price now almost on the $100k psychological barrier, the idea looks more and more realistic. It is time to revisit this chart and made some slight modifications based on the price action that was followed.
The price is now off the 0.786 - 1.0 Fibonacci range where it consolidated from March 2024 until October 2024. The enormous rise/ break-out is attributed of course to a large extent on the U.S. elections and the euphoria that followed. We are only 1 month outside this range and the price is already much higher.
Last month's candle is very similar to November 2020 and May 2017. In comparison, that was when the most aggressive (parabolic) rallies of those Bull Cycles started. In 2017 from May to December, it was on a 71.5° angle. On the next Cycle from November 2020 to April 2021, it was on a 68.5° angle, i.e. 3° lower. If that's a progression by any means, then we can assume that the 2024 - 2025 parabolic rally could be on a 65.5° angle (-3° from the previous Cycle). That gives a potential target of $300k as early as May 2025, assuming we could have a Double Top Cycle as in 2021.
In any case, it will be interesting to see if the current Cycle also makes a blow-off top (like the last two) outside/ above the Channel Up that started back on the December 2013 High. Unrealistic as it may seem now, the $150k Target is very plausible technically as it is just below the top of that multi-year Channel Up. If the $300k blow-off top (red Arcs) comes, then all the better, but a long-term investor may consider to start taking profits while the price is inside the Channel Up and starts being cautious once we break above it in the red Arcs.
So what do you think? Do you view $150k as technically realistic as this pattern indicates? And if so, can Bitcoin even make a blow-off top near $300k? Feel free to let us know in the comments section below!
-------------------------------------------------------------------------------
** Please LIKE 👍, FOLLOW ✅, SHARE 🙌 and COMMENT ✍ if you enjoy this idea! Also share your ideas and charts in the comments section below! This is best way to keep it relevant, support us, keep the content here free and allow the idea to reach as many people as possible. **
-------------------------------------------------------------------------------
💸💸💸💸💸💸
👇 👇 👇 👇 👇 👇

Alikze »» DUSK | Bullish Wave 3 or C Scenario - 1W🔍 Technical analysis: Scenario of wave 3 or C in the ascending channel
📣 BINANCE:DUSKUSDT is moving in an ascending channel on the weekly time frame.
🟢 In the previous rally, it stopped at the supply range of 55 cents and a corrective cycle was formed to the origin of the movement of 14 cents.
🟢 Currently, it is facing demand, considering the first movement wave and the correction to the origin of the previous movement.
💎 This movement wave is the third wave, which is located in the microwaves 3 of the first 3 waves, considering the current momentum.
💎 Therefore, in the first step: this movement cycle will have the ability to grow to the first supply zone.
⚠️ In addition, if the price correction enters the range of this validation level, the bullish scenario will be invalidated and must be re-examined and updated.⚠️
»»»«««»»»«««»»»«««
Please support this idea 💡 with a LIKE 👍 and COMMENT 💬 if you find it useful and Click "Follow" on our profile if you'd like these trade ideas delivered straight to your email 📧 in the future.
Thanks for your continued support.🙏
Best Regards,❤️
Alikze.
»»»«««»»»«««»»»«««

Multi-swing high resistance ahead?The Bitcoin (BTC/USD) is rising towards the pivot which and could drop to the 23.6% Fibonacci support.
Pivot: 3,883.63
1st Support: 3,452.30
1st Resistance: 4,092.48
Risk Warning:
Trading Forex and CFDs carries a high level of risk to your capital and you should only trade with money you can afford to lose. Trading Forex and CFDs may not be suitable for all investors, so please ensure that you fully understand the risks involved and seek independent advice if necessary.
Disclaimer:
The above opinions given constitute general market commentary, and do not constitute the opinion or advice of IC Markets or any form of personal or investment advice.
Any opinions, news, research, analyses, prices, other information, or links to third-party sites contained on this website are provided on an "as-is" basis, are intended only to be informative, is not an advice nor a recommendation, nor research, or a record of our trading prices, or an offer of, or solicitation for a transaction in any financial instrument and thus should not be treated as such. The information provided does not involve any specific investment objectives, financial situation and needs of any specific person who may receive it. Please be aware, that past performance is not a reliable indicator of future performance and/or results. Past Performance or Forward-looking scenarios based upon the reasonable beliefs of the third-party provider are not a guarantee of future performance. Actual results may differ materially from those anticipated in forward-looking or past performance statements. IC Markets makes no representation or warranty and assumes no liability as to the accuracy or completeness of the information provided, nor any loss arising from any investment based on a recommendation, forecast or any information supplied by any third-party.

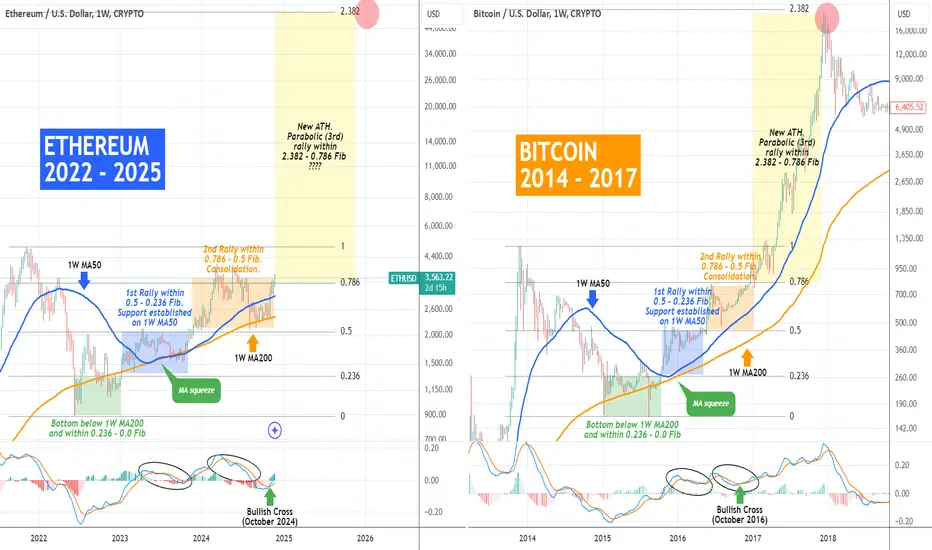
ETHEREUM Is it copying Bitcoin's 2014/17 Cycle towards $50k???Ethereum (ETHUSD) hasn't yet made a new All Time High (ATH), in contrast to Bitcoin (BTCUSD) but that isn't necessarily a negative development as it can highlight its enormous upside potential.
** ETH 2022/25 vs BTC 2014/17 **
A idea that strengthens this notion is today's analysis where you see ETH's current (2022 - 2025) Cycle against BTC's 2014 - 2017. As you can see so far the two Cycle's have been very similar with Ethereum replicating both the Bear Cycle and so far the majority of Bitcoin's past Bull Cycle.
** The Phases **
For more efficient comparison purposes, we have classified the Cycle in phases with the start being the bottom formation (Green Phase) below the 1W MA200 (orange trend-line) and within the 0.236 - 0.0 Fibonacci Zone. That gives way to the 1st rally (Blue Phase) within the 0.5 - 0.236 Fib with the 1W MA50 (blue trend-line) established as the Support. What follows is the 2nd Rally (Orange Phase) within the 0.786 - 0.5 Fib Zone and consolidation.
** October Bullish Cross and $50k?? **
The October 1W MACD Bullish Cross (Oct 2016 for BTC, Oct 2024 for ETH) signals the transition to the final stage (Yellow Phase) of the Bull Cycle, the Parabolic Rally to new ATH. For Bitcoin that peaked near the 2.382 Fibonacci extension. If that seems unrealistic for Ethereum's price today (the 2.382 Fib is just above $50k!!) in terms of market cap (and rightly so) just consider the impact that the ETFs' capital inflows have on the market. It remains to be seen, but nonetheless, ETH has enormous upside from here onwards and we're sure that even a +100% rally from the current price would be welcomed by the majority of the market.
-------------------------------------------------------------------------------
** Please LIKE 👍, FOLLOW ✅, SHARE 🙌 and COMMENT ✍ if you enjoy this idea! Also share your ideas and charts in the comments section below! This is best way to keep it relevant, support us, keep the content here free and allow the idea to reach as many people as possible. **
-------------------------------------------------------------------------------
💸💸💸💸💸💸
👇 👇 👇 👇 👇 👇
BITCOIN TARGETING ALL TIME HIGHS - BTC LONG IDEAI projected and shared the idea that Bitcoin would reach $70,000 and potentially $73,000 within a few days. It happened in just two days! I hope you took the trade and made some profits, as I did.
Now, I’m preparing to position myself with the expectation that we’ll reach all-time highs within a week or two.
We recently broke a massive bearish trendline that has held since March 2024. Just before that, a daily demand zone formed, which helped break the trendline, making it a key area for me. Additionally, the equilibrium level of the bullish leg aligns perfectly with my point of interest.
I expect the price to retrace to the daily demand zone, hit the discount Fibonacci area, test the trendline, and take off from there toward new all-time highs.
Of course, I’ll be looking for lower time-frame confirmations before initiating a long position.

BITCOIN Happy Thanksgiving with history on Bulls' side!!Happy Thanksgiving to everyone! As every year, we pay our tribute on this day with a historic run of Bitcoin (BTCUSD) on Thanksgiving days! Last year (see chart below) we made a $80000 call for today and we couldn't be happier that the market surpassed that:
This year we bring you a (much) simpler fact and that's the number of bearish signals on that day. Bitcoin has lived through 14 Thanksgiving days (excluding of course today) and only 3 have resulted in immediate bearish activity (2021, 2014 and 2013). Even the November 23 2017 Thanksgiving that was near the Cycle top, gave another 3 years of +150% gains before peaking.
You can see the previous Thanksgivings by scrolling left through the chart but it is obvious that due to BTC's cyclical behavior, the vast majority of Thanksgiving is an excellent time to invest. And today is no different as we still have almost another full year of Bull Cycle ahead of us (even more so its most aggressive part!).
Whatever trading actions you decide to make today, we wish you a blessed Thanksgiving!
So do you think this is a buy opportunity as history suggests? Feel free to let us know in the comments section below!
-------------------------------------------------------------------------------
** Please LIKE 👍, FOLLOW ✅, SHARE 🙌 and COMMENT ✍ if you enjoy this idea! Also share your ideas and charts in the comments section below! This is best way to keep it relevant, support us, keep the content here free and allow the idea to reach as many people as possible. **
-------------------------------------------------------------------------------
💸💸💸💸💸💸
👇 👇 👇 👇 👇 👇

ENSUSD approaching the top of 1-year Channel Up. Make or break?Ethereum Name Service (ENDUSD) has been trading within a Channel Up since January 2024 and the recent post U.S. elections surge is about to hit its top (Higher Highs trend-line). This is a standard break-or-rejection strategy: As long as the 1D candles close within the Channel Up, we are expecting the 1D MA200 (orange trend-line) and 0.5 Fibonacci retracement level to get tested (23.850). In the event of a 1D candle closing above the pattern, we will have a bullish break-out targeting the All Time High at 84.860.
-------------------------------------------------------------------------------
** Please LIKE 👍, FOLLOW ✅, SHARE 🙌 and COMMENT ✍ if you enjoy this idea! Also share your ideas and charts in the comments section below! This is best way to keep it relevant, support us, keep the content here free and allow the idea to reach as many people as possible. **
-------------------------------------------------------------------------------
💸💸💸💸💸💸
👇 👇 👇 👇 👇 👇

Polkadot (DOT)Comprehensive Analysis of DOT
📊 Comprehensive Analysis
🔍 General Overview
The DOT cryptocurrency, after experiencing a prolonged downtrend, entered a descending channel but recently broke out of it to the upside. Currently, the price is retracing to test the broken channel's trendline while facing a critical weekly resistance zone (red area). The high trading volume in this zone suggests increased investor activity and the potential for the uptrend to continue.
🕰 Weekly Timeframe Analysis
🔸 Current Situation
Breakout from the Descending Channel: The price successfully broke above the long-term descending channel with strong volume.
Weekly Resistance: The price is now encountering a key red resistance zone, a critical level for determining further movement.
🔸 Bullish Scenarios
First Target: If the price stabilizes above the red zone, the next target could be the all-time high (ATH) of DOT.
Parabolic Move: Market excitement and the breakout of key levels may trigger rapid upward movement.
🔸 Risks
RSI Divergence: The RSI indicator indicates overbought conditions. The price may encounter resistance near the top of the RSI channel, potentially leading to a correction.
📈 Indicator Analysis
🔹 RSI (Relative Strength Index)
On the weekly timeframe, RSI is nearing overbought levels.
A breakout of the RSI's ascending channel top could trigger further bullish movement.
🔹 Volume
Increased trading volume during the channel breakout validates the upward move.
🎯 Price Targets
Short-Term Target: Testing and stabilizing above the red zone resistance.
Mid-Term Target: Achieving the all-time high (ATH).
Long-Term Target: Reaching over-extended RSI levels.
💡 Summary and Final Notes
Technical analysis indicates that DOT is well-positioned for a bullish continuation. However:
Breaking key resistances (red zone and the RSI channel top) is critical.
Failure to break these levels might result in corrections toward lower supports (midline of the channel or weekly support).
📌 Recommendation
Always apply proper risk and money management, and ensure your decisions align with personal research and due diligence.

Alikze »» CAKE | Bullish Wave 3 or C Scenario - 1W🔍 Technical analysis: Bullish Wave 3 or C Scenario - 1W
📣 BINANCE:CAKEUSDT In the long-term analysis mentioned earlier, after a zigzag correction to the $1 area, a reversal pattern (inverted head and shoulders pattern) has formed.
🟢 In accordance with the previous analysis , the target was touched.
🟢 But currently, on the weekly time frame, in continuation of the previous analysis, it is in the supply range.
🟢 Two possible behavioral scenarios can continue.
💎 First scenario: This upward movement can extend to the previous minor ceiling and, after a correction to the broken supply range, continue to the next supply area.
💎 Second scenario: If the current supply area cannot be broken (the current supply area is not used up), it can continue the upward path by breaking the supply area of the current range to the $5 area with a pullback to the broken swing.
⚠️ In addition, in both possible bullish scenarios predicted, the price should not enter the LVL validation range. If a price correction occurs and the price touches the aforementioned area, the bullish scenario is invalidated and should be re-examined and updated. ⚠️
»»»«««»»»«««»»»«««
Please support this idea 💡 with a LIKE 👍 and COMMENT 💬 if you find it useful and Click "Follow" on our profile if you'd like these trade ideas delivered straight to your email 📧 in the future.
Thanks for your continued support.🙏
Best Regards,❤️
Alikze.
»»»«««»»»«««»»»«««

SOLANA Is this correction a buy opportunity??Solana (SOLUSD) is on a 5-day pull-back, along with the majority of the crypto market. It is still above both the 1D MA50 (blue trend-line) as well as the 1D MA200 (orange trend-line) coming strong off a 1D Golden Cross. Is this correction, however, a buy opportunity?
Well the last time SOL formed a Golden Cross on the 1D time-frame was exactly 1 year ago (October 22 2023), after coming out of a similar (blue) Channel Down and that initiated the massive October 2023 - March 2024 rally. That rally hit all Fibonacci extensions of the Channel Down successively (2.0, 3.0, 4.0) and consolidated on all of them. Even the 1D RSI sequences between those fractals are similar.
As a result, we expect Solana to hit $315 (Target 1), $515 (Target 2) and $830 (Target 3) within a 4 month horizon.
-------------------------------------------------------------------------------
** Please LIKE 👍, FOLLOW ✅, SHARE 🙌 and COMMENT ✍ if you enjoy this idea! Also share your ideas and charts in the comments section below! This is best way to keep it relevant, support us, keep the content here free and allow the idea to reach as many people as possible. **
-------------------------------------------------------------------------------
💸💸💸💸💸💸
👇 👇 👇 👇 👇 👇

BTCUSD BTCUSD ( Bitcoin / U.S Dollar )
Change of Characteristics
Point of Interest ( POI )
Completed " 1234 " Impulsive Waves
Break of Structure
Fibonacci Level - 23.80%
Order Block

Could the Bitcoin drop from here?The price is rising towards the pivot which has been identified as a pullback resistance that aligns with the 61.8% Fibonacci retracement and could drop to the 1st support which is a pullback support.
Pivot: 95,881.12
1st Support: 91.430.48
1st Resistance: 99.592.22
Risk Warning:
Trading Forex and CFDs carries a high level of risk to your capital and you should only trade with money you can afford to lose. Trading Forex and CFDs may not be suitable for all investors, so please ensure that you fully understand the risks involved and seek independent advice if necessary.
Disclaimer:
The above opinions given constitute general market commentary, and do not constitute the opinion or advice of IC Markets or any form of personal or investment advice.
Any opinions, news, research, analyses, prices, other information, or links to third-party sites contained on this website are provided on an "as-is" basis, are intended only to be informative, is not an advice nor a recommendation, nor research, or a record of our trading prices, or an offer of, or solicitation for a transaction in any financial instrument and thus should not be treated as such. The information provided does not involve any specific investment objectives, financial situation and needs of any specific person who may receive it. Please be aware, that past performance is not a reliable indicator of future performance and/or results. Past Performance or Forward-looking scenarios based upon the reasonable beliefs of the third-party provider are not a guarantee of future performance. Actual results may differ materially from those anticipated in forward-looking or past performance statements. IC Markets makes no representation or warranty and assumes no liability as to the accuracy or completeness of the information provided, nor any loss arising from any investment based on a recommendation, forecast or any information supplied by any third-party.


BITCOIN rejected on the 1st real Resistance of the Bull Cycle.Yesterday's brutal Bitcoin (BTCUSD) rejection caught the majority of the market off guard. There are a few fundamental reasons, there is the exhaustion of the post-election euphoria, there is the psychological weight of the $100000 barrier. However there is one major technical reason that has gone under the radar and we'll explain it to you below.
** The Fibonacci Channel and the 0.236 Fib **
As you can see on this chart, the underlying pattern has been a Fibonacci Channel going through the last 3 Cycles (including the current one). The pattern started with a strong rebound on its bottom (green circle) that formed the December 2013 Top. That Cycle Top was on the 0.236 Fibonacci level of the Cycle and that is a level that rejected rallies during Bull Cycles on June 24 2019 and May 11 2024.
** The '1st Real Resistance of the Bull Cycle' **
That is the Fib trend-line that (more recently) rejected the uptrend on November 22. We can call this the '1st Real Resistance of the Bull Cycle' as this is the first major rejection level that a Bull Cycle faces before the eventual Top. That high during the last 2 Cycles has been on the 0.0 Fibonacci level, technically the top of the Channel (red circles). The red spot on the current Cycle in late 2025 doesn't represent a projection but is an illustration for comparison purposes.
** Top timing and the 1W MA50 **
On a side-note, it is interesting to observe that the duration of each of the past Bull Cycles has been roughly 150 weeks (1050 days) so a repeat of this pattern would give us a High towards the end of September/ early October. It is much better to try to time the High and sell that put an actual price tag on it. Equally interesting is the fact that even though BTC is on a technical rejection, the current rally started on the August 05 2024 Low, exactly on the 1W MA50 (blue trend-line). Technically, as long as this trend-line holds, the cyclical bullish wave should stay intact.
But what do you think? Do you think the 0.236 Fib i.e. the '1st Real Resistance of the Bull Cycle' will extend the correction? Feel free to let us know in the comments section below!
-------------------------------------------------------------------------------
** Please LIKE 👍, FOLLOW ✅, SHARE 🙌 and COMMENT ✍ if you enjoy this idea! Also share your ideas and charts in the comments section below! This is best way to keep it relevant, support us, keep the content here free and allow the idea to reach as many people as possible. **
-------------------------------------------------------------------------------
💸💸💸💸💸💸
👇 👇 👇 👇 👇 👇

BITCOIN - A detailed Important scenario of what will happen!Anyone who puts 2025 as the end of the cycle is wrong, in my view In this analysis, I will list for you all the next steps, starting from now.
- Altcoins and Bitcoin will rise to 85k, and it will happen from here until the end of June - the beginning of July.... This will coincide with TOTAL3 reaching 900B - 1T.
-There will be a strong correction for the entire market, and Bitcoin will return to 72k and TOTAL3 will return to 700B - 730B. - In the period between August and October, Bitcoin will rise alone, and alternative currencies will begin to rise slightly
- Trump wins the US elections, and remember what he said two days ago regarding cryptocurrencies, and this would bring great positivity to the market.
At the end of 2024 or the beginning of 2025, Bitcoin will reach 125k - 150k, and that will be the peak of that cycle, and your greed will then reach the sky, but don't take your profits... When that happens, you will find those calling for 200k for Bitcoin, or posts tells 1M for BTC !
Then the following will happen:
- Distribution of bitcoins to ALTS for two or three weeks with great ALTseason...Greed will reach its peak, and I will be attacked and anyone who tells " this is the peak, and you must take your profits and make them 100% cash".
- Then there will be a complete collapse of the market and the American markets, and a decline that will continue for years, and this collapse will be less severe for Bitcoin, reaching areas between 50k - 45k, and most other currencies will disappear completely (90-99% decline).
best regard Ceciliones🎯

Expecting the Peak of Altcoin Season Starts in Q1 Hello,
Based on historical trends, I've observed that January and February are typically bullish months in the cryptocurrency market. During past bull runs, like 2021, altcoins often outperformed Bitcoin, driven by increased retail and institutional investment in smaller-cap cryptocurrencies. I anticipate that the peak of the altcoin season will likely begin in Q1 of the upcoming year.

Alikze »» NEIRO | Ascending Channel - 1D🔍 Technical analysis: Ascending Channel - 1D
📣 MEXC:NEIROCTOUSDT currency is currently moving in an ascending channel on the daily time frame after a price jump.
🟢 Considering the reactions at the bottom and top of the channel and considering the momentum, if there is a positive reaction at the bottom of the ascending channel, it can grow at least to the specified area.
🟢 If the bottom of the ascending channel breaks, it can continue to correct in the green box area and, if demand is created, continue its movement to the top of the ascending channel.
💎In addition, considering the movement cycle, this wave can continue to the specified supply area.
⚠️ In addition, if the price breaks the green box area downwards and touches the blue bar area, the ascending scenario is validated and should be re-examined and updated ⚠️
»»»«««»»»«««»»»«««
Please support this idea 💡 with a LIKE 👍 and COMMENT 💬 if you find it useful and Click "Follow" on our profile if you'd like these trade ideas delivered straight to your email 📧 in the future.
🙏Thanks for your continued support.
Best Regards,❤️
Alikze.
»»»«««»»»«««»»»«««

Alikze »» BRETT | Ascending Channel - 1W🔍 Technical analysis: Ascending Channel - 1W
📣 COINEX:BRETTUSDT It is moving in an ascending channel on the weekly time frame.
🟢 It has had several positive reactions with demand at the bottom of the ascending channel.
🟢 Given the current momentum that is in the supply area and the middle of the ascending channel.
💎 If the current area is broken, it can grow to the 0.41 area.
⚠️ Given the recent zigzag correction at the bottom of the channel, it has encountered buying pressure candles that can be considered the LVL Invalidation range as invalidating the bullish trend analysis. ⚠️
»»»«««»»»«««»»»«««
Please support this idea 💡 with a LIKE 👍 and COMMENT 💬 if you find it useful and Click "Follow" on our profile if you'd like these trade ideas delivered straight to your email 📧 in the future.
🙏Thanks for your continued support.
Best Regards,❤️
Alikze.
»»»«««»»»«««»»»«««

ICPUSD 1D Golden Cross can kickstart an amazing +250% rally!Internet Computer (ICPUSD) is about to form a Golden Cross on the 1D time-frame. The long-term prevailing pattern seems to be a Channel Up since the February 19 2023 High and November 04 2024 is a technical Higher Low.
The previous one was also formed a few weeks before a 1D Golden Cross, which kickstarted a non-stop rally to the 1.618 Fibonacci extension. The 1.382 Fib is at +250% from the current level at $32.00 and that is our current long-term Target.
-------------------------------------------------------------------------------
** Please LIKE 👍, FOLLOW ✅, SHARE 🙌 and COMMENT ✍ if you enjoy this idea! Also share your ideas and charts in the comments section below! This is best way to keep it relevant, support us, keep the content here free and allow the idea to reach as many people as possible. **
-------------------------------------------------------------------------------
💸💸💸💸💸💸
👇 👇 👇 👇 👇 👇

FETUSD Buy it while it is still cheap.Artificial Superintelligence Alliance (FETUSD), commonly known as Fetch.ai, has been trading within a 4.5-year Channel Up since the March 2020 market bottom and following the 2022 Inflation Crisis that bottomed on the week of November 21 2022, it has entered a new Channel Up.
That is technically the new Bullish Leg of the 4.5 year Channel Up, which is the new Bull Cycle. Naturally, it shares many common characteristics with the previous Bullish Leg/ Cycle. The symmetry between its Legs (blue Arcs) is strong and so is their tendency to reach the 0.5 Fibonacci retracement level upon pull-backs and then rebound.
It appears that right now we are at the final stage of the Channel Up, where after finding Support on the 0.5 Fib and more importantly holding the 1W MA100 (green trend-line) on the August 05 Low, it is aiming for the last rebound.
Based on the % rise of the previous Bullish Legs, this should be on a +1050% minimum, so our Target is $8.000.
It is interesting also to notice the MACD squeeze, after the last 2 Bullish Crosses, which is a clear bottom sign.
-------------------------------------------------------------------------------
** Please LIKE 👍, FOLLOW ✅, SHARE 🙌 and COMMENT ✍ if you enjoy this idea! Also share your ideas and charts in the comments section below! This is best way to keep it relevant, support us, keep the content here free and allow the idea to reach as many people as possible. **
-------------------------------------------------------------------------------
💸💸💸💸💸💸
👇 👇 👇 👇 👇 👇
