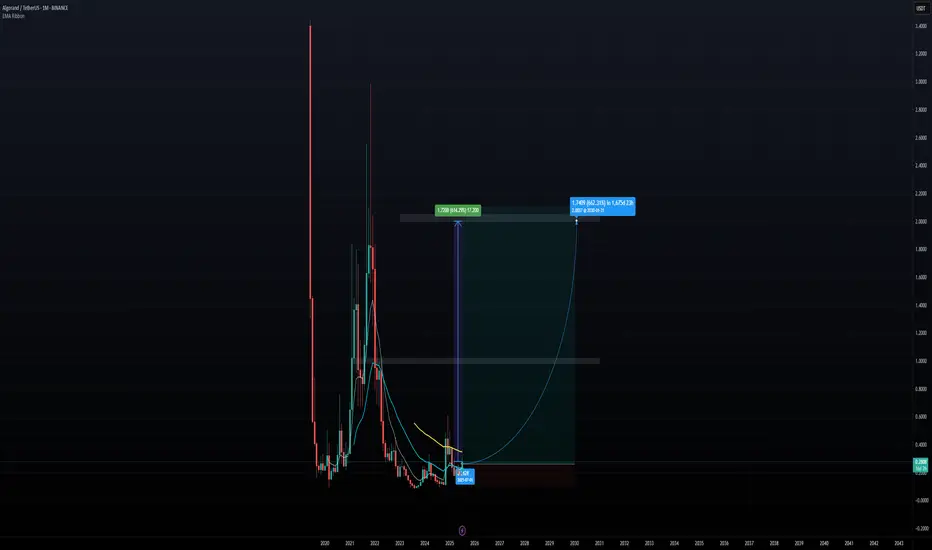
ALGORAND - LONG TERM BUY OPPORTUNITY, BEST ENTRY PRICE, 600%+ALGORAND (ALGO) is one of the layer 1 blockchain platform's that is compatible with ISO 20022. ISO 20022 is a global standard for financial messaging that aims to standardize electronic data exchange between financial institutions. Some speculate whether this is applicable or not long term, however the narrative still exists, so along with other ISO 20022 cryptos such as XRP, this can mean a nice place to park some capital in crypto. Conservatively, Algorand can touch $1.00 long term and then potentially $2.00 especially if any announcements, collaborations or other catalyst arise. Algorand is working towards quantum resistance, and that's also a selling point for the blockchain. Gary Gensler once praised Algorand and take that with what you must, but that doesn't hurt when former SEC Chairman shills a crypto project.
Cryptocurreny
BTCUSDT 4H | Rebound, Consolidation, Down or Up?Hello Everyone,
Greetings,
BTCUSDT 4H |
As we can see together, BTCUSDT is experiencing a rebound in the WEEKLY trendline resistance area & WEEKLY FVG.
If we observe further, we can also see the 200 Moving Average (MA) at the $84,000 area, and there’s also a Triple Bottom marked with a red circle.
So it can be assumed that the BTCUSDT market is likely to consolidate further while waiting for a strong Volume/Candle to either GO UP (target $99,000) or GO DOWN (target $73,800).
Remember, trading involves high risk, so please do your own research.

XRP, what are you doing?
There is a good chance price starts to move sideways. A weekly SIBI has formed at 2.59-2.89 and might be the resistance to keep price sideways.
If price does not, I foresee a possible bear retracement occurring.
Multiple FVGs are below current price (2.34). A 4HR SIBI rests at around 2.45-2.46. If price does go up, that SIBI might be the resistance to hold prices from elevating upwards.
Based on what the charts are showing me, we might be headed to another sell-off.
Reason for this assumption is due to the 1-day liquidity zone that sits at $1.77. Also keeping in mind that the bottom 1/3 of the weekly FVG has still been untouched.
If I was analyzing this chart without experiencing yesterday's (2/2/25) sell-off, I would say that we wouldn't get that low into the FVGs. But yesterday was crazy, and I did not think we could get into those gaps. So I am giving more respect to those gaps with this analysis.

4HR:BTC Do or Die. Bullish Divergence W/ Possible Double BottomBTC at key levels here. We either reclaim these levels and confirm a double bottom or break down some more, which would confirm the Head and Shoulders and likely fall to 90k. The H&S potential neckline is where we are now.
Good News: There is Hidden Bullish Divergence On The MACD and momentum is gaining to make a push to regain this key inflection point.
Toss Up. I'm neutral.

$NAKAUSDT - Bullish Reversal Setup - $6 in The Horizon!KUCOIN:NAKAUSDT - Bullish Reversal Setup
Weekly Chart: KUCOIN:NAKAUSDT is showing strong signs of a trend reversal and has confirmed multiple bullish triggers.
Although the monthly chart is not yet ready, we are seeing an attempt to break above the 2024 Open, which could signal a potential move upward.
I’ve entered a small position at current levels, with larger bids set between 1.45 - 1.33 in case of a retracement.

SUI Long PlanSUI price is currency at HTF Discount zone + OTE trade level.
keep an eye on it. PH Liq is taken now wait for the resistance brake for the confirmation then you can add it in your portfolio.

ETHUSDPair : ETHUSD ( Ethereum / U.S Dollar )
Description :
Completed " 12345 " Impulsive Waves
Break of Structure
RSI - Divergence
Resistance Level
Double Bottom as an Corrective Pattern in Short Time Frame

BTCUSDPair : BTCUSD ( Bitcoin / U.S Dollar )
Description :
Completed " 12345 " Impulsive Waves and " AB " Corrective Waves
RSI - Divergence
Double Top as an Correction in Long Time Frame
Resistance Level
Break of Structure and Retracement

BTCUSDPair : BTCUSD ( Bitcoin / U.S Dollar )
Description :
Completed " 12345 " Impulsive Waves
RSI - Divergence
Break of Structure
Bullish Channel as an Corrective Pattern in Short Time Frame
Fibonacci Level - 38.20%

STRKUSD Bullish Study Case
On the daily timeframe, STRK was in a bearish trend. Then, it started forming the Wyckoff accumulation pattern, which included a bearish candle with a long wick, marked on the graph as SC for Selling Climax. Then, we had the AR for Automatic Reaction, followed by the ST for Secondary Test, UT for Upthrust, and another STB for Secondary Test in Phase B.
Currently, I'm waiting for the retest that aligns with an inverse head and shoulders pattern in the 4-hour timeframe. Additionally, it aligns with a Fibonnaci's zone of interest.

BITCOIN There is no turning back from this.Bitcoin (BTCUSD) has started the 5th Bullish Wave of the current Bull Cycle, following the consolidation of the past 2 months. Since the November 2022 bottom we have had 4 such waves with consolidations ranging from 1 month to 6 months (blue Channel of April 10 - October 10 2023). The current wave can technically take Bitcoin up to $100k alone.
What is even more bullish than that though is the fact that the whole (ellipse) structure since the October 2023 Low, resembles the sequences of April 2020 - March 2021 and May - December 2017. As you can see, both were Bullish Legs of the 7-year Channel Up. Symmetrically, it appears that we are past its 2nd consolidation (blue circle) and starting the final rally to the Top of the Channel Up.
That means that the Cycle Top can even be marginally higher than $200k until the 1W MA50 (blue trend-line) is breached again (note that we are past a 1W Bullish Cross also) which can make us start considering a Bull Cycle again.
But what do you think? Is this rise just the start of a wave that will take BTC to 100000 even 200000 if history repeats itself? Feel free to let us know in the comments section below!
-------------------------------------------------------------------------------
** Please LIKE 👍, FOLLOW ✅, SHARE 🙌 and COMMENT ✍ if you enjoy this idea! Also share your ideas and charts in the comments section below! This is best way to keep it relevant, support us, keep the content here free and allow the idea to reach as many people as possible. **
-------------------------------------------------------------------------------
💸💸💸💸💸💸
👇 👇 👇 👇 👇 👇

It looks like BTCUSD (D) is moving towards the price support zonBINANCE:BTCUSD
It seems BTCUSD (D1) is moving towards the price support zone at 37k-38K$ with signs of a downtrend forming

Btcusdt ..Trend line The uptrend line is still intact and unbroken, and we are still in the uptrend. I predict $40,000 for btc ...

BTC SHORTthis is just a AB=CD correction scenario... 8K-7.5K, anything can happen to the market, hopefully it doesn't happen... this is not trading advice, do your research first before acting...

BTCUSDRise and shine, fellow charters! We've paddled hard and conquered that first liquidation zone, but whoa, got a bit of a punch in return, you know? No worries, though – we locked in some sweet profits, playing it smart.
Now, picture this: we're looking for that rad bullback action, a comeback wave that might just carry us to the next liquidation zone. Keep your eyes on the horizon, stay in the flow, and let's ride that wave to another level.
Remember, it's all about that balance, patience, and embracing the unpredictability of the market. We're on this journey together, my trading tribe, so keep those spirits high, catch that momentum, and let's carve our path to victory! 🌊🏄♂️💰

BTCUSD 4HIn my opinion, Bitcoin is going to break the resistance of the 32000 area, and we can think about a bullish position if the price reaches the support area of around 30000.

Ethereum Steps Every share or coin or trading pair has its unique and inherent STEPS and ANGLE. I have shared S&A for some cryptos before. Now its Ethereum turn. It sound like Ethereum is going to retest its previous channel again before start its upward move. Note that the trading volume is very low at this point. 507-679$ would be a perfect point for the end of correction.

It's not 2019, thanks for playing2019 - higher highs on volume, clean decisive bullish candles, blows through resistance with no hesitation, clean macro outlook; low rates, low inflation, high growth, dollar liquidity expansion
2023 - lower highs on volume, indecisive candles with wicks everywhere, lazily sauntering up towards major resistances, bearish macro outlook; high rates, high inflation, low growth, dollar liquidity contraction

Bitcoin setting up for a new continuation?Today’s focus Bitcoin
Pattern Trend Continuation
Possible targets 31,000 – 31,700 – 32,000
Resistance 30,500
Indicator support – EMA solid up slope CCI close a to 0 bounce
After a solid pullback to start the week, buyers charged back into Bitcoin on Tuesday, pulling back all of that session's losses. It was a solid move that kicked into gear once sellers broke 30,000 to the downside. Despite the bullish push, buyers where once again stopped at the 30,500 area.
Today sellers remain in control, but we are wondering if they can regain control and make a new push at resistance. A test and break could set up a new trend continuation trigger, and we would like to see this year's high and above tested if that happens.
The EMA continues to support the trend with a solid slope upwards, and the CCI came close to testing the 0 line. We would like to see the CCI move back into the oversold with a new move higher, but price is the prime focus in confirming the move.
If price moves back below 30,000 today or tomorrow, this would be a worry, and it could show buyer momentum might not be that strong. We would prefer to see yesterday’s high broken today.
Thanks for stopping by. Good trading, and have a great day.

Dot -bullish flag, waiting for breakoutThe DOT has formed a bullish flag, we await the breakout. In the event of a breakout, $6,600 and $7,000 could be targets.

LONG BTCUSDBitcoin looks bullish after rebounding from the down channel of its uptrend on the monthly timeframe.

Bitcoin goin Up or Down??While the price is moving in the up direction, still have the possibility to move between 30-31k and then we can see a drop.
❤️ If you find this helpful and want more FREE forecasts in Trading View
Be sure to leave a comment; let us know how you see this opportunity and forecast.
❤️ Your support is very much 🙏 appreciated!❤️

