SuperRare (RARE) Completed A setup for upto 22.50% pumpHi dear friends , hope you are well and welcome to another new trade setup of SuperRare (RARE) with US Dollar pair.
Previously we caught almost 55% pump of RARE as below:
On a 2-hr time frame, RARE with BTC pair has formed a bullish Cypher move for the next bullish reversal.
Note: Above idea is for educational purpose only. It is advised to diversify and strictly follow the stop loss, and don't get stuck with trade.
Cryptocurrrency

Trade signal | BitTorrent (BTTC) completed a setup for next pumpHi dear friends , hope you are well and welcome to the new trade setup of BitTorrent (BTTC) with US Dollar pair.
Previously we caught 61% pump of BTTC as below:
Now on a 4-hr time frame, BTTC has formed a bullish Gartley move for the next price reversal.
Note: Above idea is for educational purpose only. It is advised to diversify and strictly follow the stop loss, and don't get stuck with trade.

Elaboration on BTC/USINTR for Q1 2024Hello everyone,
in yesterday post I spoke about what do I expect for Q1 2024 moving further ..
Today, I would like to elaborate in POINTS, WHY I think is necessarily to be VERY CAUTION in current Market conditions.
Will be using 15D timeframe to capture as much data as possible.
To get clearer picture of what is possible moving into future, we need to focus on what happend in past, even tho as ment before, market conditions are not EXTREMLY similar (due to highier inflation & interest rate!), but its closest we can get. Note, that current cutting cycle might be different for this exact reason, which could possibly mean that this process take longer and will have more pauses as in past. Aswell, bottom rate is expected to not be close to 0.
For better visualisation I put cutting process into GREEN CYRCLES, marked 1-5.
1.Terminal rate
2.First cut
3.First cutting pause
4.Continuation of rate cuts
5.New Terminal rate (bottom rate)
In the end of this process, PRICE came back very close to where it started Rallie and only then new Bullmarket occured.
Today, I think and expect that we are only somewhere in middle between points 1 and 2 of this whole process, and that should be reason for EXTREME CAUTION. Especially if we take into account that we are in elevated price level compared to previous year. Having in mind that last time cut occured that was THE POINT when market flipped. And even tho ATHs right now are not that close, is very possible that we keep coming closer to them in next months, IF there is no change in FED policy next meeting. AND THAT WOULD BEEN A TIME FOR EXTREME CAUTION!
This should stay relevant Until FED decide to Cut for the First Time.
Hopefully, this helps some of you with your perception of market.
If YES, please consider liking or sharing this post, it would mean a lot for me. Thanks
Joe

link going to 11$?hi guyz
As shown in the chart, the price failed to stabilize above the support.
Even from another look, he sees that he gave a farewell kiss to the support area.
The most important price node available is $11.1, which in my opinion, the price can go down to the specified area in the next few days.
And if there is no stabilization in this area, the next peak will be between 9.5 and 10 dollars
Looking at the moving averages, we also notice that the sellers performed stronger
(mv50 and mv 200 4h)
In the daily time frame, we can see that the moving average is on the level we mentioned in the 4-hour time analysis

TVK/USD Major trend. 10 10 2023Logarithm. Time frame 1 week.
"Dying" cryptocurrency that is traded on major liquid crypto market exchanges. Previously traded (all ideas naturally not public) this dump/dump scam. Profits were substantial. All previous ideas fixed in the links.
At the moment -98% of the peak pumping price.
The very idea of such a scale time frame in order to understand in what price zone is the zone to work and what prospects.
The main trend is clearly downward. A huge wedge has been formed.
The secondary trend is descending, which similarly formed a wedge after the breakout of the horizontal channel with a huge % step of about 160% (liquidity).
Linear price chart.
Secondary trend and localized work.

DOGEUSDT HTF Analysis for Long PositionsCloses above the blue box (legit Support/Resistance) may reflect positively on #DOGE, even if short-term.
Otherwise, it may be considered to take trades by looking for confirmation (cuz its current market is bearish) at points such as the green box and green line.
Confirmations = Breaker, Mitigation, Swing Failure Pattern on 1H or less timeframe.

The Graph in a falling wedgeThe Graph seem to be in a falling wedge. Expecting a huge pump
Wait for confirmation and trade carefully!

EthereumPair : ETHUSD ( Ethereum / U.S Dollar )
Description :
Bearish Channel as an Corrective Pattern in Short Time Frame and Rejection from the Upper Trend Line or S / R Level. Completed " 1234 - abcd " Impulsive Waves at Fibonacci Level - 38.20%
Entry Precaution :
Wait until it Rejects or Breaks the UTL


$STRAX near to BREAKOUT What Is A Demand Zone?
A demand zone is a support area where traders buy. This is often lower than the current spot price and can be near a psychological level such as $15,000, $20,000, or more.
Institutional supply and demand zones are often placed at flat numbers, and the price usually moves up or down depending on the trend.

LDOUSDT 16/10Pair : LDOUSDT
Description :
Bearish Channel in Short Time Frame and Breakout the Upper Trend Line and Completed the Retracement. Consolidation Phase as Correction in LTF if it Breaks Upper Trend Line then it will Reach its Daily Descending Trend Line
Entry Precautions :
Wait Until it Breaks or Rejects from Consolidation Phase

LDOUSDT 26/09 MovePair : LDOUSD ( Lido Dao / U.S Dollar )
Description :
Rising Wedge as an Corrective Pattern in Long Time Frame with the Breakout of the Lower Trend Line and Making its Retracement as an Corrective Pattern " Bearish Channel " If it Rejects from Previous Support then Long

xlmusdthello bro... this is just an idea, actually this is just a scenario in analyzing future movements, so don't ever use this as a reference for buying or selling in the market... or just call it a prediction. ..

Bitcoin Bullish Momentum at Risk as Monthly Stochastic IndicatorBitcoin (BTC) enthusiasts might face some headwinds as a key monthly technical indicator, the stochastic, signals an "overbought downturn" according to Fairlead Strategies.
The stochastic indicator recently dipped below 80, which indicates a loss of upward momentum. This indicator typically oscillates between 0 and 100, with readings above 80 signaling overbought conditions and readings below 20 indicating oversold conditions. A downturn from overbought levels suggests a weakening of upward momentum.
Strong Resistance Causes Downturn
Katie Stockton, the founder and managing partner of Fairlead Strategies, highlighted this development, stating that "at the end of August, Bitcoin confirmed an overbought downturn in its monthly stochastics in a setback." She added that this downturn might prolong the basing process for Bitcoin, especially considering the resistance around $31.9K posed by the monthly cloud model, a level Bitcoin has struggled to breach.
Historically, overbought downturns in the stochastic indicator in early 2021 and December 2017 have marked significant price peaks.
The monthly MACD histogram, which measures trend strength and changes in trend, is near zero, indicating a neutral long-term bias. Crossings above zero suggest a bullish momentum shift, while drops below zero signal a bearish trend change. However, the MACD has yet to turn positive, implying that a sustainable uptrend has not yet taken hold, according to Stockton.
At the time of writing, Bitcoin is trading at $25,700. Stockton identified immediate support at $25,200 and noted that the 50-day simple moving average at $28,200 is a critical resistance level.

$TRB Performing Falling wedge in 15m Keep eye on Breakout Falling Wedge
The falling wedge can either be a reversal or continuation signal.
As a reversal signal, it is formed at a bottom of a downtrend, indicating that an uptrend would come next.
As a continuation signal, it is formed during an uptrend, implying that the upward price action would resume. Unlike the rising wedge, the falling wedge is a bullish chart pattern.
In this example, the falling wedge serves as a reversal signal. After a downtrend, the price made lower highs and lower lows.
Notice how the falling trend line connecting the highs is steeper than the trend line connecting the lows.
If we placed an entry order above that falling trend line connecting the pair’s highs, we would’ve been able to jump in on the strong uptrend and caught some pips!
A good upside target would be the height of the wedge formation.

HBAR LOOKS good for LONG Demand Zone
A demand zone is a price level area at which traders usually buy. This area is present below the current price, where the buying interest or potential is the highest. A recognized demand zone typically has many buyers available with buying orders at that level.
The chart below will help you understand the demand zone concept more properly.

APTUSD 29/08 MovePair : APTUSD
Description :
Symmetrical Triangle in Short Time Frame acting as an Correction after the Break of Structure
Currently in Consolidation Phase if it Breaks then Short can be Expected for Long Term

$DATA in Bouncing Area MIL:DATA in Bouncing Area Also Getting Volume with Double Bottom
How to identify the Demand Zone?
Drop spin Rally :
Step 1: Initially, the prices were falling down as there could be sellers activated in the stock.
Step 2: The price will move in a range because there is an imbalance between buyers and sellers.
Step 3: Finally the prices will further move up with more buyers dominating the prices.
Rally spin Rally :
Step 1: Initially, the prices were moving up as there could be buyers activated in the stock.
Step 2: The price will move in a range because there is an imbalance between buyers and sellers.
Step 3 : Finally the prices will further move up like a rocket with more buyers dominating the prices.

$MOVR Breakout Trendline & Retest Done $MOVR Breakout Trendline and Retest Done
Simple Way to Trade Trendline Breakouts
Talking Points:
Always wait for the current candle to close beyond the trendline to confirm the break.
Enter into the trade when price retraces back within a few pips of the original trendline, trading in the direction of the original breakout.
Set your Stop a few pips beyond the trendline and set your Limit at least twice as far as your Stop.
Step 1. - Locating the Trendline
As a review, a trendline is a line connecting two or more lows or two or more highs, with the lines projected out into the future. Traders than look at these projected lines and look for future prices to react around those levels. For a detailed lesson in identifying and drawing valid trendlines, check out my 3 Tips For Trendline Trading.
On the chart below is an example of a trendline that developed today on the MOVR/USDT on an Hourly chart. You can see how I connected the two swing lows to create a line and projected that line out into the future.
Step 2. – Wait For a Confirmed Breakout
Next, we need to see how the price reacts to the projected trendline. There are two potential outcomes when price comes into contact with a trendline:
The price will bounce off the trendline
The price will break through the trendline
This article focuses on the latter. So we wait to see if the price does in fact break through the price. But we aren’t ready to place a trade just because the price breaks through the trendline. We need to wait and see if the current candle closes beyond the trendline. We require a candle to close beyond the trendline to confirm the breakout. This is a very important rule.
Step 3. Set Up The Trade
Remember the first image I showed you of the GBP/USD Hourly chart? Let’s go back to that example because it actually ended up producing a near perfect breakout setup. Soon after that snapshot was taken, the GBP/USD fell and broke through our trendline with authority. A very short time after that, the Hourly candle closed below the trendline and confirmed the breakout as well. Once this happened, it was time to get to work to setup this trade.
There are 3 things we needed to do to execute this breakout trade:
Set an Entry order to Sell just below the original trendline.
Attach a Stop order several pips above the trendline.
Attach a Limit that is as least twice as large as our Stop .
There is a saying that goes “What once was resistance, can later become support. And what once was support, can later become resistance.” This is the mantra we rely on when setting an Entry order near the original trendline. We are looking for price to retrace back to the point of support/resistance it just broke through, and then continue back into the direction of the original breakout. Take a look at how the trade was setup below. I magnified the main part of the chart so it’s easier to read.

$AGLD breakout Bullish SymmetricalTSXV:AGLD breakout Bullish Symmetrical Triangle in 4hr
What is a Symmetrical Triangle
A symmetrical triangle is a chart pattern characterized by two converging trend lines connecting a series of sequential peaks and troughs. These trend lines should be converging at a roughly equal slope. Trend lines that are converging at unequal slopes are referred to as a rising wedge, falling wedge, ascending triangle, or descending triangle.
KEY TAKEAWAYS
Symmetrical triangles occur when a security's price is consolidating in a way that generates two converging trend lines with similar slopes.
The breakout or breakdown targets for a symmetrical triangle is equal to the distance between the initial high and low applied to the breakout or breakdown point.
Many traders use symmetrical triangles in conjunction with other forms of technical analysis that act as a confirmation.

CHZ/USD Local trade. Pivot zone.Logarithm. Time frame 1 day. Local trend. The reversal zone (price squeezed) in the descending channel.
After the rebound, the price is squeezed in a narrow zone of 124-144. The chart shows the percentages to the key support/resistance levels from this price squeeze zone.
Risk management.
It's worth noting that the price of the coin is at a super profit, I've clearly shown this on the chart, which shows the entire main, long-term trend (the entire trading history). Consequently, when working on a coin, you need to keep this in mind and limit potential losses. Observe the risk management.
Secondary trend. Time frame 3 days.
CHZ/USDT Secondary trend

INJUSDT Next Possible MovePair : INJUSDT ( Crypto )
Description :
Completed " 12345 " Impulsive Wave and " A " Corrective Wave
Fibonacci Level - 78.60%
Divergence - RSI
Break of Structure
Symmetrical Triangle in STF as an Corrective Pattern

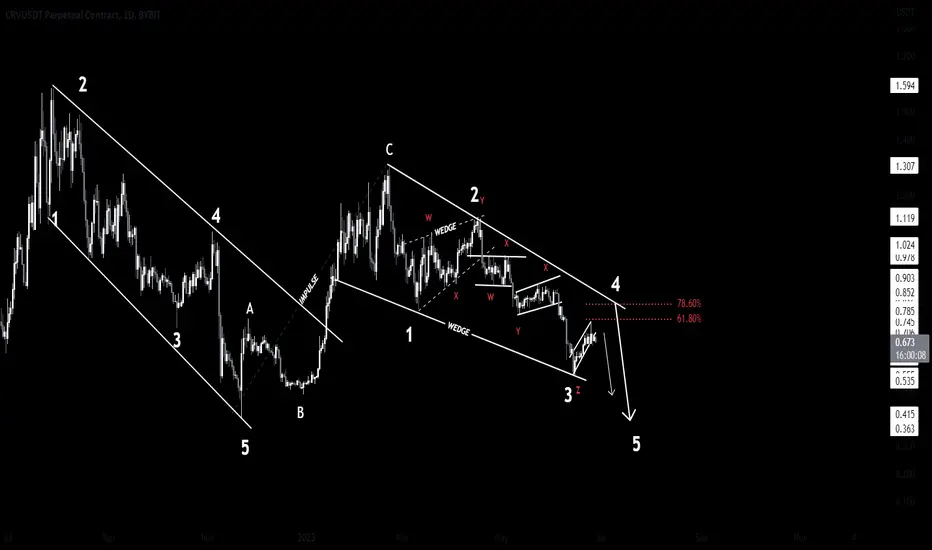
CRVUSDT Next Possible MovePair : CRVUSDT ( Crypto )
Description :
Falling Wedge as an Corrective Pattern in Short Time Frame
RSI - Divergence
Impulse Correction
Break of Structure
Completed " 1234 " Impulse Wave