CATI Memcoin. Main (essentially secondary) trend. Channel. 25 05Logarithm. Time frame 3 days (less is not necessary). Decline from the maximum -94%. As a rule, altcoins (ticker name, legend, imitation of usefulness does not matter) of such liquidity decline in their secondary trend until its reversal by -95-98%.
But, at the moment, there is a significant increase in volume, this is a good sign, if the price goes beyond the resistance of the descending channel, then a trend expanding triangle will form, or as it is also called the Livermore cylinder (dynamic zones of support / resistance of the "participation" phase).
In order not to miss the reversal, if you are afraid to gain a position now, then work with orders for a breakthrough, that is, a trend break.
🟣For 2 months now, a sideways trend with a 100% step, the price is being pulled to the resistance of the descending channel.
Breakthrough of it — trend reversal.
Not a breakthrough , decline to the next "shelf".
Everything is quite simple and logical. All levels and zones of potential minimums and maximums are shown. Remember, the average price of the set and reset is important. The key resistance zone after the reversal, where you will need to dump most of the position, or everything, is highlighted in gray.
Cryptocurrrency

XRP vs XVG 8 Year Triangle Fractal Comparison 05 2025Logarithm. Time frame 1 month. Linear chart for clarity. Two cryptocurrencies of the super hype of altcoins in 2017 (the final alt season of the cycle before last). XRP is ahead of XVG. The structures are similar, but if XVG breaks through the triangle upwards like on XRP, then work with the first target, observing risk management. You can leave 5-10% of the position for the second target, but this is not necessary. As for XRP, everything is as before... local update in the XRP idea.
XVG Secondary trend (part) Resolution of the triangle 8 years 05 2025
XRP/USD Main trend 28 07 2022

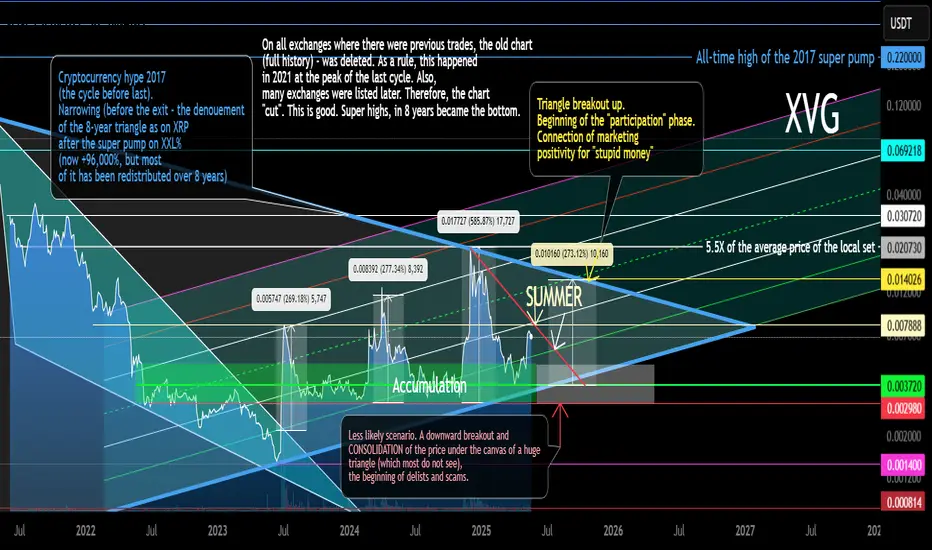
XVG Secondary Trend (Part) Triangle Resolution 8 years 05 2025Logarithm. Time frame 3 days. Linear instead of candlestick specifically for clarity. This is the longest chart history on tradingview that could be found. It does not display everything as is. Where this cryptocurrency was previously traded, the exchanges deleted the entire trading history. Listing on new exchanges does not display the whole picture. I described and showed everything on the chart. More in the channel, screenshots and comparison with XRP, here the site does not provide an opportunity to make such a comparison, as there are simply no charts of such history.
Verge (XVG) like XRP identical chart of the main trend, and the same 8-year triangle after the pumping of 2017. The only difference is that XRP came out of its triangle half a year ago, in alt season #2 of this cycle, and this cryptocurrency is still in the canvas of its triangle. But the price is gradually being driven into a corner. In alt season #3, most likely, the denouement of this story lasting 8 years will occur. More up than down (at the beginning).
Verge (XVG), like XRP, is an asset of the super pump of 2017 and the price retention is -96-98% from the super pump by hundreds of thousands of percent (I am not mistaken exactly so), which forms a huge triangle on XXX (8 years). This is all inherent in the assets of the hype of 2017: XVG XRP NEM XLM ZEC XMR DASH LTC and so on ... Some of them, over the past 2 years, have become on the path of hype (XRP XLM), and some on the path of scam (I do not want to make anti-advertisement).
Most likely, everything will repeat on XVG, as on XRP, but only at the right time, in the final alt season of this cycle. "XVG captains" do not have as much money and a powerful state behind them as XRP, to go against the market and the general trend, therefore, they need the market hype to distribute "a little higher". And so with most of these altcoins. Do not forget to get rid of them on the pump. Remember, the more down-to-earth goals, the more likely you are to earn over the long term. Observe risk and money management.
Remember, there is a big alt season ahead, provided that you are an adequate person and your goals are appropriate.
Falling towards 50% Fibonacci support?Ethereum (ETH/USD) is falling towards the pivot and could bounce to the 1st resistance.
Pivot: 2,102.09
1st Support: 1,669.20
1st Resistance: 2,806.23
Risk Warning:
Trading Forex and CFDs carries a high level of risk to your capital and you should only trade with money you can afford to lose. Trading Forex and CFDs may not be suitable for all investors, so please ensure that you fully understand the risks involved and seek independent advice if necessary.
Disclaimer:
The above opinions given constitute general market commentary, and do not constitute the opinion or advice of IC Markets or any form of personal or investment advice.
Any opinions, news, research, analyses, prices, other information, or links to third-party sites contained on this website are provided on an "as-is" basis, are intended only to be informative, is not an advice nor a recommendation, nor research, or a record of our trading prices, or an offer of, or solicitation for a transaction in any financial instrument and thus should not be treated as such. The information provided does not involve any specific investment objectives, financial situation and needs of any specific person who may receive it. Please be aware, that past performance is not a reliable indicator of future performance and/or results. Past Performance or Forward-looking scenarios based upon the reasonable beliefs of the third-party provider are not a guarantee of future performance. Actual results may differ materially from those anticipated in forward-looking or past performance statements. IC Markets makes no representation or warranty and assumes no liability as to the accuracy or completeness of the information provided, nor any loss arising from any investment based on a recommendation, forecast or any information supplied by any third-party.

Heading into pullback resistance?Bitcoin (BTC/USD) is rising towards the pivot which has been identified as a pullback resistance and could reverse to the 1st support which. is also a pullback support.
Pivot: 108,391.05
1st Support: 98,383.98
1st Resistance: 119,108.79
Risk Warning:
Trading Forex and CFDs carries a high level of risk to your capital and you should only trade with money you can afford to lose. Trading Forex and CFDs may not be suitable for all investors, so please ensure that you fully understand the risks involved and seek independent advice if necessary.
Disclaimer:
The above opinions given constitute general market commentary, and do not constitute the opinion or advice of IC Markets or any form of personal or investment advice.
Any opinions, news, research, analyses, prices, other information, or links to third-party sites contained on this website are provided on an "as-is" basis, are intended only to be informative, is not an advice nor a recommendation, nor research, or a record of our trading prices, or an offer of, or solicitation for a transaction in any financial instrument and thus should not be treated as such. The information provided does not involve any specific investment objectives, financial situation and needs of any specific person who may receive it. Please be aware, that past performance is not a reliable indicator of future performance and/or results. Past Performance or Forward-looking scenarios based upon the reasonable beliefs of the third-party provider are not a guarantee of future performance. Actual results may differ materially from those anticipated in forward-looking or past performance statements. IC Markets makes no representation or warranty and assumes no liability as to the accuracy or completeness of the information provided, nor any loss arising from any investment based on a recommendation, forecast or any information supplied by any third-party.

ZRO (LayerZero) Fresh coin. 19 05 2025Logarithm. Time frame 3 days. The creators of the cryptocurrency "threw" a huge number of their flock, and distributed an airdrop of "pennies", thereby reducing the price burden on themselves in the bearish trend of altcoins. Therefore, this cryptocurrency, unlike others, has a stronger chart, and the decline was only -80%. This is quite small, considering that the capitalization is in 170th place at the moment.
I specifically superimposed 2 channels on top of each other, ascending and descending. There were a lot of lines, but these dynamic support / resistance will be felt by the price in the future.
🟣 Now a triangle is being formed locally , it rested against the downward local trend, from its breakthrough / non-breakthrough, and depends on which global channel the market will be pulled on an average urgent basis. Sorry, the price of this cryptocurrency.
🟢 Local targets of the triangle , which can become an ascending pennant are shown on the chart.
🔴 Also, a descending target is shown, if the trend is not broken and the triangle works down.
Fundamental (not a legend). LayerZero supports any blockchain that can run smart contracts, such as Ethereum, BNB Chain, Avalanche, Polygon, Arbitrum, Optimism, Fantom and other chains. LayerZero also supports non-EVM chains, such as Aptos. These so-called omnichain applications should become a key layer of the multi-chain future, where different blockchains interact simultaneously.
It is worth noting that the fundamental does not really matter, and cryptocurrencies move (rationality of creators and market maker + real supply/demand) in accordance with the market as a whole, with very rare exceptions, which, as a rule, have a manipulative nature and a very short time.
Also, it is worth noting that when the altseason begins, this cryptocurrency can be greatly pumped up, given the emission of cryptocurrencies in one hand, and the real demand in the future for this protocol for different blockchains.

IRON Main trend. Channel. 18 05 2025Logarithm. Time frame 1 week. Down from the listing price -98%. Dying asset. Suitable for pump/dump strategy work, without reference to the ticker name in the spot, with down-to-earth goals, but understanding the high volatility of these assets due to low liquidity (“dying assets”). Work without stops (they are destructive for such assets with such volatility), from the average price of the set/dump. It is advisable to work on a breakthrough of key zones (understanding the liquidity of the asset, and the amount of the entry amount).
Asset as an example, crypto wrappers of such liquidity and work on them now. There are thousands of similar ones on the crypto market. Therefore, there is no point in considering them separately. One similar one, projection - if not thousands of dying scams (created under the hype of the distribution of the last cycle), then hundreds.
🟢A “Dragon” pattern may form if the downward secondary trend is broken. More precisely, it will be broken if a short alt season starts now for alts. The target is in the previous consolidation zone, and to cross the dynamic resistance of the inner zone of the descending channel (zone of decreasing highs). It is rational to work for a breakthrough, understanding the liquidity of the dying asset.
🔴If the market is negative, then the rollback from this descending line will continue to the dynamic support of the channel in the designated zone. If below, then it is a scam and delists from other exchanges where it is traded.

LUMIA Main trend -91% Low/high zones 01/18/2025Logarithm. Time frame 3 days. Fresh cryptocurrency. This main trend of this cryptocurrency itself (the entire history of trades) acts as a secondary trend in meaning.
The legend of the utility-imitation of this cryptocurrency is the tokenization of assets. A very good idea for the future hype of this kind, especially if they will continue to hype the "American" HBAR.
The chart shows the zones (support/resistance horizontal and dynamic) of maximums and minimums for work.
Now, after breaking the logic of the descending wedge (all the price drop), the price went into sideways consolidation. The channel step and local levels are shown. If they draw an inverted head and shoulders with the price in the channel canvas (part is already there), then there will be an exit to % of its base up, just to one of the following designated resistance zones. If the market as a whole is negative, then from this consolidation there may be another wave of decline. The zones are shown in the idea.
The asset itself was dumped after a local listing pump by -91%, these are not the minimum values for assets of such liquidity. But, sometimes if the market as a whole looks bullish, then the trend of the wrapper is reversed, this is an acceptable decline, but not minimal. Consider this in your money management and work tactics.

BTC Medium Term and Local Work for 2025 18 05 2025Logarithm. Time frame 3 days. Everything is shown extremely accurately, according to technical analysis, logic based on cyclical repetition, and liquidity consolidation zones as a result of price and trading movements. This trading idea, with precise reversal zones and targets, will last you for 31 weeks. That is, for 7 months.
The previous trading idea BTC/USD Triangle. Medium-term and local work , published on 7 06 2024, it lasted me almost 1 year. It has 63 local work updates (I don't spam with new trading ideas on principle). So, nothing will get lost, you can follow everything, read, possibly use it as training material on a live chart, as a whole explanation of local work, what is really happening on the market, profit/loss potential, always before the price movement, and not after the fact. I show what is, that is, a chart and potential work from the position of a trader, not a crypto marketer.
🟣 Local and medium urgent now
1️⃣💸 The bullish triangle itself (which is not there yet, I have depicted it on the chart for you) acts as a stop and consolidation zone (zone “psychology 100”, reset in trend No. 1). This is the easiest to manipulate and the most probable scenario. This will just be the summer consolidation. Instead of it, there may be:
2️⃣💸 Rising wedge , but more in shape like a triangle (essentially a wedge, there is a meaning of a triangle, but it was formed on aggressive pump news), with a large short liquidity takeout, and not very good logic of the TA movement after that... But, this is a bullish scenario, although quite aggressive.
3️⃣ Working out the bearish targets of the triangle (non-corrective price movement within its canvas). Stopping the decline in the designated zone and reversal upward (continuation of the trend). I emphasize the importance of not fixing the price below the zone of targets of the local corrective decline, which will not break the trend.
4️⃣💸 Double top (or triple). Double top as in 2021 in the distribution zone. This is the least likely scenario, but the most negative, as it breaks the trend. But, this is the least likely scenario, primarily because of the altcoins.
Altcoins in 2021 and now.
4️⃣In 2021, when Bitcoin formed a double top, they (altcoins) were in “space”, that is, in their distribution zones (+500-1000% of the average price of the set).
🔽Now everything is the other way around, they are in capitulation zones (most of them) or in their long-term accumulation channels :
Liquid -90-93%
Medium liquid -93-96%
Low liquid -96-98% or some are already scams or on the verge of it...
Some altcoins have pumped up earlier. That is, they left their long-term accumulation zones earlier. For example: SUN, XRP, DOGE, PEPE, SOL and so on... But there are very few of them, as distributing (raising the price, holding it and selling, inspiring to buy expensive when everything is cheap) in a bearish altcoin trend is very irrational, and you need a lot of money to go against the general market trend.
Main trend (most of it, chart since Binance Exchange foundation) for clarity on a large time frame of this local zone for work.
BTC Primary trend. Secondary — expanding triangle.

BTC Primary trend. Secondary - expanding triangle.Logarithm. Time frame 1 week. Linear for clarity. Now the price is in consolidation in the key resistance zone of the "psychology 100" zone. Everything is as before, nothing new.
The price moves from dynamic zones of support and resistance of the large channel, and with the observance of the proportions of decreasing % from the previous maximums and minimums, adhering to a conditional 4-year cyclicality. Which is also initially embedded in the Bitcoin halvings, and the understanding of increasing demand, with a decrease in supply through halvings (but, here is a nuance with ETF, that is, conditionally with "fake bitcoins", which significantly increases the supply).
With a huge degree of probability, in the next cycle (possibly the final one), Bitcoin will be driven above or around $ 1 million, depending on the maximum that will be set in this cycle. Perhaps it will be much higher (parabolic growth as at the end of 2017) than the average distribution price. Mass digitalization is underway... and there are more and more dollars, they need to be somehow utilized in the future.
I specifically refreshed the old ideas of the main trend (2 and 3 years ago published) of this scale, and made it on a linear chart, for greater visualization of the trend direction and patterns that are formed on a smaller scale.
BTC/USD Secondary trend cycles and halvings. 1 07 2022
BTC/USD Halving 518 When will the minimum and maximum price be cycles. 27 09 2023

Stellar (XLM/USDT) – Daily Chart Technical Analysis
The chart illustrates a potential bullish setup forming on the daily timeframe of the Stellar/USDT perpetual contract on Binance.
After a prolonged downtrend, the price action has formed a clear double bottom pattern (W-shape), signaling a potential reversal. The neckline of the pattern has been broken and successfully retested, confirming the validity of the formation. Following this retest, XLM has continued to respect the ascending trendline, indicating sustained bullish momentum.
Currently, the price is consolidating just above the trendline, providing a potential long entry opportunity. The designated support area around $0.29725 acts as the key invalidation level. Should the price break and close below the $0.25211 zone, the bullish structure would likely be compromised, potentially leading to a trend reversal.
The target for this setup lies within the resistance zone between $0.38 and $0.40, an area that historically acted as strong supply. This zone is marked as both resistance and a take-profit area. Given the significance of this level, a partial profit-taking strategy is advised once price approaches this zone.
Volume analysis shows moderate participation during the recent leg up, which could suggest the need for higher volume confirmation on any breakout attempts.
The RSI indicator remains in neutral-bullish territory (around 56–58), suggesting that there is still room for upward movement before entering overbought conditions.
Conclusion:
As long as the ascending trendline holds, the structure remains bullish. A break above recent highs with increased volume could pave the way for further upside toward the $0.38–$0.40 region. However, a breakdown below the support zone would invalidate the long thesis and may warrant reassessment or potential short setups.
Risk management and dynamic stop-loss tracking are essential in this volatile range.

APEX Main trend. DEX exchange Bybit. Hype and super pump 05 2025Logarithm. Time frame 1 week. Correction (descending channel, two distribution zones) after a super pump of about 1500%. All key support and resistance zones were shown, including dynamic ones.
Also showed a local target in percentage in case of exit from a local descending wedge. There is a possibility that the price will enter the mirror support zone of the previous volatility zone of the horizontal channel, or even to the median (green dotted line). Just remember this. When working with the crowd hype, remember the risks.

W / USDT Main trend. 23 03 2025Logarithm. Time frame 3 days. Descending channel, price in local clamping in consolidation at dynamic support of the internal channel. From listing -94% at the moment.
Local percentages, medium-term and long-term to key zones of chart logic and liquidity, are shown on the chart as a guide for building your tactics and risk control.
🔴 There is potential for a decline to external support of a large descending channel (optional). I showed this option for building tactics and money management. Such assets in terms of liquidity, as a rule, decrease by 96-98%
🟢 If, from this price clamp, the price goes up , then the first resistance is the dynamic resistance of the internal channel (from which there may be a local reversal). Then the external (similarly). If the trend breaks and exits the descending channel, then strong resistance is the previous consolidation of 0.24-0.36
Locally, this clamping zone looks like this.

FXAN & Heikin Ashi Trade IdeaBINANCE:ETHUSD
In this video, I’ll be sharing my analysis of ETHUSD, using FXAN's proprietary algo indicators with my unique Heikin Ashi strategy. I’ll walk you through the reasoning behind my trade setup and highlight key areas where I’m anticipating potential opportunities.
I’m always happy to receive any feedback.
Like, share and comment! ❤️
Thank you for watching my videos! 🙏

XCH Secondary Trend 11 05 2025Logarithm. Time frame 3 days. A dying asset that is losing the "faith of sectarians" and, as a result, liquidity. Previously, there was aggressive marketing and active luring of bloggers, at very high prices after listing. From the maximum, that is, the listing, a decrease of -97%. Therefore, when trading such, control the risks.
The main trend is now at the moment.
After the pump +140%, the super lows of this low-liquid cryptocurrency were updated again. Pay attention to the squeeze at the moment by -38% (merged at the market, no liquidity, the price fell).
Now is another reversal zone. Local percentages are shown. With a falling market, low liquidity gives a high % decrease at the moment, similarly, the rule works in the opposite direction. When working with such cryptocurrencies in terms of liquidity, remember that these are "dying" assets, therefore, control the risks and set adequate goals.

Alikze »» AIXBT | Formation of the valley pattern - 4H🔍 Technical analysis: Formation of the valley pattern - 4H
📣 BINANCE:AIXBTUSDT currency is moving in an ascending channel on the 4-hour time frame, which is currently in the supply zone and the middle of the ascending channel.
🟢From a classical perspective, a valley has formed that can break the current supply zone in the green box area by removing liquidity under the previous leg and grow to the next supply zone.
💎 Second scenario: The current supply zone break, depending on the number and frequency of hits to the supply level, can break it and continue its growth to the next supply zone, which is also the ceiling of the ascending channel, and then encounter a correction that, after a pullback to the previous supply zone, continues its path to the next target.
»»»«««»»»«««»»»«««
Please support this idea 💡 with a LIKE 👍 and COMMENT 💬 if you find it useful and Click "Follow" on our profile if you'd like these trade ideas delivered straight to your email 📧 in the future.
Thanks for your continued support.🙏
Best Regards,❤️
Alikze.
»»»«««»»»«««»»»«««

WLD Main trend. Super pump +1118 and decline -95. 09 05 2025Logarithm. Main trend. Time frame 3 days.
Super pump +1118.42% and decline -95.16%.
Smart and stupid money. The legend of the project is quite interesting, it is quite possible that there will be attempts to implement it, but always in the first place in such projects is: "money from nothing". The chart confirms this. After the pump +1118.42%, a huge distribution zone, which formed the upper part of the pattern of one of the varieties of "head and shoulders" at an angle. Which makes it clear that the profit is huge. Even now, with a price decrease below the listing prices, from the peak of the pump by -95.16%, which is normal for assets of such liquidity, the profit of some "investors" is +25 X !! Think about what profit was when pumping +1118% (it is impossible to implement, the pump is done just for the chart, to raise the price, for "false goals" and hype, so that on rollbacks "cheap", in the distribution zone they were not afraid to buy on the conditional hype "whales bought". Although now it is unlikely that they will pour. In order to constantly sell at excess profit "at any prices", you need to make interest, both for traders and for investors, that is, volatility waves. They will pump under the market.
Local trend . Local impulse from the minimum prices. Locally, the price rested against the median, in case of its breakthrough - the implementation of the ascending pennant.

MEME Main trend -97% Channel. Reversal or scam zone.Logarithm. Time frame 3 days (less is not needed).
🟡 The price has reached a decline from the highs (not a listing squeeze) -97%. These are practically the maximums of declines after the hype for cryptocurrencies of such liquidity (96-98), after which there is only a complete scam. At the moment, there is a reaction from this zone (the lower zone of the main trend channel) (impulse buyback), and a rollback after it, which forms the canvas of a potential ascending flag. If there is a breakthrough, then locally - the implementation of the ascending flag.
⚠️🔼 These are high-risk cryptocurrencies of such liquidity (that's why such declines are big), but the percentage of price growth in them, for the same reasons (liquidity/volatility) is an order of magnitude greater in the case of their implementation. When working with such assets, observe money management.
🟣 Implementation of the flag's goals (essentially to the channel median) +80-100%
🟡 To the resistance of the descending channel of the main trend +325%
🔵 To potential highs (one of the previous consolidations) +1000-1300%.

TIA Secondary trend. Wedge. Reversal zone. 09 05 2025Logarithm. Time frame 3 days. The price dropped to the listing price zone, namely the level of 2.309. In this zone, the decline stops and the transition to consolidation - sideways. The decline formed a full-fledged descending wedge. This is a bullish pattern in cases of a breakthrough of its resistance (in most cases).
When working with such hype cryptocurrencies, observe money management. Now in “investors” more than 200-300 X, who always sell without loading the glass, but somewhere more, and somewhere less, under the market as a whole. I would advise you to work with the wedge that has now formed and "down-to-earth", logical goals, after exiting it and the consolidation zone.
Main trend. TIA (Celestia) Main trend. Maximum targets of the cycle. XXL+10Х
Line chart of prices, for clarity of the secondary trend, the descending wedge and the potential reversal zone.

Bitcoin to $134,000As bitcoin still bullish and staying above 20MA on weekly, Im expecting more upside movement for that, to reach the important resistance line we have at $134,000

XTZ Secondary Trend. Channel. Wedge. Capitulation Zone. 07 05 20Logarithm. Time frame 1 week (less is not necessary).
The secondary trend has formed a horizontal channel for several years, with repeating wedge-shaped formations, the third time we entered under the support of this channel not by squeezes to collect long stop-loss, but by full candles and the structure of a descending wedge. It looks more vertical. The corrective movement to this semi-vertical wedge, quite possibly, will similarly have an aggressive character. The wedge is almost in the final phase of its formation. I showed percentages for clarity to the key reversal zones, for orientation for your money management and setting the first medium-term, and possibly local targets.
The main trend of this previously hyped cryptocurrency since 2017
XTZ/USD Main Trend. Descending Channel 01 2023

BTC/USDT 1H Chart: Channel Breakdown Alert!Hey Bitcoin traders! Let’s dive into this 1-hour BTC/USDT chart. Bitcoin has made a decisive move, and it’s not looking good for the bulls!
BTC was trading within a well-defined ascending channel, with key levels at $95,800 (upper resistance) and $88,000 (last higher high). The price recently tested the support around $95,800 but failed to rebound, and now it’s crashed below the channel’s support, currently sitting at $94,300. This breakdown signals potential bearish momentum!
The next critical support to watch is $92,000, and if that fails, we could see BTC slide toward the previous resistance at $84,400. On the flip side, a recovery above $93,000 might bring some relief, with resistance at $98,000 and a potential retest of $100,000.
Key Levels to Watch:
Resistance: $95,800, $98,000
Support: $92,000
Breakdown Target: $86,000
Recovery Target: $98,000+
The bears are in control — where do you think BTC is headed next? Let’s hear your thoughts below!

APE Main trend. Channel. Wedge. Reversal zones 05 05 2025Logarithm. Time frame 1 week.
1️⃣ Decline from the maximum by -98% , which is acceptable for assets of such liquidity and capitalization, after that either a trend reversal (main), or a complete scam.
2️⃣X (twitter) of this crypto project has 473 thousand subscribers . This army will be sent to pump this cryptocurrency at the right time in the so-called 3rd alt season of this cycle.
🟣And now work with a breakout of the descending wedge, and the price movement to the resistance of the descending channel. The percentage locally - medium-term showed for clarity from two zones - scenarios.
3️⃣The third plus is that this cryptocurrency is traded on 4 liquid exchanges: binance, bybit, okx, and most importantly Coinbase.
Line chart (trend direction and liquidity).
