Elon's Tweet or Obvious Price Action ?This is an update to my previous Idea linked below. Previously on 4H chart. I've zoomed out to a 1D chart to get some greater perspective.
BTC failed to break its resistance - indicating an inevitable downward movement.
Then came Elon's tweet, catalyzing the downward momentum.
I don't really think his tweet had much to do with this drop as TA already told us to expect it.
I view his tweets as catalysts to what is already expected as per TA.
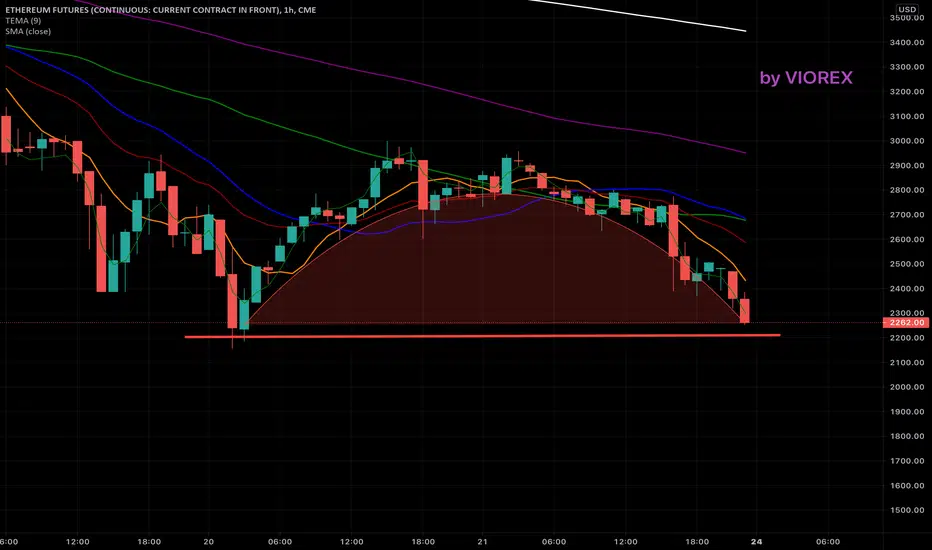
On the chart, I've delayed the time estimated to reach "spring".
Using the 1D RSI I'm more confident that we will likely break support in the week to come before trending up for the long term.
My ideal price movement is marked in green.
Comments and criticism welcome
Cryptoforecast

ADAAfter rejecting the 1.89 resistance, the ADA may move to the 1.45 support and then retest the resistance. Long moderate for ADA today!

ETHSlight rebound for ETH over the last few hours, test stopped by resistance around 2700. A descent to the support from 2450 is very likely, we will see what happens from there. A long moderate prediction for Eth today, once it reaches the 2450 support.

ETHAfter 2 days of declines, eth has been trying to get up since yesterday afternoon. The fight is now for the resistance at 2500, which once overcome would open the way to 288-2900. Long moderate for Eth today!

BITCOINThe king tries for the third time in 2 days to reach 37,000 again. However, it seems that fear and caution are still strong in the Square. If it goes above 37,500, we can see another leg up, if it goes below 35,000, we can expect it to retest the previous lows. Basically the 2 values can represent SL / TP as the case may be. Long cautious for Bitcoin today.

DOGEThe rebound trend for DOGE after the support of the 0.285 support. It is still too early to assess the strength of the recovery. So a moderate length for the Doge during the next hours ...

BTCFor now, the support in the 34k-35k area has resisted, and the king is now trying a much more timid recovery, compared to the declines of the past days. But BTC needs a rebound, Crypto generally needs a rebound. Long BTC today ...

BTCDay of indecision for BTC, who does not seem to want to climb too much. The force of his weight seems to push him lower and lower. Giving it another 24 hours, maybe it will show us more clearly the direction of travel.

DOGEDOGE does not impress with its climbing force, so it timidly recovers a very small part of yesterday's landslide. The model shown on the chart is more Short than Long. With fairly clear declining prospects, let's still be optimistic, and believe it will go up.

ETHIt is not very clear what ETH wants or can do. But what seems clear these days is that it no longer shows the rising force. After yesterday's slip, he is trying to recover, but not very convincingly. Only optimism makes me say: long moderate prediction for ETH today.

ADAAfter a slowdown with the rest of Crypto, the ADA seems to be recovering in the remaining day. We can also see a support formed at 1.5 so we were hoping for a bigger recovery. Long prediction for ADA for the rest of the day.

ETHStrong resistance retested around 2900. The 4th rejection leads ETH to the intermediate support, which seems to form immediately below 2700. Possible lateral evolution in the channel formed between 2700 and 2900.

SHIBAAs we estimated, the return to growth yesterday for SHIBA, a move that we hoped will continue today. So far, the day is starting to grow, which proves my idea. Long prediction for Shiba today.

DOGEAs I estimated, the return to growth yesterday for the Doge, a move that we hoped would continue today. Until now, today's candle, although slightly declining, was at the top of yesterday's. Long prediction for Doge today.

ADAFor now, the support indicated yesterday by the bold Green Arrow has resisted. therefore as long as the ADA stays above the line marked in red we can expect some increases. Long moderate prediction for ADA today.

DOGEFor now, the support indicated yesterday by the Green Arrow has resisted. therefore as long as Doge stays above the line marked in red we can expect some increases. Long term prediction for Doge today.

ADAImmersion today among Crypto, so also for the ADA, which is an important support. If it is broken, the Short trend will continue to previous lows. Short prediction today.

BITCOINAlthough as a Crypto representative, BTC withstood the declines a little better, the direction still seems to be clear downwards. It is important to see how it behaves if it reaches the 30,000 threshold again. That may be the moment of truth for BTC. Short prediction today.

ETHEREUMAnother day of drops for eth. If the support marked with a red line does not last today, eth may drop to 1500. Short prediction for eth today.
Ultimate BTCUSDT AnalysisHi, traders!
Not so long ago Bitcoin got 30000 price, but fortunately rejected it. We consider the current price action natural. Have a look at historical price movement. After every all-time-high we caught massive corrections. The same we can see here. Thus, we gonna represent you our up-to-date ultimate BTCUSDT analysis.
Middle-term analysis
Have a look at the plot above. As you see, the BTC make a huge arc pattern with great respect of both its lines. Moreover, the price is in the great support zone, based on previous higher-highs and lower-lows. We are waiting for a consolidation in it. Thus, judging by its current position (it’s made the second lower swing low), we see two scenarios.
Green scenario
After the consolidation, we break up all resistance lines. When the price will got near resistance arc, it’ll break it and make a new fractal. It can be both bearish and bullish.
Red scenario
After the consolidation, we break down all support lines and come to 30000$ again. We are sure that it’ll find great support there, thus it’ll probably make a new fractal based on 30000$.
Short-term analysis
As you can see on the chart, BTC has built descending channel. Nevertheless, judging by Fib. Retracement levels, it is about to find great support on 35469 $ level. Moreover, such descending wedges usually break up and make new bullish fractal. But, the power of bears could too big, and the price will get down even more. Have a look at possible scenarios.
Green scenario
The price will test 1 Fib. Level and reject from it up, breaking up the bearish chanel. We would advise you to open long after getting the price over 1.Fib level and take profit in the middle of 0.786-0.618 zone.
Red scenario
The price will break down the 1 Fib and go down breaking even 1.272 level.
Long-term analysis
As you can see on the chart, right now price is “lying” on the support zone that’s built by previous price actions. As you see it was tested and the price rejected from it’s bottom. Thus, we should wait and will see either the price reject from the support zone and start building new bullish fractal (Green scenario) or break it down and start to consolidate in it (red scenario).
DISCLAMER: Information is provided only for educational purposes. Do your own study before taking any actions or decisions at the real market.

SHIBAAs I said yesterday, SHIBA went up. Now he seems to have stumbled upon the first resistance which seems to give him little work. I hope for a return of Crypto today, and therefore of SHIBA. Long be careful!

DOGEDoge touches the upper edge of the descending canal in recent days, and seems to force it to break. If this happens, the Doge can advance to the next resistance marked in red. Long beware today for the Doge!

BITCOIN ! Easy pull Back for Bitcoin, which still has a lot to prove until it is clear the resumption of the climb. Long cautious prediction for King today!
