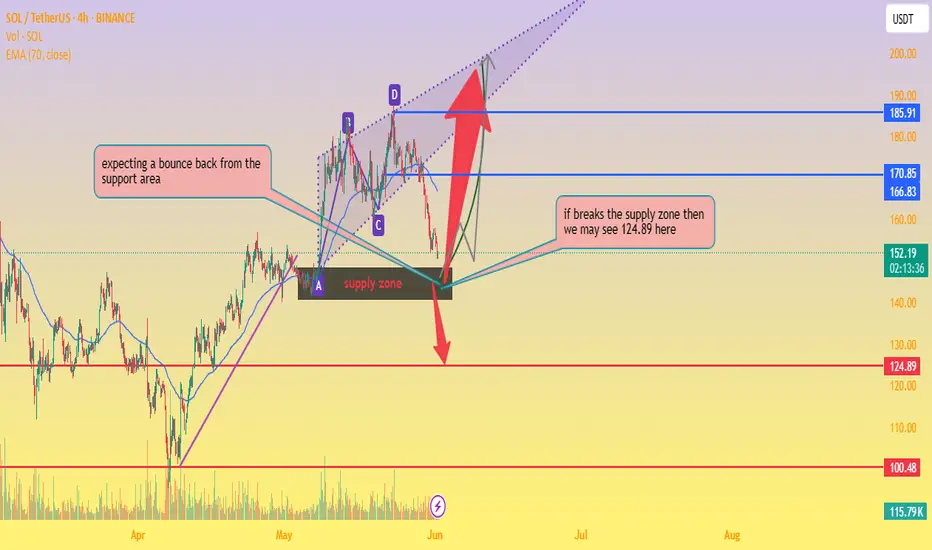
SOL/USDT Key Reversal Zone – Bounce or Breakdown?📊 Chart Analysis:
Current Price: $151.91
EMA 70 (Dynamic Resistance): $166.82
Support Area: Around $150, overlapping with a key supply zone.
Chart Pattern: Harmonic/ABCD structure completing near support.
🧠 Observations:
Price is testing a strong support/supply zone.
📦 If bounce occurs, potential targets:
🎯 First Target: $170.85
🎯 Second Target: $185.91
📉 If support breaks, then:
⚠️ Target: $124.89
📉 Next Major Support: $100.48
🧭 Trade Plan:
🔹 Long Entry (on bullish confirmation):
Entry: $152–$155
SL: Below $149
TP1: $170.85 🎯
TP2: $200 🚀
🔹 Short Entry (on breakdown confirmation):
Entry: Below $148
SL: Above $153
TP: $124.89 🧨
support and drop down your thoughts about it thanks
Cryptolevels
BTCUSD Wave Count: Bitcoin Unfolding Wave ((5)) ?Hello Friends,
Welcome to RK_Chaarts,
Let's analyze the Bitcoin chart today using Elliott Wave theory. As we can see, Bitcoin recently made a high around $112,000 on 23rd May 2025. We've marked this as the completion of Primary Degree Black Wave ((3)). After that, it dropped to complete Wave ((4)) on 31st May 2025. Now, it's moving up, possibly unfolding Wave ((5)). According to Elliott Wave principles, Wave 2 cannot retrace more than 100% of Wave 1. So, our nearest invalidation level is the 31st May's low at $103000. If the price sustains above this level, we can expect it to move towards $115,000 as a Projected Target of wave ((5)). However, if it breaks below the invalidation level, we'll need to re-analyze the wave counts. We've also drawn some trend lines, marked in black dotted lines, which act as support and resistance. This is a 1-hour time frame chart. The red line marking the nearest invalidation level is crucial. If it breaks, we'll need to adjust our wave counts. If it holds, we can expect the price to move up towards $115,000. Let's see how the market unfolds. Please note that this is an educational analysis and not a trading tip or advice.
Analysis Summary
- Analyzing Bitcoin chart using Elliott Wave theory to understand market trends and potential price movements.
- Recent high around $112,000 on 23rd May 2025, & Recent Low around $103,000 on 31st May 2025 indicates a significant turning point in the market.
Wave Count
- Completed Primary Degree Black Wave ((3)) suggests a major uptrend has concluded.
- Completed Wave ((4)) on 31st May 2025 indicates a correction phase has ended.
- Possibly unfolding Wave ((5)) implies a new uptrend may be emerging.
Key Levels
- Nearest invalidation level: 31st May's low at $103,000 serves as a crucial support level.
- Projected Target: $115,000 represents a potential upside target based on Elliott Wave principles.
Elliott Wave Principles
- Wave 2 cannot retrace more than 100% of Wave 1: a key rule governing wave relationships.
- Wave ((5)) projection based on Fibonacci ratios and wave extensions.
Chart Details
- 1-hour time frame chart provides a detailed view of recent price action.
- Trend lines marked in black dotted lines highlight key support and resistance levels.
- Red line marking nearest invalidation level is crucial for validating the wave count.
Important Notes
- Breaking below the invalidation level would require re-evaluation of the wave count.
- Sustaining above the invalidation level increases confidence in the projected target.
I am not Sebi registered analyst.
My studies are for educational purpose only.
Please Consult your financial advisor before trading or investing.
I am not responsible for any kinds of your profits and your losses.
Most investors treat trading as a hobby because they have a full-time job doing something else.
However, If you treat trading like a business, it will pay you like a business.
If you treat like a hobby, hobbies don't pay, they cost you...!
Hope this post is helpful to community
Thanks
RK💕
Disclaimer and Risk Warning.
The analysis and discussion provided on in.tradingview.com is intended for educational purposes only and should not be relied upon for trading decisions. RK_Chaarts is not an investment adviser and the information provided here should not be taken as professional investment advice. Before buying or selling any investments, securities, or precious metals, it is recommended that you conduct your own due diligence. RK_Chaarts does not share in your profits and will not take responsibility for any losses you may incur. So Please Consult your financial advisor before trading or investing.


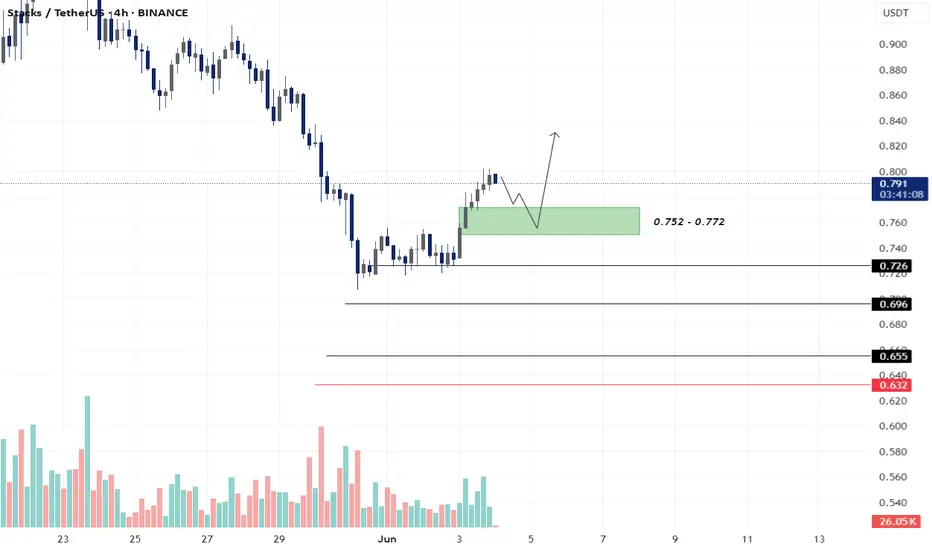
STX - LONG SET-UPBINANCE:STXUSDT
Green Zone (Demand Zone): 0.752 – 0.772
This is a bullish demand zone or entry zone where buyers previously stepped in.
Price may retest this zone before moving higher (as shown by the curved arrow).
Ideal area to deploy entries (25–50%) for a long position.
Acts as a support zone for potential reversal
Average Levels - 0.726 , 0.696 , 0.655
Stoploss - 0.632
LPT reversed a 3-month bleed — and I caught the reset candle.This isn’t noise. This is reversal.
LPT just completed a 96-bar, -86% bleed. But price didn’t just stop randomly — it formed a rounded base and exploded straight into a 1D breaker block, clearing internal structure and printing a clean power candle.
Now? Price is retracing.
We’re back into the 1D OB at 8.31 — aligning perfectly with the 0.618 fib retracement of the entire move. This is where price pauses, not reverses. And if Smart Money is still in control, this is where the next leg builds.
Targets are layered:
9.29 (0.5) is the first inefficiency reclaim.
10.28 (0.382) is the emotional level that marks continuation.
13.01 is the liquidity pocket — and the full draw.
This isn’t about whether price “goes up.” It’s about how price delivers.
Execution structure:
🟩 Entry: 8.31–6.91 (discount into 1D OB)
🎯 Target 1: 9.29
🎯 Target 2: 10.28
🎯 Final: 13.01
❌ Invalidation: sustained close below 6.12 (break of intent)
Everyone sees the candle.
Few understand the reclaim behind it.

ETHUSDT Breakout Watch: Bullish Momentum Brewing🧠 Chart Analysis Summary:
This chart suggests a bullish continuation is likely for ETHUSDT based on the current market structure and visual cues:
🔍 Key Observations:
Current Price Zone:
Trading around $2,574, inside a consolidation range (highlighted blue box).
Strong Supply Area Identified:
Around $2,335.93 (marked in purple) – acted as a solid demand/support zone fueling the current move.
Breakout Box:
The price is forming a rectangle pattern, indicating accumulation or consolidation before a breakout.
Bullish Projection Arrows:
Two projected paths show:
Minor dip toward the supply area followed by a bullish breakout 🚀.
Immediate breakout from the box towards resistance levels.
🎯 Target Levels:
First Target: 🟣 $2,918.70 – “possible next move”
Second Target: 🎯 $3,006.40 – strong resistance zone
🧩 Conclusion:
This setup suggests ETH may be preparing for a breakout from the consolidation zone. If bulls maintain control, we could see a rally towards $2,918 - $3,006 in the coming weeks.
Risk Tip: Watch for a fakeout if price dips below the consolidation range — especially near the $2,335 area.
🧠 Trading Tip:
Use volume confirmation and candle closes above the box to validate the breakout! 📊

ETHEREUM Bearish Signal | Technical + Custom AlgoSmart Trend Signal | Technical Analysis + Custom Algorithm
This signal is the result of a combination of classic technical trend analysis and a proprietary software I personally developed.

DOGECOIN Bearish Signal | Technical + Custom AlgoSmart Trend Signal | Technical Analysis + Custom Algorithm
This signal is the result of a combination of classic technical trend analysis and a proprietary software I personally developed.

Beginners Guide To Winning Memecoin Trades! Moo DengMeme coins have taken the cryptocurrency world by storm, often starting as jokes but evolving into high-volatility assets that attract crypto traders seeking quick gains. From Dogecoin to Shiba Inu and now Moo Deng, these so-called useless meme coins can offer trading opportunities—if you know where to look.
In this updated crypto analysis, I will build on our previous analysis where I identified a strong monthly supply zone for Moo Deng meme coin at $0.26. If you're wondering how to trade meme coins like Moo Deng, even with little experience, this supply and demand analysis breaks it down using simple supply and demand concepts on larger timeframes.
The sell-off is trying to happen.

Is Ethereum set to fire up ?Ethereum has been consolidating for the past 2 weeks between 2300 and 2700.
Upside resistance at 2700-2750 levels puts pressure on short-term prices.
A convincing close above the 2750 level triggers fresh upside in the short term, leading to a retesting of 3300 as an Initial target. Risk is defined at 2300. A close below this level will negate the bullish view.

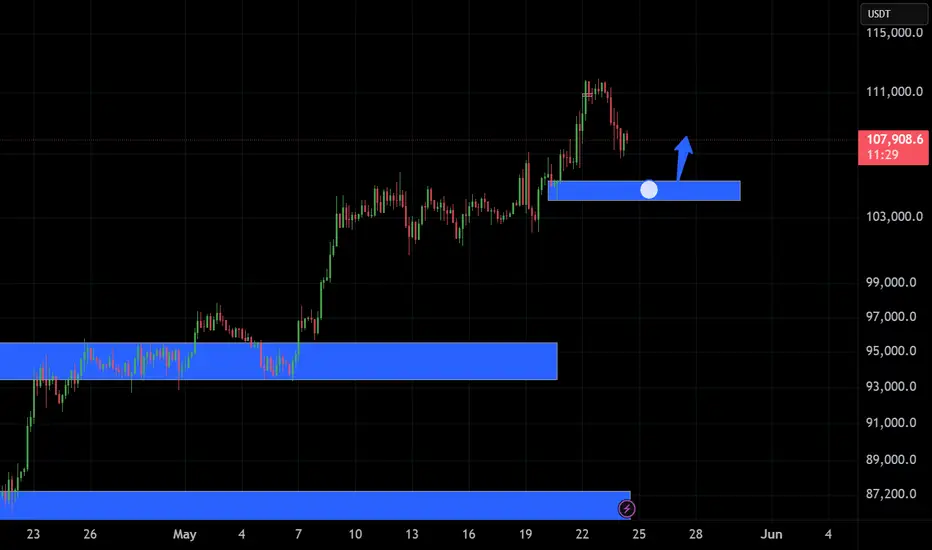
Bitcoin (BTCUSDT) - Consolidation Above Support Trendline -DailyBitcoin (BTCUSDT) price is currently consolidating above a trendline support level (between $107,000 and $109,000).
Bitcoin price has been in an uptrend throughout May 2025.
If Bitcoin price closes below $106,000 a pullback could occur down to $104,000 and $100,000.
Support Levels: $107K, $105K, $103K, $100K, $95K, $90K.
Resistance Levels: $110K, $112K, $120K, $130, $136K, $150.
Stock market correlations and corporate earnings could affect short-term price action for Bitcoin (e.g. S&P500, Nasdaq, Dow Jones, Nvidia, Dell, Marvell, etc).
Breaking News, corporate earnings and announcements, presidential and government law changes, and consumer sentiment can all affect the price of Bitcoin.

BTC at Crossroads: Rejection from ATH or Breakout.Key Zones Highlighted:
🟥 Recent ATH and Resistance Level (~$111,000 - $112,000)
The price recently tested this area, forming a new All-Time High (ATH).
This zone has acted as a major resistance, causing a pullback.
A break and close above this range would indicate bullish continuation.
🟩 Support Zone (~$105,000 - $106,000)
Price previously bounced from this zone.
Currently acting as a mid-level demand/support.
Likely to be tested again if bearish pressure continues.
🟩 Strong Supply Zone (~$102,000 - $103,500)
A more significant support area, where previous buying pressure emerged strongly.
If the upper support fails, this becomes the next possible bounce zone.
Price Action and Projection:
Price is currently at $108,209 and moving within a correction phase.
Two potential scenarios are highlighted on the chart:
Bullish Continuation:
Price rebounds from current level (black circle) and breaks above the resistance zone.
Targets new highs beyond $112,000.
Bearish Pullback:
Price fails to sustain above current level and dips into the support zone (~$105K).
If strong buying interest appears, a bounce back to the ATH zone is expected.
Technical Outlook:
Ichimoku Cloud: Price is testing the Kumo (cloud), indicating neutral to slight bearish momentum.
Volume: Slight uptick in volume during the recent drop suggests sell pressure is increasing.
Structure: Price is forming a higher high and potentially a higher low, maintaining a bullish structure as long as support holds.
Conclusion:
BTC is in a critical zone with mixed signals. A decisive move from the current level will likely set the tone for the next 24–48 hours. Watch:
A bounce at ~$108K for bullish continuation,
A dip toward $105K for potential re-entry opportunities.
Let me know if you’d like trade setup suggestions based on this.

Bitcoin: Will it surpass $109k in its upward trend?Since April, Bitcoin has traded in a clearly defined upward channel with two lower and upper trend lines. This channel was formed three touchpoints both on the lower and upper trendlines.
Near a critical zone
Now, BTC is at a key resistance zone where it previously peaked around $109,000, holding its all-time high. This level resists both judgement as well as forensic level significantly of a psychological barrier because it was the peak of the last major bull cycle. The price is currently hovering around the everyday resistance line while BTC is still in the upward channel. In conjunction with the historic all-time high and the upper channel resistance, range bound price action gives us an accurate capture of BTC’s behaviour.
Bullish breakout
The scenario outlined for this resistance zone makes the most sense as a rejection may lead to a temporary pullback, likely to the somewhat lower boundary of the rising channel. This in itself would not be the termination of the bullish trend, but instead a healthy retracement within the confines of an uptrend structure. But, if the market does break out above the $109,000 level with ample volume and bullish momentum, then things could start changing in the market for the better from there. Such breakout will confirm the uptrend is strong and valid where else new breakout targets will also be set turning the old high into new low. The $109,000 level would then probably move from resistance to support, making it a critical area for bulls to protect on any retests in the future.
A bearish breakout
The ramifications of a breakdown below the rising channel should also be understood by traders. It is crucial to keep an eye on the channel's lower barrier, which is presently at about $104,000. A significant decline below this level would signal a loss of short-term bullish momentum and lead to a more thorough correction. In that scenario, Bitcoin would probably go for the imbalanced area between $97,500 and $100,500, where the price has previously moved quickly without forming any solid support or resistance. Buyers may be able to intervene in this zone and try to restore bullish dominance, which may pave the way for a new breakout attempt and another surge toward the $109,000 barrier.
Conclusion
In conclusion, Bitcoin is at a critical point right now. Bitcoin is currently facing a significant resistance zone at its prior all-time high, but the upward channel that has directed price action since April is still in place. The degree of market momentum and the actions of buyers and sellers at these critical levels will determine whether the price hits new highs or declines. Investors and traders should be alert and ready for both situations since the next action could determine how Bitcoin develops over the following few weeks.
I appreciate your help.
To ensure you do not miss the upcoming analysis, be sure to follow me!
Please leave a remark and a like!

How To Spot The Next Big Algorand Crypto Move!In the fast-paced world of crypto trading, many traders gravitate toward intraday and scalping strategies, chasing quick profits while often ignoring the powerful signals presented by higher timeframes. Yet, the smart money — institutional players, whales, and seasoned swing traders — operate differently. They focus on bigger timeframe supply and demand imbalances to enter high-probability trades with calculated risk and substantial reward potential. One such opportunity is currently setting up in Algorand ( BINANCE:ALGOUSDT ).
Why Higher Timeframes Matter in Crypto Trading
Most crypto traders operate on the 1-minute to 15-minute charts. While this can be effective, especially with crypto intraday strategies, it often leads to overtrading and emotional decision-making. In contrast, higher timeframes — such as the daily and weekly charts — provide clearer market structure, show major supply and demand imbalances, and are less noisy.
These timeframes reveal where whales and institutions place large orders, creating impulsive moves that leave behind clues for patient traders. Ignoring these clues is akin to trading blind.
The Weekly Demand Imbalance on BINANCE:ALGOUSDT
BINANCE:ALGOUSDT is currently showcasing a textbook example of a solid and strong weekly demand imbalance around the $0.1380 level. A few months ago, this zone sparked a massive bullish impulse — a series of consecutive large-bodied white candlesticks that broke through resistance with conviction.
Such moves don’t happen randomly. They’re often the result of institutional accumulation — smart money stepping in with size. These large players create imbalances where demand far outweighs supply, causing prices to rally aggressively. The key for retail traders is to identify the origin of these moves and wait patiently for the price to return.

#COOKIEUSDT maintains bearish momentum📉 SHORT BYBIT:COOKIEUSDT.P from $0.2787
🛡 Stop loss: $0.2925
🕒 Timeframe: 4H
✅ Market Overview:
➡️ A Rising Wedge pattern has formed and broken down, confirming bearish momentum.
➡️ Price has broken below the wedge and the POC level at $0.2976, turning it into resistance.
➡️ Strong volume cluster at $0.2976–$0.2925 is now likely to act as a rejection zone.
➡️ Bearish pressure is visible through high-volume red candles.
➡️ Arrows on the chart indicate a continuation toward the take-profit levels.
🎯 TP Targets:
💎 TP 1: $0.2660
💎 TP 2: $0.2515
💎 TP 3: $0.2395
📢 Watch how price reacts BYBIT:COOKIEUSDT.P to TP1 — weak bounce may signal room for deeper drop.
🚀 BYBIT:COOKIEUSDT.P maintains bearish momentum — further downside expected!

BTC 4H AnalysisBTC overall trend is still bullish based on previous analysis . nowadays we see exact rejection of price from our resistance level. on higher time frame the trend is still bullish. important support levels are highlighted on the chart. The 93-94 zone is the most important one. this zone will determine the direction of BTC movement

Should You Invest in Uniswap $UNI Crypto Right Now?Grab your popcorn, or whatever you vibe with—because today I will analyze Uniswap. Yep, the decentralized trading protocol that lets you swap tokens like Pokémon cards, but without asking mom for permission.
So, what is Uniswap? Simple. It’s like the vending machine of the crypto world. Wanna swap your Ethereum CRYPTOCAP:ETH for some Shiba Inu? Go ahead. No sign-up. It’s peer-to-peer, decentralized.
Remember those juicy monthly demand levels at $3.868 and $4.750 we discussed at the Set and Forget Trading Community? Yeah, those weren't just random numbers pulled from a bingo machine. That’s where big buyers stepped in, creating a supply and demand imbalances. Translation: There were way more people wanting to buy than sell, which made the price go UP. Magic? No. Just basic market dynamics, people.
And guess what? Those levels played out beautifully. Buyers showed up, price popped, and if you were patient, you got paid. If you weren’t… well, you can enjoy your bag of regrets.
Now, here’s where it gets interesting. The daily timeframe is now trending UP. We’ve officially seen the creation of a fresh imbalance at $5.19. That’s our new price level for buying Uniswap. But are we buying right now? NOPE.
Because here’s the golden rule of trading and investing: Patience is key. I know, I know—it’s boring. Waiting feels like watching paint dry… but on the blockchain. But trust me, the market doesn’t care about your feelings or my feelings.
We're waiting for price to pull back into $5.19, where the last big buyers left a footprint the size of a crypto whale. When will it get there? We don't know. THEN we’ll look to repurchase. Not before.
So remember—Uniswap is a beast in the DeFi world. Supply and demand is your best friend. And above all, don’t chase the pump. Let it come to you. Like a well-trained dog… or a well-behaved altcoin.

Just a quick word of WARNING for BITCOIN- Local resistanceEasy to see and understand line od resistance here.
This is trhe line of rejection from 2017 and could well pose a problem in the short term
Technically, PA has the ability to break through this line but we need to see if it does.
BITCOIN is at a crossroads and this is just one of about 3 things that stand in ts way.
As mentioned earlier today, we have crossed one major hurdle today, this is the next one.
Hold on tight Guys and Gals, things could get very interesting but, for now, my preferred move for BTC is to range across for a little longer and come back to this next month
Unless the next 8 days are a strong push above this line and then try and stay above it


ADAUSDT WeeklyLet's see the chart on higher timeframes a bit also for once. Let us examine the bigger levels and bigger picture.

BTC/USD Eyes Breakout Analysis On Weekly Time Frame.Bitcoin (BTC/USD) Weekly Chart Analysis
After facing a long term resistance at 70,000$ which was significant barrier for Bitcoin in the past, breakout occurred recently, indicating a strong bullish signal and a shift in market structure.
BTC is currently trading around $103,025, facing a new resistance zone.
as the fundamental shows that it may break the resistance again after scalping and we may see the bitcoin at the 120,000$.
But the technical analysis indicates that we may see a retest her to validating the zone now as support.
After the breakout, BTC faced selling pressure around the $105,000–$110,000 range, creating a new resistance zone.
If the resistance is not breached, there is the possibility of a rejection occurring which may result in a retracement down to $79,902, which would be a 28.72% drop.
And i think From there if the resistance isn’t broken out of, then it’s most likely a rejection comes and we can expect a fall back to $79,902 which is a 28.72% retracement.
A breakout above the current resistance could trigger a 46% rally towards the $120,409 target.
This would continue the bullish trend post-breakout, supported by momentum and volume.
we will stay focused here and wait for the breakout of the resistance.

BTC 4H Chart Analysis - Bitcoin is currently moving within a range, and two potential demand zones are highlighted on the chart with green boxes. There's a possibility that BTC may pull back into one of these zones to collect buy-side liquidity before continuing higher.
These areas can be considered for long setups on the 15-minute timeframe — but only with a valid entry trigger.
---
📌 Key Levels
🟢 Supports:
- 100,000 – 100,500
- 97,400 – 98,700
- 95,900
🔴 Resistances:
- 104,800 – 105,200
- 105,900
