VRA IS THIS THE COIN THAT WILL HIT 1500% to $0,10 2023
Thank you for reading our update. Please bear in mind that this does not constitute trading advice.
VRA is in a place that can become a historical bottom.
Is VRA one of the dormant giants that could bolster the market capitalization in the near future? Can this coin with its maximum supply be the one to demonstrate a 1500% increase in 2023... but what is the rationale behind this potential surge?
We understand that there are no guarantees in the volatile world of trading. We always assess various possibilities, as accurately predicting the right percentage is a challenging endeavor.
The reason for choosing this coin .. The interest of exchanges follows in data
And second the wallet development shares. The max supply and the technical view.
Further high possibilities with the market cap of now.
Cryptolevels

Bitcoin (BTC) -> Bullish Cycle ComingMy name is Philip, I am a German swing-trader with 4+ years of trading experience and I only trade stocks , crypto , options and indices 🖥️
I only focus on the higher timeframes because this allows me to massively capitalize on the major market swings and cycles without getting caught up in the short term noise.
This is how you build real long term wealth!
In today's anaylsis I want to take a look at the bigger picture on Bitcoin.
Looking at the chart of Bitcoin you can see that just 8 months ago Bitcoin perfectly retested the previous cycle high of 2018 at the $18.000 level and rejected towards the upside.
I think that the whole crypto market but especially Bitcoin is ready for a new bullish cycle and after another short term drop on Bitcoin I do expect a longer term bullish continuation.
- - - - - - - - - - - - - - - - - - - -
I know that this is a quite simple trading approach but over the past 4 years I've realized that simplicity and consistency are much more important than any trading strategy.
Keep the long term vision🫡

#BTC: I'm just simplifying things for you people. Bitcoin (BTC) is currently facing a tough challenge at a price range of $27,700 to $28,000. This zone is like a big wall that's hard to break through.
Why is it so strong? Well, think of it as a triple defense line. First, there's a horizontal resistance. Second, we have the 100-day Moving Average (MA) and the 200-day MA, and they're about to cross. In the past, when the 100-day MA went below the 200-day MA, Bitcoin often went down a lot.
The RSI, a tool that helps us understand if Bitcoin is overbought or oversold, is in a neutral state. It's not giving us a clear signal either way.
For Bitcoin to move up strongly, it needs to break through this $27,700 to $28,000 level. Until that happens, we might see Bitcoin moving sideways or even getting pushed back from this level. If that happens, there's some support at around $21,100. But the most crucial support is at approximately $25,000 – it's essential for the Bitcoin bulls to defend this level.
In simple terms, Bitcoin is at a critical point. Breaking the $27,700 to $28,000 range could mean big gains, but if it can't, we might see it stabilize or drop. Keep an eye on these levels; they'll give us a clearer picture of where Bitcoin is heading.
Have a look at the BTC CMA FUTREST CHART
Even though it's not visible on the big charts (HTF), there's a secret CME gap in Bitcoin. We're curious to see how it all unfolds.
The intrigue is real, and we're here for it!
This chart is likely to help you make better trade decisions if it does consider upvoting it.
I would also love to know your charts and views in the comment section.
Thank you

LQTY weekly pinbarLQTY chart on weekly TF really look weak at the moment because we did double bottom on weekly TF and this current weekly candle look like it want to create bearish pinbar which means a fakeout from the neckline of the double bottom…. And any close above the neckline on weekly TF will triggered the price to at least $1.6 to $2 on daily TF resistance…. Watch closely how the weekly candle close…..
Follow for more market update

ETH - Rebound Soon? 🌦️Cloudy ☁️ and rainy trading conditions 🌧️ lie ahead for the global crypto market in the next 24 hours, signaling a bearish trend with downside risk for most cryptocurrencies. Ether faces an even stronger downward trend, indicating a likely rebound in the short term. 🌦️
Over a one-week horizon, the bearish trend continues for most cryptos, with Bitcoin being the notable exception. A slightly bullish trend with upside potential is likely for the largest cryptocurrency, according to ATTMO. 🌞
Follow us for more crypto weather reports!

Kas/Usdt (Bearish Behavior) Confluences to short:
1. Breaking out of the rising Bear Flag (watching)
2. Head and Shoulder pattern (confirmed)
3. Bearish Divergence on WEEKLY (confirmed)
4. Closing and retesting below 50 days EMA (watching)
Will be updating you guys on step by step process, stay tuned.
NOTE: DON'T SHORT IT YET, WAIT FOR ALL THE CONFIRMATION. TRADE AT YOUR OWN RISK.

LTC Under Pressure 📉, 24H & 1-Week Horizons Cloudy ☁️Cloudy ☁️, rainy 🌧️, and even stormy ⛈️ trading conditions lie ahead in the next 24 hours. This translates into a bearish market with downside risk for cryptocurrencies. Particularly Litecoin, Ethereum, Cardano, Uniswap, and Polkadot may come under pressure. Chainlink bucks this negative trend and has upside potential, according to ATTMO.
Over a one-week horizon, the bearish trend will continue to linger over the crypto universe, except for Bitcoin, Polygon, and Chainlink. Slightly bullish sun ☀️ will shine over this trio, indicating a possible upside in their prices.
Follow us for more crypto weather reports!

BTCUSDT Ready for short sellBTCUSDT Near The Breakdown
1. Below the 50EMA
2. Blow The pivot Line
3. Near The Breakdown

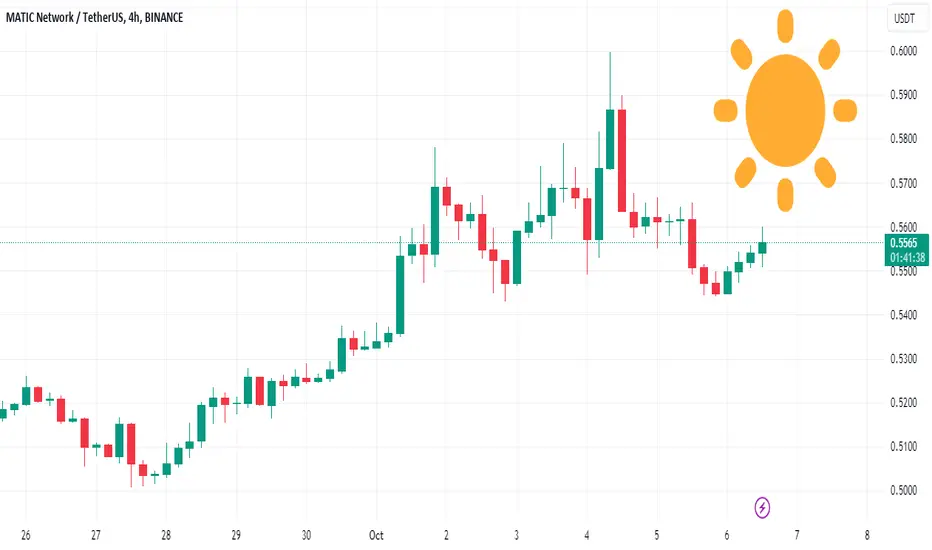
MATIC Faces Rain 🌧️, Next 24 Hours Bearish Cloudy ☁️, rainy 🌧️, and even stormy ⛈️ trading conditions lie ahead in the next 24 hours. This translates into a bearish market with downside risk for cryptocurrencies. Particularly Polygon, Ether, Cardano, and Polkadot may come under pressure.
Over a one-week horizon, the bearish trend will continue to linger over the crypto universe with Bitcoin being the notable exception. Slightly bullish sun ☀️ will shine over the world’s largest cryptocurrency with a possible upside in its price over this longer time horizon, ATTMO forecasts show.
Follow us for more crypto weather reports!

ADA Under Pressure - Next 24 Hours Bearish - Storm Ahead ⛈️Cloudy ☁️, rainy 🌧️, and even stormy ⛈️ trading conditions lie ahead in the next 24 hours. This translates into a bearish market with downside risk for cryptocurrencies. Particularly Ether, Cardano, Polygon, and Polkadot may come under pressure.
Over a one-week horizon, the bearish trend will continue to linger over the crypto universe with Bitcoin being the notable exception. Slightly bullish sun ☀️ will shine over the world’s largest cryptocurrency with a possible upside in its price over this longer time horizon, ATTMO forecasts show.
Follow us for more crypto weather reports!

DOT - Rainy 24 Hours Ahead 🌧️ Bearish ScenarioCloudy and rainy trading conditions 🌧️ loom for the global crypto market in the next 24 hours, forecasting a bearish market with downside risk. Avalanche and Polkadot encounter extremely bearish conditions, hinting at an impending rebound.
Over a one-week horizon, the ☁️ cloudy trading conditions persist. However, Bitcoin, Cardano, and Chainlink glimpse a bit of bullish ☀️, suggesting a potential slight rebound.
Follow us for more crypto weather reports!

BTC to 26450$ BTC is going to test 26450$ support level. Price is going down, Probably it’s going more lower levels.

LINK ☀️ Upside In the Next 24 Hours; Bullish Forecast Cloudy ☁️, slightly bearish trading conditions will linger over the global crypto market in the next 24 hours. Sunnier ☀️ slightly bullish conditions will, however, prevail overChainlink Uniswap, and Cardano, according to ATTMO’s forecasts.
Over a one-week horizon, a mixed picture arises. The sun ☀️ will return and shine over Bitcoin, Litecoin, Cardano, and Uniswap. Other altcoins including Ether, XRP, and Binance face bearish clouds ☁️ and downside risks. Avalanche may even face stormy ⛈️ trading conditions, signaling the risk of a very bearish trend.
Follow us for more crypto weather reports!

XMR BACK IN VOLUME $187Thank you for reading our update. Please keep in mind that this is not trading advice.
XMR can have a new cycle range for uptrend volume
In the coming period, XRM can play new cycle since XMR shows volume

ETH 24-Hour Forecast: Bearish ☁️; Next Week: Bullish ☀️Slightly bearish clouds ☁️ lie ahead for Bitcoin and Ether in the next 24 hours, signaling a downside risk. Altcoins such as Litecoin, Cardano, Polygon, and Chainlink may see sunny ☀️ trading conditions.
Over a one-week horizon, the sun ☀️ should return and shine over Bitcoin and Ether. These improved trading conditions won't affect smaller coins such as Ripple, Avalanche, Binance Coin, and Polkadot, which will face a slightly bearish clouds ☁️ trend, according to ATTMO's forecasts.
Follow us for more crypto weather reports!

CTK START NEW VOLUMECTK looks to have a new volume, this can be confirmed in the coming time for more.
Since 04 OCTO 2023 this coin building for the next increase.

Bitcoin - Bullish Scenario and Bearish Scenario !Hello Traders !
On The Daily Time Frame The BTCUSD Price Reached A Resistance Level (28185 - 27720)
Currently We Have 2 Scenarios:
Bullish Scenario📈
If The Price Breaks and Closes Above Resistance Level !
We Will See a Bullish Move📈
TARGET: 29600.00🎯
Bearish Scenario📉
If The Market Breaks Support Line and Closes Below That
I Will Sell in Retest...
TARGET: 26300.00🎯
___________
if you agreed with this IDEA, please leave a LIKE, SUBSCRIBE or COMMENT!

BTC Buys into $30K I need price to flow into the $30k region so I can begin scaling into my long-term sales. While I wait for this setup to arise, we can take advantage of some short-term buys up into the big round psychological number. I personally believe price could flow up from here without much manipulation or buy trade disturbance.

MATIC Bullish 24-Hours and One-Week Horizon ☀️Bearish clouds ☁️ weigh on the global crypto market in the next 24 hours, signaling a downside risk. However, Cardano, Avalanche and Polygon face more lenient trading conditions, with ATTMO indicating some slightly bullish sun. ☀️
Over a one-week horizon, this slightly bullish sun is set to shine over both major cryptocurrencies – Bitcoin and Ether. ☀️ This upward trend is forecast to be even stronger for Cardano, Avalanche and Polygon.
Other coins, including Litecoin, Ripple, Binance Coin, Dogecoin and Polkadot won’t profit from this sun and will continue to face slightly bearish clouds. ☁️
Follow us for more crypto weather reports!
TRUUSDTTRUUSDT is in strong bullish trend.
As the market is consistently printing new HHs and HLs.
currently the market is retracing a bit after last HH, which is also the 50% fib retracement level and local support as well. if the market successfully sustain this bullish confluence the next leg high could be 0.0440.

BTC Short-Term ☁️, One-Week Horizon Bullish ☀️Clouds ☁️ lie ahead in the next 24 hours for the global crypto market, including Bitcoin and Ether, indicating a slightly bearish market with downside risk. Altcoins such as Avalanche, Chainlink, and Polygon face more lenient trading conditions, with a slightly bullish sun forecast by ATTMO.
Over a one-week horizon, this slightly bullish sun should also shine over Bitcoin, Ether, Cardano. ☀️ Ripple and Binance Coin won’t profit from these favorable trading conditions and continue to face a downside risk.
Follow us for more crypto weather reports!

YGGUSDTYGGUSDT is trading in symmetrical triangle pattern. The price is reacting well the support and resistance of triangle.
Currently the price is at the support of triangle where it is also forming a local support zone and seems like the price may break through the triangle.
If the breakout sustain to upside the optimum target could be 0.25 followed by 0.2670
What you guys think of this idea?

ADAUSDTADAUSDT is in strong bullish trend.
As the market is consistently printing new HHs and HLs.
currently the market is being respected by inclining trendline and has also formed bullish flag pattern which is also being supported by inclining trendline.
These two to gather putting strong bullish confluence for the pair.
What you guys think of this idea?
