ETHUSD CHart AanalysisMy whole strategy is based of the emotional attachment investor have to there money , when i look at cryptos i find a euphoria point (the highest its ever been) and a depression point(where price drops and holds) , i use my Fib to find my Euohoria and depressions points , So far ETH has been holding 2.1k. i Expect multiple touches to this supprt , Utimate entry at 2.1k / my next TP(euphoria) will be @5.2k , i use the my FIb levels to find the space between my previous Eupjoria Points to predict my next euphoria POINT , From 4.27 to 4.77 to 5.3 Fib levels
Follow me @IG:420___247
Cryptolong

BNB/USD investment ideaBNB/USD:
So when we look at the chart we can see that the price has been moving a lot this year. When we look at the all time high this crypto was up for 1701,48%. As we see now we are still up for about 995% on a year basis. That is still very good.
What we can see now on the chart is that the price has been in a little drawdown for now. From the all time high we are down about 40%.
What does is good now is that we can see that the price is at some sort of support and that we are on the 0,618 level of the Fib from the start of the rising wedge which it did just touch but was unable to go below that level of the Fib. This is also a good sign.
There is a possible rising wedge forming which does look valid for me.In my opinion we do get a lot of touches on the wedge and the price did always reverse when we got a hit on the wedge.
We can now see that the price did go below the wedge but did not close below it so that is a good sign. As long as we do not get to see a close below the wedge I think that we are good and that this stock has a possibility to go back up.
What does not look bullish for me for now are all the MA that I draw on the chart. Normally when they are above the price it means that it is more bearish. When they are below the price that it means that it is more bullish.
As we can see the MA’s are above the price so that could indicate a bearish movement. That is why I will be starting small and growing this investment overtime.
We can see that the price does vary a lot and that the crypto has a lot of movement and a lot of wicks when we look at all the daily closes. This is something good and bad. If you trade this for the longer term than it does not really impact your investment a lot. When we look at this in the shorter term so more in the daytrader view than this could be a problem because then you need to keep that in mind before you set your stop loss level and then the risk-reward of the day trade investment could drop a lot. Even so hard that it is not worth it anymore.
For me this is just a longer term investment that I will take and I will not be trading this for the shorter term.
The reason that I am investing in this crypto is because I think that Binance is a good company and is doing good things. The stock to invest in the company can not be traded on the open market but the coin of the company is the next best thing so that is why I am investing into this company.
If you have any questions feel free to send me a message.
If you like the idea do not forget to give it a like and feel free so share your idea on this in the comments.
Everything you see on my profile is just for educational purposes only.

LONG DOGEwe can have long position after broking that trend line,thats just a scenario and it maybe failed
,,,,,,,,,,,,,,,,,,,,,,,,,,,,,,,,,,,,,,,,,,,,,,,,,,,,,,,,,,,,,,,,,,,,,,,,,,,,,,,,,,,,,,,,,,,,

VRA/USDT Will it reach 0.11? ☝️☝️☝️☝️The price structure in this pair from monthly time frame to daily time frame is bullish . Remember in this analysis I will not include entries. I will share a zone where price most likely will start the movement to the desire direction.
In Monthly
The price was over extended. When price is over extended we can expect a correction which already happened. If take fibonacci from low to high you can notice that the 0.618 and 0.786 fibonacci level are in good confluence with structure. We could expect the price to make a retracement to this zones.
In weekly
The price is also bullish . The price is currently holding above an important support. Also, if yo measure the current weekly impulse you will notice that the price is holding above the 0.786 fibonacci level.
In Daily
The price is consolidating. We can speculate that the price is creating more liquidity before start the movement to the upside.
In general the price is very bullish but we have to wait for price confirmations to take an entry.

My crypto.com Coin PlanGood morning everyone,
CRO token reached my target for a possible retracement and profit taking. Right now all my CRO tokens are locked for the crypto.com credit card.
My plan for the CRO is to stay in as long as I am in their ecosystem. We are still early adopters, when they reach 50 million users, the inflow in this ecosystem will be insane, and CRO token will do very well.
Now for my plan, right now I would sell 20% if my coins were not locked because I'm expecting a drop to 25-15 cents next year. This is where I will accumulate enough CRO tokens to upgrade my crypto card and then ride till my next target,55 cents.
What do you guys thin about CRO and their ecosystem?
Feel free to like and comment!

Bull Flag GOES BOOM Still need at least 4hr or 8hr close above this level to confirm in my opinion - target of the bull flag is roughly $230
- Not financial advice
- If you enjoyed this analysis let us know in the comments
- Follow us for more in depth analysis on all cryptos! Cheers, and trade safely

SHIB lotto updateNot a financial advisor.
SHIB has been gaining a lot of hype. Called this from September 11th. This was a lotto play. Well played, hope you all are enjoying the ride!
We recently saw a major pullback and cool off from the .000037 I have a new price target of .000047 with potential to keep riding higher to .000054+ We are seeing fomo kick in hard here, however we are still holding support very well! Careful with entries! Don't buy the tops!
Long Term Target .00014+ I think this will reach beyond a penny. Please DO Research!
Great news came today with the announcement of NOWPAYMENTS = token burn. = $$$
I like this project long term. Momentum is very solid, I still believe in all time highs to come.
Any Elliot Wavers here? Y'all are banking on the trades.
I am holding a core long term ( YEARS) Trading a position to accumulate more. Buying pullbacks as long as the trend continues to say so!
Careful with buying at highs! Don't want to see people get burned!
When do we think Robinhood is coming? Any thoughts?

ETHUSD. Buyiong the reversal candle at 4H chartNow that the stops are cleared we are Buying the reversal candle at the 4H chart. STOP at 2770, Initial target at 3200

MATIC LONGEntry - on or below 1.5- 1.52
sl - 1.25
tp 1 - 1.67
tp 2 - 1.88
tp 3 - 2$
i expect btc to start growing back up now, the fall was only because of high RSI...

Update on the MATIC tradeMatic broke the bearish line... so we can be expecting 1.67 soon for our tp.
like and follow for more analysis an trade
Comment on the crypto pair you want

ANKR LONGbuy area - 0.11 - 0.115
SL - 0.96
TP 1 - 0.15
TP 2 - 0.18
long term - 0.3
like, follow and request for your favourite pair trades

ATMUSDT to Spike up soonGoing by the chart, ATM is moving in ABCDE pattern and what looks like it has already touched point E.
From here on ATM should Spike up soon. Currently it is trading at $19.1 which is best position to go LONG.
Potential targets are $21.485 with around 13% profit and $22.626 with 19.5% profits.
Keep your stop loss at the swing low at $18.557
If you like my analysis then do drop a LIKE and a COMMENT. Also do SHARE it with your friends.
Also don't forget to smash that FOLLOW button to get daily analysis of multiple crypto currencies and sometime ASX stocks.
Note - These are my personal notes and in no way a financial advice. Do your own research and Trade wisely

Ethereum - Bullish - 3k soon $ETHThe chart is self explanatory - once the first bottom solid gold line is held/broken (which it is doing as we speak) look for a test up to the second solid yellow bar above it. Could see this happening within the next 1-2 weeks due to the volatility and the power of crypto.
Down the line long term, I easily see Ethereum at 50k or higher as a initial price target (10-15 years from now give or take)
Hope you guys enjoyed!

131 Day Trend Break BQXUSDPotential major trend break on BQXUSD.
Looks to have found support at FiB 0.786
Great volume on the 4 hour as well.
Could be an interesting one to do more analysis on!


This thing's gonna FLY!!Long term EOS is bound for greatness.
Plus we just moved +12% straight up off of support.
Definitely want to buy a pullback maybe soonish.

SXP is so STRONG!!!Every single mother flippin dip gets bought right back up.
Would be a dream if this appreciates like BNB has now that Binance owns them. Just bought more at $4.88
Beware if BTC starts to roll over and breaks below 53k again.
We are playing with fire a little bit, but if BTC is bouncing then Alts are FLYING!

BullishSxp is acting very strong.
Should see $5.50 soon if this count is correct.
Not financial advice.

NuCypher - Bull Run Incoming?!?!?Analysis:
- Fibonacci Retracement
- Support & Resistance
- Rising Wedge Formation
- Order Block Flow
$0.7827 Inflection Point
Target 1: $1.15
Target 2: $1.32
Opinion:
I believe when price reaches the green star we will have a breakout

TCTBTC (24.04.2021)The price of TCTBTC on the 1W chart broke the downtrend, forming an initial growth momentum.
At the moment, the price has started a local correction on the 1D chart and is trading near the important Fibonacci level of 61.8%.
It is worth paying attention to the 1W chart, where we placed the VITEBTC price chart, on which there was a very similar pattern before the start of the strong growth.
We recommend buying TCTBTC to hold the position up to 0.000006 and above.

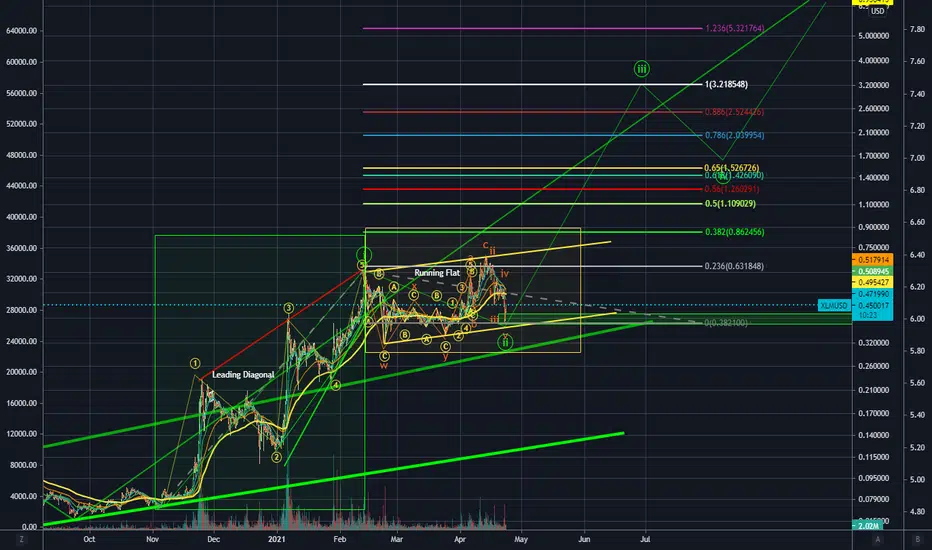
6x gains possible soon!The way I count it and see the patterns, we may be in an extended wave 3 of 3, which is one of the most bullish in the cycle typically.
Pretty sure we just finished wave 2 with a running flat correction, so we should see the price start to move up from here.
This count holds up as long as we stay above $0.35
If we for some reason dip again, I will certainly be buying.
Not financial advice.
Breakout for Mirror Protocol MIRWith everything else going RED as hell , I like the odds on this MIR breakout I'm keeping tabs on in this hourly chart. 30 min looks good, 45, 2 hour and 4 hour all looking good. Would make a few quick bucks and sell at 11 then wait to see if we can volume our way past that 11$ barrier up to the 12.80 fib or if not just buy back in at lower support fib. We will have to wait and see what happens after that. If you would like just ask and I will make another chart once the time comes. No fancy drawings on here today just good ol fashion metrics and thinking about supply and demand. People are going to be looking for any coin that's doing even halfway decent to throw their money at. This is it.. Peace and One Love

ADA USD LongHere you can see my graph and analysis of Cardano (ADA): medium / long term.
Tell me what you think ;)
