BTCUSDTHello Traders! 👋
What are your thoughts on BITCOIN?
Bitcoin has recently posted a new all-time high and is now undergoing a healthy correction. This pullback is expected to extend toward a key support zone, which aligns with both the previous breakout level and the bottom of the ascending channel.
Once the correction is completed near the channel support / previous high, we anticipate a bullish continuation.
The next leg higher could take Bitcoin toward the upper boundary of the current channel.
As long as price remains above the key support area, the overall structure stays bullish and this correction is likely to be a buy-the-dip opportunity within a broader uptrend.
Will Bitcoin use this pullback as a launchpad for new highs? Share your view in the comments! 🤔👇
Don’t forget to like and share your thoughts in the comments! ❤️
Cryptomarket

TradeCityPro | ICP Eyes Breakout as Altseason Speculation Grows 👋 Welcome to TradeCity Pro!
In this analysis, I want to review the ICP coin for you—one of the DePIN and AI-related coins, ranked 37 on CoinMarketCap with a market cap of 3.11 billion.
📅 Daily timeframe
As you can see on the daily timeframe, a ranging box has formed around the key support at 4.648, and price is fluctuating inside this box.
🔔 The top of the box is at 6.205, and price has touched it multiple times. It just wicked into it again and got rejected.
📈 This level has become a very important resistance. If it breaks, we can enter a long position—and it’s even suitable for a spot buy.
🛒 I already hold this coin in spot from lower entry points and don’t plan to increase my spot volume, but I’ll open a futures position if 6.205 breaks.
🔽 If Bitcoin Dominance moves downward, the 6.205 trigger will be a very good entry point. A break above 70 on the RSI will also be a strong momentum confirmation.
📊 If price gets rejected from the top of the box and drops to the 4.648 support, we can open a short position in lower timeframes. A break below 4.648 would confirm the bearish outlook.
📝 Final Thoughts
This analysis reflects our opinions and is not financial advice.
Share your thoughts in the comments, and don’t forget to share this analysis with your friends! ❤️

TradeCityPro | Bitcoin Daily Analysis #132👋 Welcome to TradeCity Pro!
Let’s dive into the Bitcoin analysis and key crypto indices. As usual, in this analysis I’ll review the futures triggers for the New York session.
📅 1-Hour timeframe
On the 1-Hour timeframe, as you can see, Bitcoin is still holding the key support at 116829 and has been ranging between 116829 and 118440 since yesterday.
✨ Today, if the 118440 level breaks, we can open a solid long position. However, I still believe that due to Bitcoin Dominance being in a downtrend, altcoins are a much better choice for opening positions.
✔️ If you're only planning to trade Bitcoin, this trigger is suitable. The next entry points would be 120594 and 122733. If we open positions at all three triggers and the market moves upward, we can get strong risk-to-reward setups since we’ve entered with significant volume across three positions.
📊 If the 116829 level breaks downward, we might see sharper corrections. In that case, the next supports will be the 0.5 and 0.618 Fibonacci levels.
👑 BTC.D Analysis
Looking at Bitcoin Dominance, as you can see, the trend is heavily bearish and moving downward.
⭐ The downtrend in dominance is quite steep, and the next support we have is at 60.49. There’s still room for dominance to drop to this level.
📅 Total2 Analysis
Moving to Total2, yesterday the 1.46 trigger was activated and price moved to 1.5, and it is now sitting just below that level.
💫 If this level breaks, another bullish wave towards 1.62 could form.
📅 USDT.D Analysis
Looking at Tether Dominance, this index is also in a downtrend similar to Bitcoin Dominance, which shows that money is exiting both Bitcoin and Tether and entering altcoins.
🎲 So keep a close eye on altcoins in the coming days, because a lot of capital is flowing into them and they could see significant pumps.
❌ Disclaimer ❌
Trading futures is highly risky and dangerous. If you're not an expert, these triggers may not be suitable for you. You should first learn risk and capital management. You can also use the educational content from this channel.
Finally, these triggers reflect my personal opinions on price action, and the market may move completely against this analysis. So, do your own research before opening any position.

ETH 1H – Breakout or Bull Trap ?
ETH just broke above the 0.236 Fib with a strong push.
✅ Trend structure remains bullish:
MLR > SMA > BB Center.
But something feels off...
🔍 Volume surged late — likely short liquidations.
OBV didn’t confirm — it's still lagging.
RSI is extended. Structure looks tired.
Could be a liquidity grab above recent highs.
If price closes back below the Fib, momentum could fade fast.
📌 Key zones to watch on a pullback:
– 1H 50MA
– Previous support clusters
We’ll be here to watch it unfold.
Always take profits and manage risk.
Interaction is welcome.

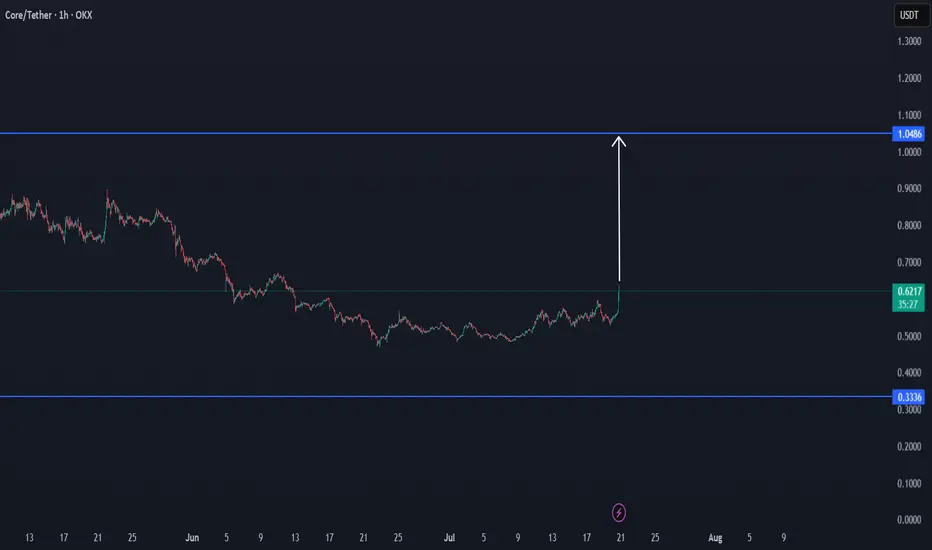
CORE/USDT NEW CYCLE STARTING TO $1CORE looks to enter a new cycle trend, which can confirm an important area, and can be also the reason to enter a new target to $1 with time.
Following this coin, with the upcoming confirmations.
More data?
Check this update for new confirmations.
BTC Daily Outlook
In my opinion, Bitcoin looks like it might need a short pause here.
📉 It's sitting just below a key Fib level and may require some time to consolidate before making another attempt.
📌 Price is printing a possible second close below the BB center.
📉 SMA is below the BB center — not ideal.
📊 Volume saw a strong red spike on July 15
📉 OBV formed a lower high while price remains elevated (granted, it’s the weekend and volume tends to dip).
📉 RSI is below 70 and under its moving average.
Too early for a strong conclusion — but this is a caution signal.
Let’s stay alert and watch it unfold together.
Always take profits and manage risk.
Interaction is welcome.

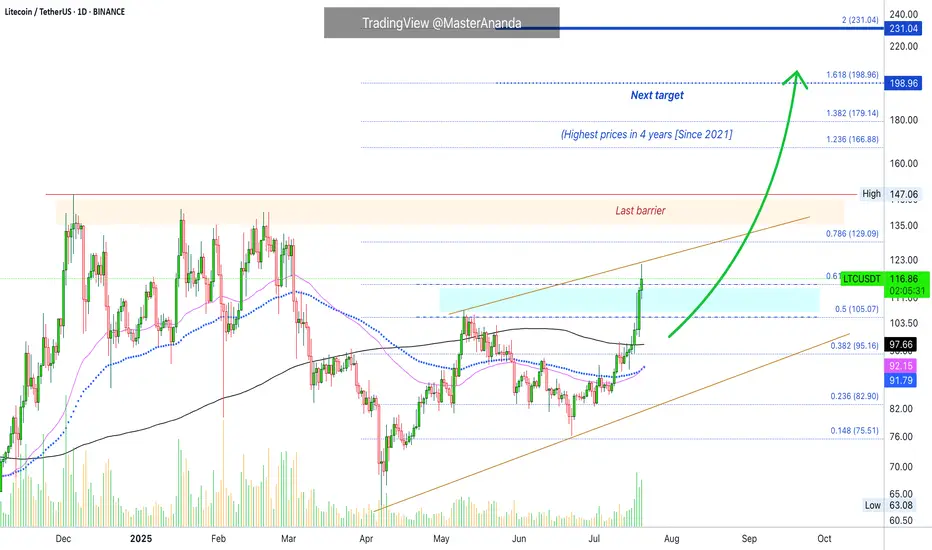
Litecoin's Path Beyond $200 Revealed · Daily TimeframeWe looked at Litecoin on the weekly timeframe which is the long-term picture, but we also need to consider the daily to see what is happening up-close.
As soon as we open this chart we have three signals that stand out:
1) Litecoin is now trading above MA200 safely and rising. This is a very strong bullish development and supports additional growth.
2) Trading volume has been rising significantly being now the highest since February 2025. The difference is that in February we were in distribution, resistance being confirmed with prices set to move lower. In this case, the action is rising from support and volume is rising rather than dropping.
3) May's peak has been broken. Many pairs are still trading below their high in May. Those that broke this level are the ones moving first and this signal exudes strength. Litecoin is now one of the top performers specially in the group with a big market capitalization.
The next barrier is the December 2024 high at $147. Short-term the next target is $129. As soon as the former breaks, we are going to be looking at the highest price since 2021.
Litecoin is fighting resistance today, 0.618 Fib. extension at $115. It is trading above this level but the confirmation only happens at the daily close. If it closes above, bullish confirmed. It if closes below, it means that there will need to be some struggling before higher prices. This struggling can last a few days just as it can extend. Seeing Ethereum and how it is moving straight up, Litecoin is likely to do the same.
Overall, conditions are good for Litecoin on the daily timeframe.
Thank you for reading.
Namaste.
The Crypto Era- Just updated an old chart!
- If you want to know where we stand, it's clearly outlined on the chart.
Some older Analyses :
- HODL strong!
Happy Tr4Ding !

TRB : FREE SIGNALHello friends🙌
📈Given the price reaching its bottom and the buyers supporting it, you can see that a classic head and shoulders pattern has formed and buyers have entered. For this reason, you can buy with capital and risk management and move with it to the specified targets.
🔥Follow us for more signals🔥
*Trade safely with us*

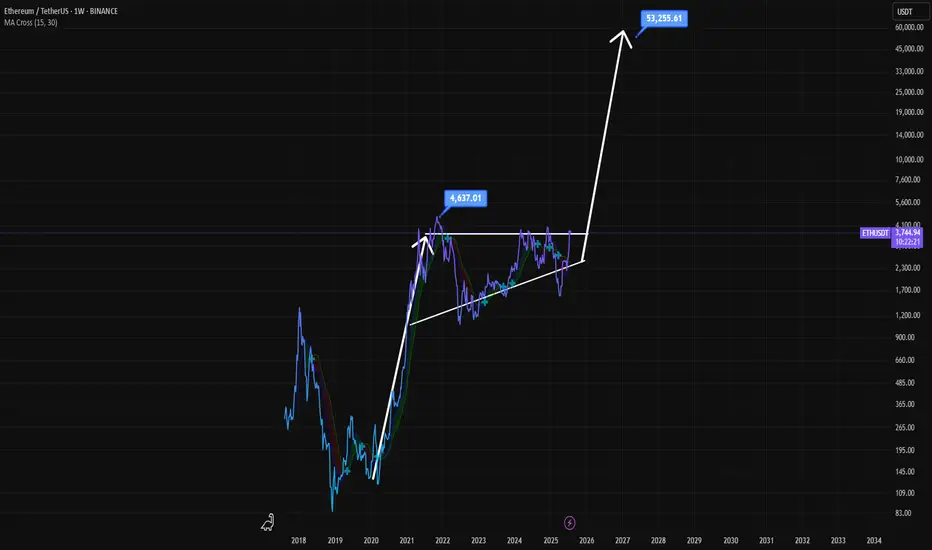
Ethereum's Path to $53,000: Multi-Year Breakout Pattern?This is a long-term technical analysis chart for the Ethereum/TetherUS (ETH/USDT) pair, presented on a weekly (1W) timeframe and using a logarithmic scale. The logarithmic scale is important as it visualizes percentage-based movements equally, which is crucial for analyzing an asset that has experienced exponential growth over many years.
Crucially, the date on the chart is "Jul 20, 2025," which is in the future. This indicates the chart is not just an analysis of past events but a speculative forecast of future price action.
Key Elements and Pattern Analysis
The chartist has identified and drawn a classic bullish continuation pattern known as an Ascending Triangle. Let's break down its components:
The Prior Uptrend (The "Flagpole"): Before the triangle formation, there was a massive upward price move starting in 2020 and peaking in late 2021. This powerful uptrend is the prerequisite for a bullish continuation pattern.
The Ascending Triangle Pattern: This is the multi-year consolidation phase that has been forming since the peak in late 2021.
Horizontal Resistance: The top of the triangle is a flat resistance line drawn at the previous all-time high, marked with a label at $4,637.01. The price has tested this level and failed to break through it, establishing it as a significant supply zone.
Ascending Support: The bottom of the triangle is a rising trendline. The price has made a series of "higher lows" since the market bottom in 2022. This indicates that despite pullbacks, buying pressure is consistently stepping in at higher price levels, showing underlying strength.
The Projected Breakout and Target: The core of this analysis is the prediction of what happens next.
Breakout: The chartist predicts that the price will continue to consolidate within this triangle until approximately late 2025 or early 2026. At that point, it is projected to break out decisively above the horizontal resistance.
Measured Move Target: The extremely bullish price target of $53,255.61 is calculated using a common technical analysis technique called a "measured move." The height of the triangle at its widest part (from the low around mid-2022 to the resistance line) is measured and then projected upward from the breakout point. This results in the highly ambitious target.
Interpretation and Narrative
The story this chart tells is as follows:
After its parabolic run in 2020-2021, Ethereum entered a necessary, long-term consolidation period.
During this multi-year phase, it has been building a massive base of support, with buyers absorbing selling pressure at progressively higher prices (the higher lows).
The chartist believes this long period of accumulation will eventually resolve to the upside, with a powerful breakout above the previous all-time high.
Such a breakout would signal the end of the consolidation and the beginning of a new major bull market cycle for Ethereum, with a projected target far exceeding the previous peak.
Important Caveats
Highly Speculative: This is a long-term forecast. Technical patterns are about probabilities, not certainties, and they can fail. The future date and extreme target price highlight the speculative nature of this analysis.
Pattern Invalidation: The entire bullish thesis is invalidated if the price breaks down below the ascending support trendline. Such a breakdown would be a significant bearish signal, suggesting a major trend reversal instead of a continuation.
External Factors: This technical analysis does not account for fundamental factors, macroeconomic shifts, regulatory changes, or other black swan events that could dramatically impact the price of Ethereum.
In summary, the chart presents a very bullish long-term outlook for Ethereum, based on the formation of a classic ascending triangle pattern. It forecasts a multi-year consolidation followed by a powerful breakout and a new, explosive bull run to over $50,000. However, this should be viewed as one possible scenario among many, with its own specific conditions for validation and invalidation.
Disclaimer: This is not a financial advise. This analysis is purely for informational purposes and should not be considered as investment advice. Trading involves risk, and you should consult with a financial professional before making any decisions.
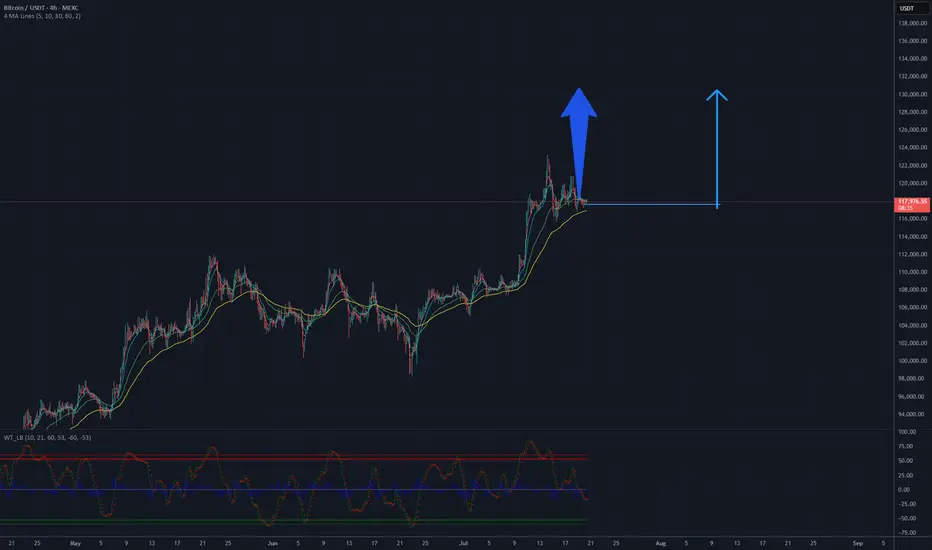
BTC will be 130 K USD? Potential target 130 000 USDAnalysis of the Bitcoin (BTC/USDT) chart on the MEXC platform indicates a positive upward trend. The price is currently hovering around $117,823, with clear support at approximately $100,000, as confirmed by the lower channel line. Moving averages (MA) suggest a sustained upward trend, and the trend line drawn from the lows points to potential for further growth. The current resistance is in the $120,000-$125,000 range, but if momentum holds and this level is breached, the price could head toward $130,000 in the short to medium term. It is recommended to monitor volume and key support and resistance levels to confirm further upward movement.
Potential TP: 130 000 $
ATH FOR Ethereum!!!Hello friends🙌
As you know, Ethereum has been on an upward trend these days and we can say that buyers have entered, but not completely...👀
🔊Now, considering the resistance that Ethereum is facing, namely the number 3900 to 4100, we need to see what reaction the price will see this time when the price reaches this resistance for the 4th time?
✔We will most likely make a small correction and this time this major resistance will be broken again and we will witness a higher ceiling.
✔Otherwise, I have an important and key support that we have identified for you and if the price drops, this support is a good area to buy again.
And finally, observe risk and capital management⚠
🔥Follow us for more signals🔥
*Trade safely with us*

BTC Weekly Recap & Outlook 20/07/2025📈 BTC Weekly Recap & Outlook
Market Context:
Price continued its bullish momentum, fueled by institutional demand and supportive U.S. policy outlook.
We captured solid profits by following the game plan I shared earlier (see linked chart below).
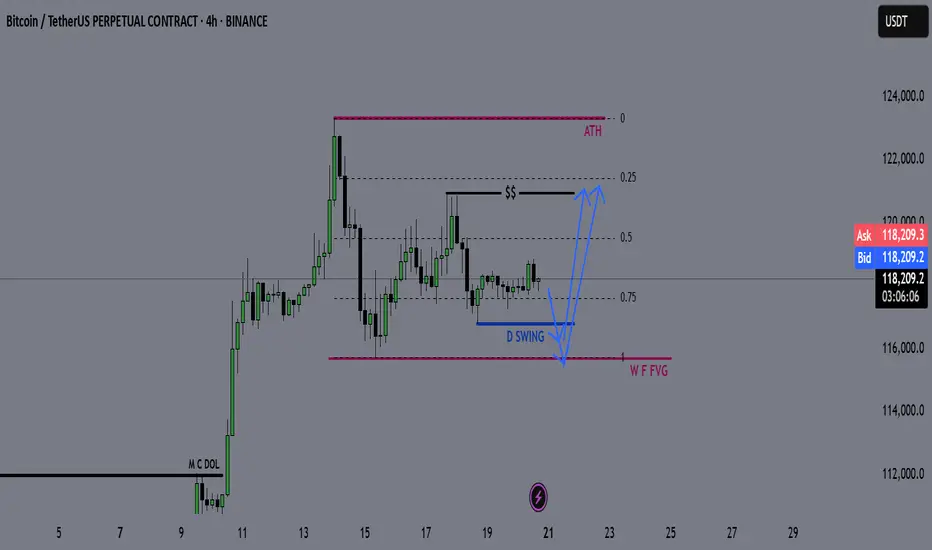
🔍 Technical Analysis
✅ BTC made a strong bullish move, breaking into new all-time highs.
📊 The daily RSI entered overbought territory, which signaled the potential for a short-term retracement or consolidation.
Currently, price is ranging, and RSI is cooling off. That tells me the market is likely building energy for the next leg up — but not before a significant liquidity run.
🎯 Game Plan
I'm watching for one of two potential setups:
1️⃣ Liquidity Sweep to the Downside
- A run of the daily swing low
- Into the most discounted range (0.75 Fib zone)
OR
2️⃣ Tap into the Weekly FVG Zone (marked with the purple line)
Either move would create the liquidity and energy needed to fuel a breakout above the equal highs (EQHs) marked by the black line.
🚀 Target
First Target: EQHs (Black Line)
Second Target: Price Discovery (new ATHs)
💬 Let me know your thoughts or drop your own chart ideas below!
📌 Follow for Weekly Recaps & Game Plans
If you found this useful, make sure to follow for weekly BTC updates, market outlooks, and detailed trade plans based on structure and liquidity.
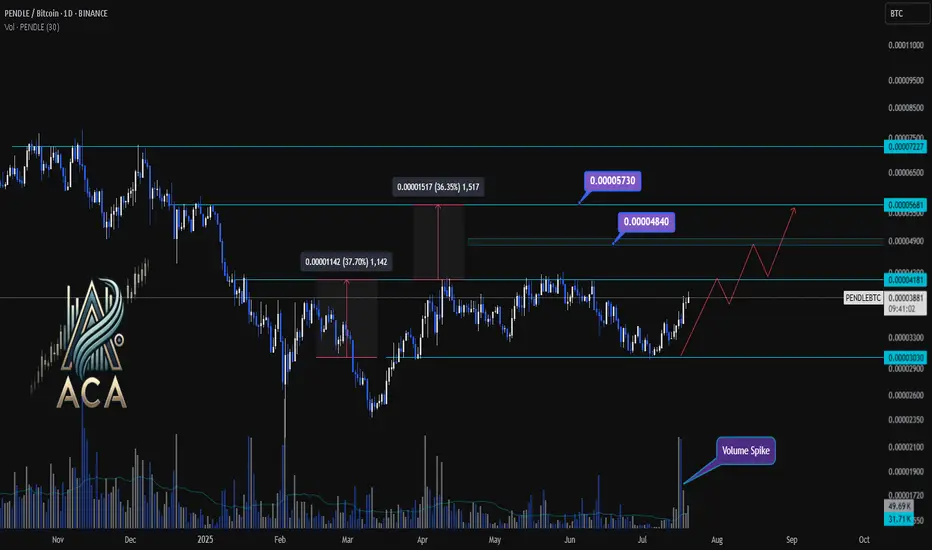
PENDLEBTC 1D Chart Analysis | Accumulation Breakout ConfirmedPENDLEBTC 1D Chart Analysis | Accumulation Breakout Confirmed
🔍 Technical Breakdown
PENDLE/BTC has officially broken out above a key accumulation box, confirming strength as the daily candle closed above the 0.00004181 resistance zone. This marks a significant structural shift after months of sideways consolidation.
📈 Key Observations
Accumulation Phase: The prolonged sideways structure acted as a re-accumulation range. The recent breakout suggests strong hands absorbing supply before expansion.
Breakout Momentum: Prior rallies from this region resulted in +36% and +37% moves. Similar behavior is expected if this breakout sustains.
Target Zones:
🎯 First Target: 0.00004840 (mid-range resistance)
🎯 Extended Target: 0.00005730 (macro resistance)
📊 Volume Spike confirms genuine breakout demand. If BTC remains stable, PENDLE may repeat its historical rally patterns toward the upper resistance zones.
🚀 Conclusion
With a clean close above the range high and confirmed volume, PENDLE/BTC appears poised for further upside. Momentum traders may eye pullbacks into 0.00004180 as potential entries.
TRUMP UPDATEHello friends🙌
👀You can see that the price formed a reversal pattern after falling at the specified support and the buyers supported it.
⚠Considering the entry of buyers, the price is expected to move to the specified targets, of course, don't forget about capital and risk management.
🔥Follow us for more signals🔥
*Trade safely with us*

LITCOIN BUY OR SELL !!!Hello friends🙌
🔊According to the price drop, you can see that the price has been below the specified resistance for a while and when it was able to break the resistance, it shows us the power of the buyers. Now, when we return to the previous resistance, which has now become a support, you can see that the buyers are providing good support and the price is expected to move to the specified targets.
Note that the most important rule in trading is capital and risk management So make sure to follow it.
🔥Follow us for more signals🔥
*Trade safely with us*

Solana (SOL/USDT) 4H Reverse H&S PatternSolana (SOL/USDT) – 4H Market Outlook | July 1, 2025
Introduction
SOL has formed a reverse head and shoulders pattern, followed by a clean breakout above resistance. While the lower time frame is bullish, the higher time frame remains bearish, creating a short-term opportunity within a broader downtrend.
Context 1: Key Zones
Supply Zone: 176 – 187
Demand Zone: 126 – 143
Psychological Levels: 140 and 160
Context 2: Technical Structure
Pattern: Reverse Head & Shoulders
Breakout: Confirmed above neckline/resistance
FVGs:
One below price (within demand)
One above price (potential target)
Golden Pocket: Sits just above lower FVG and inside demand — strong confluence support
Context 3: Volume Insight
OBV Indicator: Shows a sudden volume spike, adding strength to the breakout and the bullish pattern confirmation.
Bullish Scenario
Price pulls back into the golden pocket + FVG + demand zone
Finds support → bounces to form higher low
Second leg of the move breaks swing high → targets upper FVG and 160 psychological level
Bearish Scenario
Price breaks back below demand zone and invalidates the golden pocket
Fails to hold structure → reverts to macro bearish trend
Potential retest of previous swing low below 126
Summary
SOL is showing bullish momentum on the 4H after completing a reversal pattern and spiking in volume. A pullback into the demand zone confluence may offer a strong long setup — but failure to hold could revalidate the higher timeframe downtrend.

LINK START...Hello friends🙌
📈As you can see, the upward trend has started, and the power is in the hands of buyers, and here we have an opportunity to enter a buy trade with risk and capital management to move with the specified goals.
🔥Follow us for more signals🔥
*Trade safely with us*

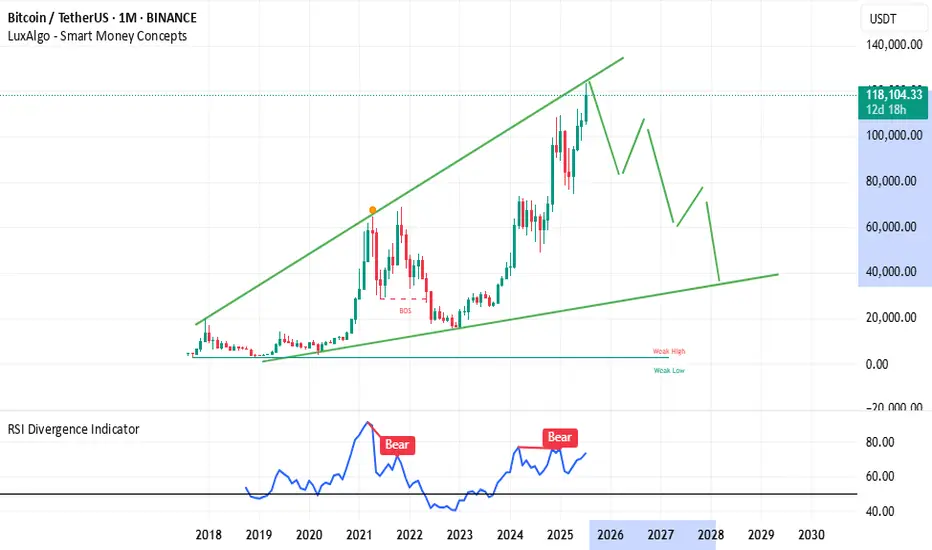
BTCUSDT 1 Month Trading Idea... for next 2 Years...I think BTCUSDT will go back to 30,000 - 40,000 USDT price range befor it will go back to 200,000 USDT
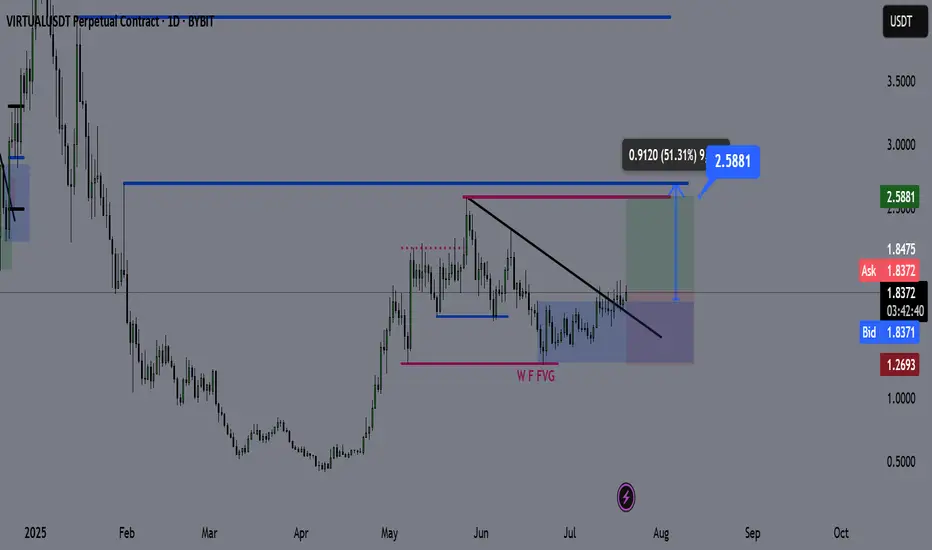
Virtual Coin – Technical Outlook & Trade Plan🔍 Technical Analysis
✅ Price has broken and closed above the bearish trendline, indicating a shift in market structure.
✅ It’s currently consolidating above the trendline, and each retest is showing strong bullish reactions.
✅ The bullish daily demand zone is holding aggressively, reinforcing upward momentum.
I do not expect a significant retracement from here until we reach the purple line (2.59). The current structure suggests price wants to seek higher liquidity.
📌 Trade Plan
Entry: Current market (above trendline + demand zone reaction)
Take Profit (TP): 2.59 (Purple Line)
Stop Loss (SL): 1.26 (Daily Close Below)
📊 Bias: Bullish
🕰️ Timeframe: Daily
📍 Invalidation: Daily close below the demand zone and trendline support
💬 Feel free to share your thoughts or ask questions below!
Jul 20 | Crypto-market reviewNew Crypto-Sunday market review video, where I share my current analysis on the trend structures of BTC, ETH, SOL, XRP, HYPE and other alt- and mem-coins of interest to my, highlighting key support and resistance zones to watch in the coming sessions.
Charts featured in the video
BTC
ETH
XRP
(!) SOL
(!) HYPE
(!) TRUMP
BRETT
(!) FET
RENDER (Weekly)
(!) DOG
(!) MOG
Thank you for your attention and I wish you happy Sunday and great trading week!
If you’d like to hear my take on any other coin you’re tracking — feel free to ask in the comments (just don’t forget to boost the idea first 😉)

ETH on the 1H timeframe
Indicators are showing slight weakness:
MLR < SMA < BB Center
Price is trading below the 50MA
RSI is under the midpoint, and green volume is fading
This could just be a pause before the next leg up
but I’m curious whether the last high of $3,678.86 was this week’s top,
or if price will try to break it tomorrow.
Always take profits and manage risk.
Interaction is welcome.

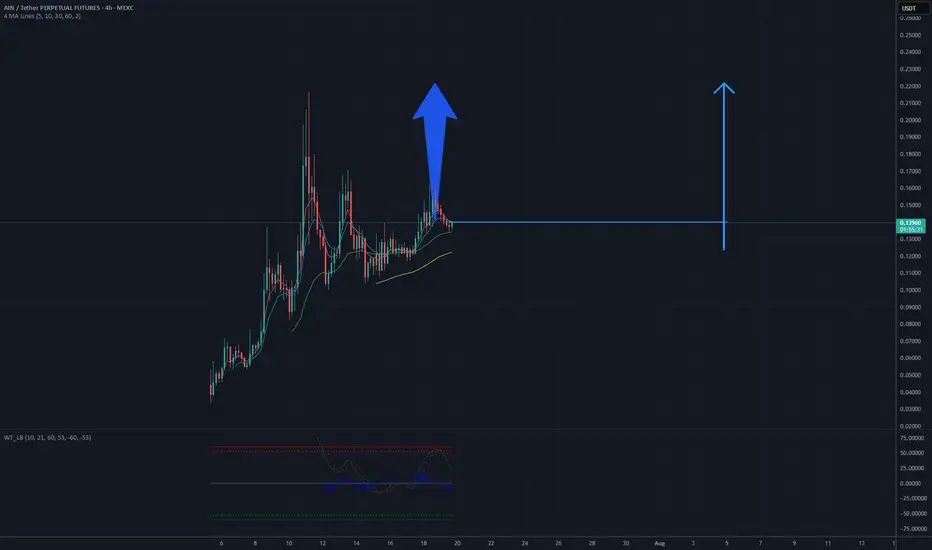
It's a time for AINUSDT! 0.22 USD will be soonAnalysis of the AINUSDT chart on a 4-hour timeframe suggests potential for an upward move. The current price is near a support level around 0.13 USD, where consolidation is observed after a previous decline. The upward price movement from the lows, supported by an ascending trendline and a break above resistance near 0.15 USD, indicates a possible continuation of the trend. If buying pressure holds, the price could test the resistance level around 0.22 USD, which would align with a projected increase of approximately 69% from the current level. Key support to monitor is 0.13 USD, with a break below potentially invalidating this scenario.
Potential TP: 0.22 $