Quantitative Trading Models in Forex: A Deep DiveQuantitative Trading Models in Forex: A Deep Dive
Quantitative trading in forex harnesses advanced algorithms and statistical models to decode market dynamics, offering traders a sophisticated approach to currency trading. This article delves into the various quantitative trading models, their implementation, and their challenges, providing insights for traders looking to navigate the forex market with a data-driven approach.
Understanding Quantitative Trading in Forex
Quantitative trading, also known as quant trading, in the forex market involves using sophisticated quantitative trading systems that leverage complex mathematical and statistical methods to analyse market data and execute trades. These systems are designed to identify patterns, trends, and potential opportunities in currency movements that might be invisible to the naked eye.
At the heart of these systems are quantitative trading strategies and models, which are algorithmic procedures developed to determine market behaviour and make informed decisions. These strategies incorporate a variety of approaches, from historical data analysis to predictive modelling, which should ensure a comprehensive assessment of market dynamics. Notably, in quantitative trading, Python and similar data-oriented programming languages are often used to build models.
In essence, quantitative systems help decipher the intricate relationships between different currency pairs, economic indicators, and global events, potentially enabling traders to execute trades with higher precision and efficiency.
Key Types of Quantitative Models
Quantitative trading, spanning diverse markets such as forex, stocks, and cryptocurrencies*, utilises complex quantitative trading algorithms to make informed decisions. While it's prominently applied in quantitative stock trading, its principles and models are particularly significant in the forex market. These models are underpinned by quantitative analysis, derivative modelling, and trading strategies, which involve mathematical analysis of market movements and risk assessment to potentially optimise trading outcomes.
Trend Following Models
Trend-following systems are designed to identify and capitalise on market trends. Using historical price data, they may determine the direction and strength of market movements, helping traders to align themselves with the prevailing upward or downward trend. Indicators like the Average Directional Index or Parabolic SAR can assist in developing trend-following models.
Mean Reversion Models
Operating on the principle that prices eventually move back towards their mean or average, mean reversion systems look for overextended price movements in the forex market. Traders use mean reversion strategies to determine when a currency pair is likely to revert to its historical average.
High-Frequency Trading (HFT) Models
Involving the execution of a large number of orders at breakneck speeds, HFT models are used to capitalise on tiny price movements. They’re less about determining market direction and more about exploiting market inefficiencies at micro-level time frames.
Sentiment Analysis Models
These models analyse market sentiment data, such as news headlines, social media buzz, and economic reports, to gauge the market's mood. This information can be pivotal in defining short-term movements in the forex market, though this model is becoming increasingly popular for quantitative trading in crypto*.
Machine Learning Models
These systems continuously learn and adapt to new market data by incorporating AI and machine learning, identifying complex patterns and relationships that might elude traditional models. They are particularly adept at processing large volumes of data and making predictive analyses.
Hypothesis-Based Models
These models test specific hypotheses about market behaviour. For example, a theory might posit that certain economic indicators lead to predictable responses in currency markets. They’re then backtested and refined based on historical data to validate or refute the hypotheses.
Each model offers a unique lens through which forex traders can analyse the market, offering diverse approaches to tackle the complexities of currency trading.
Quantitative vs Algorithmic Trading
While quant and algorithmic trading are often used interchangeably and do overlap, there are notable differences between the two approaches.
Algorithmic Trading
Focus: Emphasises automating processes, often using technical indicators for decision-making.
Methodology: Relies on predefined rules based on historical data, often without the depth of quantitative analysis.
Execution: Prioritises automated execution of trades, often at high speed.
Application: Used widely for efficiency in executing repetitive, rule-based tasks.
Quantitative Trading
Focus: Utilises advanced mathematical and statistical models to determine market movements.
Methodology: Involves complex computations and data analysis and often incorporates economic theories.
Execution: May or may not automate trade execution; focuses on strategy formulation.
Application: Common in risk management and strategic trade planning.
Implementation and Challenges
Implementing quantitative models in forex begins with the development of a robust strategy involving the selection of appropriate models and algorithms. This phase includes rigorous backtesting against historical data to validate their effectiveness. Following this, traders often engage in forward testing in live market conditions to evaluate real-world performance.
Challenges in this realm are multifaceted. Key among them is the quality and relevance of the data used. Models can be rendered ineffective if based on inaccurate or outdated data. Overfitting remains a significant concern, where systems too closely tailored to historical data may fail to adapt to evolving market dynamics. Another challenge is the constant need to monitor and update models to keep pace with market changes, requiring a blend of technical expertise and market acumen.
The Bottom Line
In this deep dive into quantitative trading in forex, we've uncovered the potency of diverse models, each tailored to navigate the complex currency markets with precision. These strategies, rooted in data-driven analysis, may offer traders an edge in decision-making.
*Important: At FXOpen UK, Cryptocurrency trading via CFDs is only available to our Professional clients. They are not available for trading by Retail clients. To find out more information about how this may affect you, please get in touch with our team.
This article represents the opinion of the Companies operating under the FXOpen brand only. It is not to be construed as an offer, solicitation, or recommendation with respect to products and services provided by the Companies operating under the FXOpen brand, nor is it to be considered financial advice.
Cryptomarket

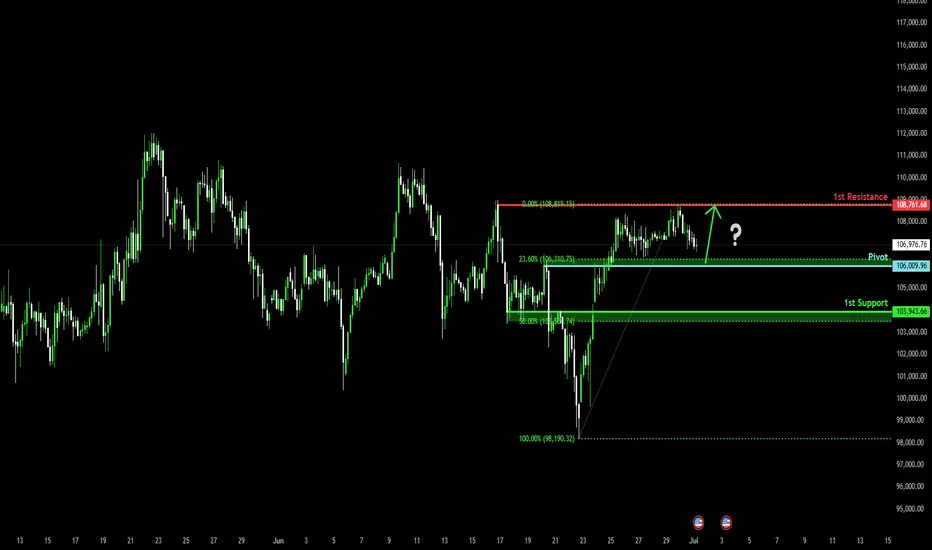
Bullish bounce?The Bitcoin (BTC/USD) is falling towards the pivot which acts as a pullback support and could bounce to the 1st resistance.
Pivot: 106,009.96
1st Support: 103.943.66
1st Resistance: 108,761.68
Risk Warning:
Trading Forex and CFDs carries a high level of risk to your capital and you should only trade with money you can afford to lose. Trading Forex and CFDs may not be suitable for all investors, so please ensure that you fully understand the risks involved and seek independent advice if necessary.
Disclaimer:
The above opinions given constitute general market commentary, and do not constitute the opinion or advice of IC Markets or any form of personal or investment advice.
Any opinions, news, research, analyses, prices, other information, or links to third-party sites contained on this website are provided on an "as-is" basis, are intended only to be informative, is not an advice nor a recommendation, nor research, or a record of our trading prices, or an offer of, or solicitation for a transaction in any financial instrument and thus should not be treated as such. The information provided does not involve any specific investment objectives, financial situation and needs of any specific person who may receive it. Please be aware, that past performance is not a reliable indicator of future performance and/or results. Past Performance or Forward-looking scenarios based upon the reasonable beliefs of the third-party provider are not a guarantee of future performance. Actual results may differ materially from those anticipated in forward-looking or past performance statements. IC Markets makes no representation or warranty and assumes no liability as to the accuracy or completeness of the information provided, nor any loss arising from any investment based on a recommendation, forecast or any information supplied by any third-party.
ETH Pushed Back, Support in Sight
ETH on the 4H just closed below the last daily close and the 0.5 Fib again, after getting pushed back from the 4H 200MA and daily 200MA resistance zone.
The next key supports are the weekly 200MA and the local support zone.
Also worth noting: Trump and Musk are stirring things up again. The last time this dynamic appeared, it triggered a selloff a few weeks ago, even before the conflict began.
Always take profits and manage risk.
Interaction is welcome.

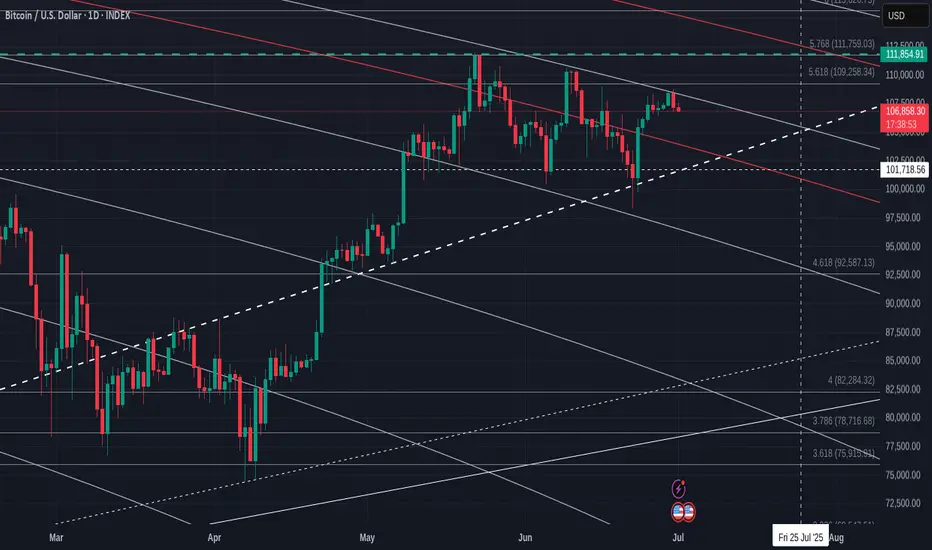
Bitcoin Daily in a large pennant with apex end of July
Bitcoin is once again getting rejected off the Fib circle just above.
This is also just under a 618 Fib extension and so a combined rejection zone.
Beneath this, we have support on that Bold dashed line. This is a Local line of supprt but has strength.
And so, we find outselves in apennant again and that apex is around 22 July.
PA tracts before the apex.
As will be explained in the monthly chart I iwll post later, this all points towards a Calm July, possibly RED month.
PA does however, have the ability and strength to push higher if the Bulls decide to make a move.
The MACD
The Daily MACD is just above Neutral and has enough room to move.
So, if we drop, support is arouns 103K
If we loose that then 100K and then we land on that red 236 Fib circle that will offer a sliding line of support.
But I do not think we will get there just yet
Enjoy
Hashflow Hits Bottom... Notice The Waves... The Large Bull RunNotice the waves... It all starts in January 2023 with a strong advance. 243% total growth. Mid-February 2023 we have a price peak and this signals the start of a bearish trend. Notice the waves...
It all starts with a large wave. As the downtrend unravels, the waves become smaller. Then we have a medium wave and finally a small wave.
As the market hits bottom, you guessed it, 7-April 2025, there is a very strong increase in trading volume. This uptick in volume signals that the bottom is in. Once the bottom is in we can prepare for a change of trend. Long-term growth.
Now we will have the same dynamics but in reverse. First a small wave... The initial bullish breakout. Then a medium wave and finally a large wave which is the end and the bull run.
Namaste.

Short BTC, it is about to retrace and test 100000 again!As BTC gradually fell back, the rebound did not stand above 110,000 in the short term, proving that there is strong selling pressure above, and the trend line formed by the technical high point 111,000 and the second high point 110,000 formed an important resistance area, which limited the rebound space of BTC and strengthened the demand for BTC's short-term retracement.
According to the current trend, the short-term oscillation bottom area of 106,000 may be broken at any time. Once it falls below the oscillation area, it may arouse a certain degree of profit-taking chips and stimulate BTC to accelerate its decline. I think BTC will at least test the 105,000-104,000 area again during the retracement, and may even test the 100,000 integer mark again.
Therefore, shorting BTC is still the preferred option for current short-term trading.
Consider shorting BTC in the 108,000-109,000 area, and the target area in the short term is 104,500-103,500. After breaking this area, the target can be extended to 101,000-100,000.
BINANCE:BTCUSDT BINANCE:BTCUSDT BITSTAMP:BTCUSD

Xrp - The expected rally of +50%!Xrp - CRYPTO:XRPUSD - is still clearly bullish:
(click chart above to see the in depth analysis👆🏻)
Ever since Xrp rallied more than +550% in the end of 2024, we have been witnessing a quite expected consolidation. However Xrp still remains rather bullish and can easily retest the previous all time highs again. Maybe, we will even see another parabolic triangle breakout.
Levels to watch: $3.0, $10.0
Keep your long term vision!
Philip (BasicTrading)

BTC Consolidates Above $100K — Bullish Structure Remains IntactKey Support Holding Firm:
Bitcoin is consolidating above the critical $100,000–$105,000 support zone, a former resistance area from early 2025. Holding this level preserves the broader bullish structure.
Short-Term Noise, Long-Term Strength:
While recent price action shows some lower highs and lows, the long-term uptrend that began in April remains fully intact. This is typical consolidation behavior within a strong bull market.
Wedge Formation Points to Breakout:
A six-month wedge pattern continues to develop, often a precursor to a powerful breakout. If resolved to the upside, the next leg could target the $130,000–$135,000 range.
Outlook Remains Bullish:
As long as Bitcoin holds above $100,000, there’s no technical basis for a bearish scenario. This remains a constructive pause within a dominant uptrend.
#Bitcoin #BTC #CryptoMarket #TechnicalAnalysis #Bullish #SupportAndResistance #WedgeBreakout #LongTermTrend #MarketOutlook #PriceAction

Bitcoin will no longer update ATH, and here's why⚡️ Hello, everyone! I decided to update my idea about Bitcoin. Let's see what awaits us!
Bitcoin rebounded strongly over the weekend and is now trying to consolidate at the $107,000 level. This is a key level, which is the MSB level for the entire current momentum since May, and as long as the price remains below it, it is a bearish movement.
Last week, we also closed the GAP to the $98,000 level from the previous movement, but on the way up, we formed a new one at $105,250 - 101,360. And as we know, 99% of GAPs close sooner or later.
📉 Bitcoin also continues to move in a descending flag, which, although it is a bullish pattern in an upward impulse and more often breaks through upwards, has not been working that way for a long time. Trading based on technical analysis is the basis of crypto and has become very widespread, which is actively used by many whales and counterplayers. As a result, many pattern signals have long lost their relevance and now often give false signals.
⚙️ Metrics and indicators:
Volume - divergence with price since the end of April. Throughout this upward momentum, purchase volumes continued to decline. This indicates a lack of liquidity and demand for Bitcoin at present.
Money Flow - also divergence with price. Also, since the end of April, positions have continued to close and liquidity has continued to decline. This indicates a lack of interest in the asset.
Liquidity Depth - we know that the price moves from liquidity to liquidity, which serves as its fuel. And now there is much more liquidity at the bottom than at the top.
Support/Resistance - Based on the volume of interest, it is clear that the $106,000 level is a major zone, and if it is lost, the nearest support level will only be at $103,004, but with significantly lower volumes.
📌 Conclusion:
Despite all the huge inflows into ETFs, there is now even less liquidity in Bitcoin than in November 2024, when Trump became president.
This suggests that everyone is actively closing their positions and there is no new money coming in. Search queries for the tags “crypto” and “bitcoin” are not even close to last year's levels, let alone 2021 levels. This means that there is no new retail interest in crypto right now.
I don't see any catalysts right now that could keep the price at this level. And ETFs are not an indicator at all; we've already seen how these “smart money” buyers bought at 110k on ATH and sold even more at 70k.
🔥 So, right now, I recommend sitting back and watching. Let the market sort itself out and indicate the direction of movement going forward.

Strategy H2 2025. BTC Airless Plot Near $100'000 Choking PointOver the past 6 months, Bitcoin (BTC) has demonstrated a very mixed up/down performance, marked by significant price fluctuations, appreciation and volatility.
From late December 2024 to June 2025, BTC's price rose from approximately $92,000 to around $108,000, representing a gain of about 17.26% over this period.
On the other hand. the price fluctuated between last price in 2024 $92,000 and BTC' low near $74,491 achieved in early April 2025, posting the similar, nearly 20 percent year-to-date decline.
Bitcoin's price trajectory during this time was influenced by several factors. Early in 2025, BTC reached a new all-time high near $109,000 but faced a pullback triggered by profit-taking and macroeconomic uncertainties, dropping nearly 30% to about $74,000 by April. This decline was short-lived, as Bitcoin quickly rebounded by roughly 24%, climbing back to mid-$90,000 levels and eventually surpassing $100,000 again by June, signaling wide range fluctuations are getting for longer.
The technical setup suggests that Bitcoin is poised for further swings around $100'000 choking point.
In summary, Bitcoin’s performance over the last six months has been characterized by sharp correction, mixed technical buy and sell signals, with no any solid fundamental support from institutional investors.
These factors collectively indicate a mixed outlook for BTC, with further price fluctuations in wide range, as a mid-term pricе action perspective for H2 2025 and for longer.
Similar like a year ago 52-week SMA could be considered as major support level.
--
Best wishes,
@PandorraResearch Team 😎

Bitcoin Mid Term Game Plan - BTC PLANBitcoin just broke a key resistance level with strength.
I expect a new all-time high soon, likely the summer top.
Summer markets are usually weak for risk assets and strong for gold. Seasonality matters, keep that in mind.
I expect risk markets to sell off until mid-July to early August. I’ll start buying once we break structure again.
The plan:
Wait for BTC to hit $110K
Look for a reversal from that level
Start aggressively shorting alts, beginning with ETH and memecoins
Hold shorts until late July / early August
Close positions and shift back to buying

BTCUSDT in a sell zone Let's keep it simple.
The IOF is bearish on the H4 timeframe.
Price has retraced to a premium zone.
Technically, once we see a lower timeframe confirmation from these zones, we take a sell.
While I'm eyeing the liquidity at 109050, any break below 106415 will usher us into a sell towards 99000.
Use your proper entry confirmation and risk management.

Parcl - PRCL-USD - 30 Million Market Cap (100x Potential)www.tradingview.com
CHATGPT Research Summary:
Parcl: Unlocking Real Estate Exposure on the Blockchain
Introduction:Parcl is a groundbreaking decentralized platform that enables traders and investors to speculate on real estate market price movements much like they trade crypto or equities. By combining real-time housing data with blockchain technology, Parcl offers around-the-clock, borderless, and highly liquid exposure to global residential real estate markets. In this comprehensive blog post, we’ll explore what Parcl is, how it works, what it means to own the EGX:PRCL token, the unique opportunities it provides for investors (including AI-driven strategies), its core strengths, and the risks and challenges it faces. The tone is professional, investment-focused, and designed for the TradingView audience.
What is Parcl and How Does It Work?
Parcl allows users to trade real estate price indices for global cities without ever owning or transacting physical property. Each index represents the aggregated median price per square foot/meter for residential properties in a specific city. Users can go long or short on these indices using perpetual contracts with up to 10x leverage, entirely on-chain and settled in USDC.
Built on Solana, Parcl leverages the blockchain's high speed and low fees to offer a seamless and cost-efficient trading experience. Users only need a Solana-compatible wallet (e.g., Phantom) to deposit USDC, select a city index, and place a trade. There are no barriers such as down payments, brokers, or escrow delays — just rapid, decentralized access to global housing markets.
Data integrity is ensured through Parcl Labs, which aggregates millions of housing data points daily to generate real-time city indices. These feeds are streamed on-chain via oracles like Pyth Network, ensuring transparency and reliability.
What Does It Mean to Own EGX:PRCL ?
The EGX:PRCL token is the governance and utility token of the Parcl ecosystem. Holders of PRCL can:
Participate in protocol governance by voting on changes to platform parameters, fee structures, and market expansions.
Access premium real estate data and analytics through Parcl Labs.
Receive airdrops, rewards, or staking incentives as part of community growth and loyalty initiatives.
While PRCL doesn’t currently offer revenue sharing, it grants holders influence over protocol decisions and potential future economic alignment as the ecosystem matures.
A New Asset Class for Investors and AI Agents
Parcl opens up a completely new asset class: blockchain-native, synthetic real estate exposure. This has major implications:
For retail investors, it democratizes access to real estate, which was previously limited by geography, capital requirements, and illiquidity.
For sophisticated traders, it enables granular bets (e.g., short New York, long Miami) and high-frequency strategies previously impossible in traditional real estate.
For AI agents and algorithmic investors, Parcl provides composable, on-chain access to a diversified asset class that can be rebalanced and traded programmatically.
In short, Parcl makes real estate a liquid, programmable, and globally accessible financial primitive.
Core Strengths: Why Parcl Stands Out
Solana-native speed & cost-efficiency: Enables fast execution and micro-investments ($1+), ideal for retail users and automated agents.
Unique data infrastructure: Parcl Labs’ real-time indices provide unparalleled accuracy and granularity.
Sophisticated perpetual AMM model: Handles liquidity and market balancing with dynamic funding rates and cross-margining.
Growing community and product-market fit: With 80,000+ users and over $1.3B in cumulative volume, Parcl is becoming the most liquid real estate trading venue in the world.
Risks and Threats to Consider
Regulatory uncertainty: Synthetic real estate products may eventually face classification as securities or derivatives in some jurisdictions.
Liquidity dependencies: The AMM model depends on sufficient USDC liquidity pools; low liquidity could cause slippage or insolvency risk.
Smart contract vulnerabilities: As with all DeFi platforms, there is non-zero risk of exploits or oracle manipulation.
Platform dependency: Parcl is tightly coupled to Solana — if the chain experiences downtime or congestion, the protocol may be impacted.
Investors should also be aware of token unlocks and potential dilution from early backers and treasury allocations.
Future Outlook and 100x Potential
With a current market cap near $30 million, Parcl represents a high-upside, early-stage bet on tokenized real estate. If the project gains traction and achieves broader adoption, it’s feasible to imagine a future market cap of $2.5 to $3 billion, representing a 100x potential from current levels.
Factors that could drive this include:
Expansion to more global cities
Increased PRCL utility and staking incentives
Growing demand for real-world assets (RWAs) on-chain
Enhanced support for automated and AI-driven strategies
Final Thoughts
Parcl is redefining what it means to invest in real estate. By transforming local, illiquid property markets into a global, composable, and liquid asset class, Parcl enables both human and AI investors to access and trade the housing market like never before.
Whether you’re a trader looking for uncorrelated exposure, a long-term investor seeking innovation, or a technologist building AI agents — Parcl offers a compelling opportunity.
⚠️ Disclaimer: This is not financial advice. Always do your own research and make investment decisions based on your individual risk profile.

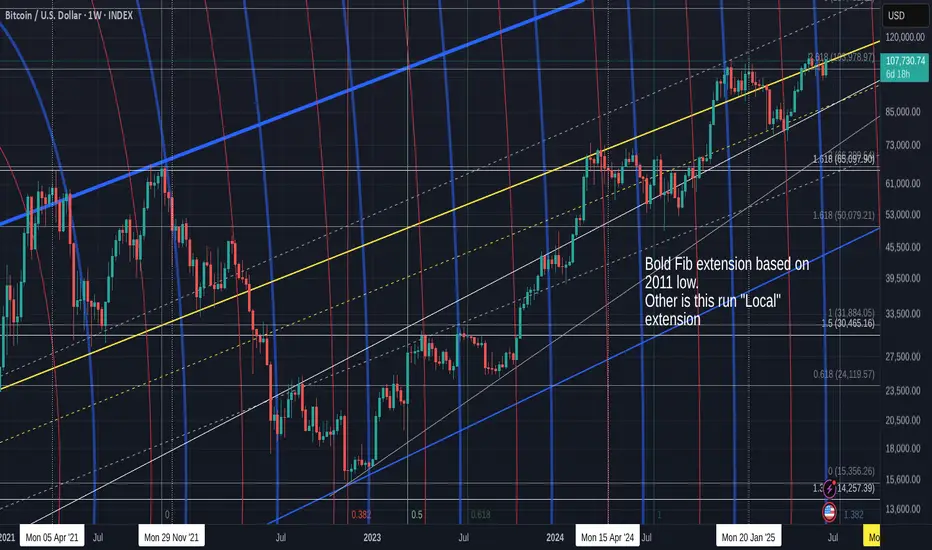
Bitcoin Closed the week with a strong Green candle...now ?PA has been trying to get over that bold trendline since Feb 2024.
It is the same line that PA used back in 2021, to bounce up to the Cycle ATH in Nov 2021.
And we have begun th e week just on Top of it, as we can see in the Zoomed in version of the chart below.
This week is a Big one in many ways.
We also have the Month close today and currently, we have a Big Green candle for that .
If we close with that, historically, it points towards an unsettled summer or a Big push en-route.
More on that tomorrow.
The weekly MACD still has room to climb but I still think we are to see a repeat of where that arrow points.
Th weekly RSI is also in Mid ground and can move in either direction
One thing that has really caught my eye however, is the Volume Delta
See how this is reducing - Could this be the Calm before the Storm ?
And that storm could be Bullish or Bearish. We do have a number of lines of resistance overhead that could prove difficult.
So, hang in there.
My personal opinion is that we are going to see apull back in the near future,,,,,and if we close the month green today, that WILL be next week
Really quick TOTALS charts - possible WARNINGS
It is Very clear when you look at these 4 charts
TOTAL - TOTAL2
TOTAL 3 _ OTHERS
The Top Left chart is the TOTAL chart and is the only one that includes BITCOIN and it is the ONLY one that is above all of its MA's
All of the other charts are heading into resistance on one or more MA's
ALT coins are sailing in to headwinds.
THIS DOES NOT MEAN THEY WILL GET REJECTEWD BUT IT OOES MEAN YOU SHOULD BE CAUTIOUS
Simple as that

Bitcoin short position After my win streak from previous trades on btcusd I happy to give me to the people who followed me
Here's another great trade for you
Short Bitcoin with a limit order at 108,500
Take profit at 101k , stop loss at 109,500
A 7.5 to 1 risk reward ratio 🔥😉
You can never find anybody trade Bitcoin like me

BTCUSD Trade Setup - 28/Jun/2025Hi Traders,
I expect this pair to go Down after finishing the correction.
1) Need to wait for market to show changing of the direction.
2) The first reaction zone foe me will be at 95000 level followed by 89000 level.
3) Need to observe the characteristic of the move coming down in order to understand if market is planning to go up without coming to those levels.
Current expectation for investing is to see market dropping to 89000 level and then start to look for entry.
I only invest in BTC so no shorts for me but market shows potential to give a reversal soon and give a decent down move.

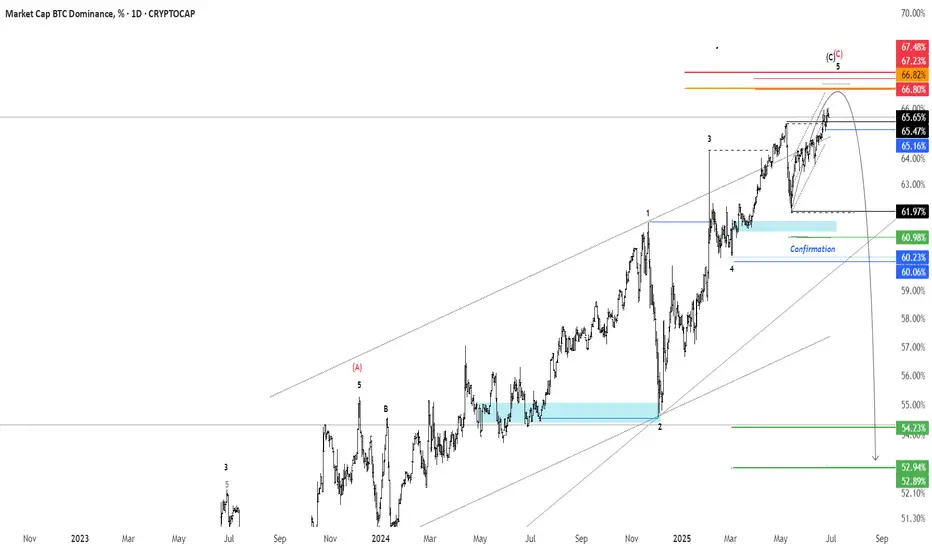
BTC.D - 1D Timeframereversal zone 66.8 : 67.2%
Confirmation : 60.23%
Targets : 52.94% / 31.03
invalid : 67.48%
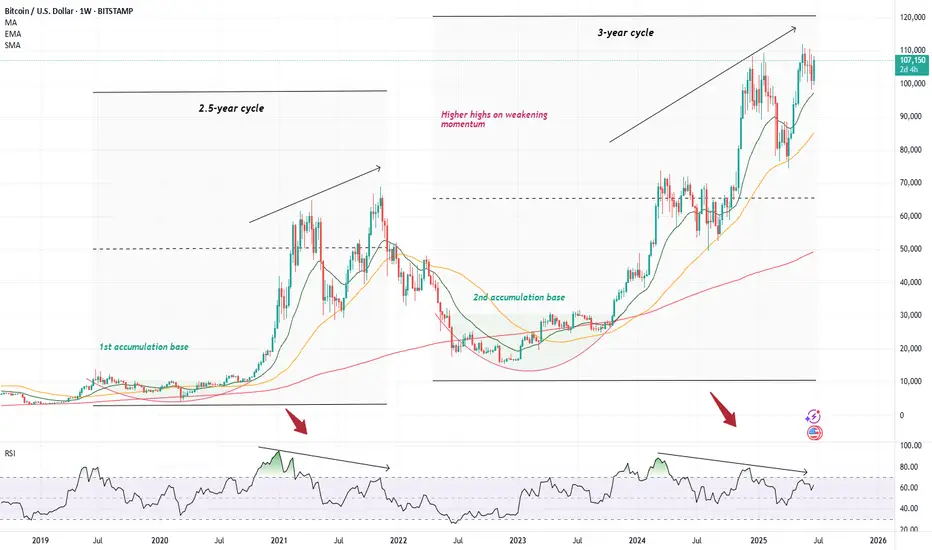
Cautionary tale on BitcoinI decided to temporarily depart from my usual trade ideas to wave a cautionary finger at the chart of Bitcoin, where I have noticed a rather worrying pattern within the weekly charts. However, before I delve in, I would like to stress that I am a very rigid believer in the long-term prospect of our monetary saviour and what I am supposed to write about only concerns the usual, inevitable cyclicality that always entails the otherwise upward-sloping trajectory of Bitcoin ( CRYPTO:BTCUSD )
Although overall this has not felt like much of a crypto bull run given the apparently absent performance of altcoins (apart from an occasional 1000x on a well-targeted memecoin), Bitcoin has, in the meantime, trod its usual path upwards. Since the '22 lows, it has mimicked its regular pattern where after a devastating plummet lower, it has spent several long months accumulating until it has burst out of its cocoon to provide a 6x return to its strong believer. However, the mimicking is almost too good as we have now started painting a very similar picture to what eventually transpired to be the '21 top. We have reached a strong above >100k top only to hit a vicious correction (announcement of tariffs), similar to what Bitcoin did in May of 2021 (China crackdown, tech selloff). The price then quickly consolidated - which I am not an avid fan of as a formation of a more robust base would be more preferable (though would take longer ) - and bitcoin shot back up again, quickly reclaiming the previous highs; just like it did in October/November 2021. This creates an unfortunate setup best represented by the series of lower highs on an RS I while the price keep climbing higher - creating the probably best-know bearish signal with higher highs built on weaker and less robust momentum.
We know how this ended in 2021, and I am not suggesting that Microstrategy should blow up, go bankrupt and sell all its bitcoin (though definitely a possibility) - however, one must admit that there are currently quite a lot of uncertainties that could unwind at any time (one such coming on July 8th with the second version of the lets-blow-up-the-stock-market day). With a stock market priced to perfection, and with what seems like a large pile of uncertainties hovering in the air, it seems like any one of these could light up the fire underneath these lovely valuations we have reached, and although I would love for cryptocurrency prices to be completely independent of the stock market, we usually know how this goes.
So, what to do about this? Preferably nothing . If you are as much of a believer as I am in the necessity of bitcoin in today's financial world, this is just another blip in an otherwise long and profitable ride. So, I won't be any selling any of it - hopefully only adding once we decline. I would also add that I am not expecting as much of a bloodbath as last time. I think Bitcoin has reached a point where the 80-90% declines become very rare. However, regarding my other allocations in crypto assets, I am not as optimistic, hence I decided to sell most of everything else. Although I love the premise of Ethereum, the chart looks pretty horrific, currently drawing a perfect head-and-shoulder on a 4h chart (which I might write about as well as a short idea).
I will end this essay the same way I started it - I know absolutely nothing, and maybe I will come back at the end of the summer, beautifully tanned and relaxed as we all are in Europe, and find everything at all-time highs. I just currently believe the risk-reward ratio is not skewed in my favour, and I don't know how about you, but I tend to listen to my probability gods, especially on the eve of another strong SPAC year .
BITCOIN - SHORT OPPORTUNITY AND LACK OF MOMENTUMBINANCE:BTCUSDT has been lacking momentum in the last few days. It looks to me that "Good News" is almost "No News" in regards to the Iran war or any crypto legislation. Summer is looking a lot like sideways movement, and due to the previous explosion in momentum and volume, I think the lack of it will bring the price down in the following days or weeks.

BTC.D ANALYSIS BTC.D – Daily Chart Analysis 🧠
Bitcoin dominance is forming a rising wedge pattern – a typically bearish structure.
We’re now at the upper resistance; a rejection here could trigger a strong move down, opening the path toward 56–57% levels.
If confirmed, altcoins might get temporary relief.
Watch for a break of the lower trendline for confirmation.
Not financial advice – DYOR

BTC 120K READY ???BTC 4H Chart Update 📉📈
Bitcoin is still trading inside a descending channel, but bulls are now testing the upper trendline for a potential breakout.
Price is consolidating just below $107K, showing strength after the recent bounce from the bottom of the channel.
🔹 Structure: Descending Channel
🔹 Current Resistance: $107K–$110K zone
🔹 Break & close above = bullish breakout confirmation
🔹 If breakout and close above 110k than this target possible
🔹 Target after breakout: $112K-120K+
⚠️ Rejection = pullback likely toward $103K–$104K support
📊 Breakout or breakdown — decision time is near!
#BTC #Bitcoin #Crypto #TechnicalAnalysis #BreakoutSetup
