SCREAMING BULLISHBCH/USDT has nicely rejected the 440 support level. Price is currently consolidating below the 200SMA but i think we will see it break it and continue higher as it did last week.
My target is 485.7
SL is 434.0
Cryptomarket

ETH - SHORT SET-UPBINANCE:ETHUSDT
Short Setup Summary (ETH/USDT Weekly):
Resistance Zone: $2,590–$2,720
View: Expect rejection from this zone
Target: $2,150
Stop-loss: Above $2,914
Setup Type: Supply zone rejection (bearish setup)
Confirmation: Watch for reversal candles in the zone

Bitcoin - We have to see new highs now!Bitcoin - CRYPTO:BTCUSD - is now at the previous highs:
(click chart above to see the in depth analysis👆🏻)
It could really not be more exciting on Bitcoin at the moment. With the current "all or nothing" potential breakout or double top creation, we will either see a bullrun or a bear market. So far, bulls are still strong, so the chances of a breakout luckily remain higher.
Levels to watch: $100.000
Keep your long term vision!
Philip (BasicTrading)

Bitcoin are heading to 114k or 92k A quick little analysis on BTC, we can either push up higher to 114k levels breaking new highs is a must for price action to validate bill swing. However if we break a couple lows be prepared for 92k run down
Kris/ Mindbloome Exchange
Trade Smarter Live Better

Bitcoin Recovers...What we've learned in the past few years is that Bitcoin's demand is just too strong. Retraces and corrections are no longer wild like before, these are limited and capped. Nobody wants to take the risk of selling too much and being left out or losing their Bitcoins for good, they are just too valuable. Many times more valuable than the USD Dollar or Gold. It is the most valuable asset in the whole digital world.
Other than food and toilet paper, nothing is more valuable than Bitcoin.
Technical analysis
Ok, let's focus on the chart.
The retrace has been ongoing for 31 days, since 22-May.
Total drop amounts to 12.33% (-12%).
The action moved below the 5-June low around $100,400. Bitcoin is now back above this level. Clearly showing that this is a stop-loss hunt event.
Stop-loss hunt and liquidity hunt because thousands, if not millions, of over-leveraged traders have been liquidated. They were betting on the wrong side short-term. Long-term yes, bullish is the trend, the direction and the win. Short-term, it was SHORT but not anymore.
Never trade with 20X that's crazy. Imagine going LONG 20X at the all-time high? Isn't that stupid?
I can bet you the same people didn't want to buy LONG when Bitcoin was trading at $75,000. In fact, I can bet that these people that just got liquidated were selling below $80,000 and buying LONG with 20X at $110,000. A recipe for disaster.
Anyway, I am calling it early. This is it, we are going up.
I got my signals, as you already know, from the altcoins.
If you agree boost and follow.
Thanks a lot for your continued support.
Namaste.

Weekly Trendline Support Respected – PEPE Holding UpOnce again, CRYPTOCAP:PEPE is bouncing off its trusted rising trendline — a level that’s acted like solid ground for months.
Every time price hits this trendline, buyers show up. That’s a strong sign bulls are still in the game. As long as this line holds, the uptrend stays healthy.
Next challenge? That resistance zone above. If PEPE breaks through, we could see another leg higher. But if it loses the trendline, things might cool off toward the next support.

$SEI Testing Critical Resistance After BreakoutNYSE:SEI has finally broken above the long-standing resistance trendline, a strong sign of bullish momentum building up.
Right now, it’s facing some pressure at the marked resistance zone. If bulls manage to flip this area into support, we could see the next leg up. But if it gets rejected here, a short pullback or retest isn’t off the table.
Let the level decide the next move — no need to chase.
DYOR, NFA

Market SIGNALS SHOW THAT BTC CAN FALL TO 85K USDMarket follow-up study shows that there is a good chance BTC can fall to 85K in the coming time period. The market cycle seems to end the green trend and to enter a new red zone.
Time will show what really can happen with BTC.
The market can make a fake trend, with a trend fall on a high time frame.
The crash can also happen on the main markets.
This is not trading advice, trade always only depending on your plan.

TONUSDT: Short the Rejection,Buy the Capitulation – A Dual-Level
📉 TONUSDT Technical Analysis – Trending in a Long-Term Descending Channel, Is the Ideal Short Entry Coming?
TONUSDT is currently trading inside a long-term descending channel, with clear bearish momentum dominating the structure.
🔻 Scenario 1 (Early & Risky Entry):
Traders may consider opening a short position from the current level, but this setup carries higher risk, as the price could still push upward toward the upper boundary of the channel.
Stop-loss level is clearly marked on the chart.
🧭 Scenario 2 (Smarter, Low-Risk Entry):
A more calculated approach is to wait for the price to revisit the upper resistance zone of the descending channel (marked as Entry 1 on the chart).
This zone offers a clean low-risk, high-reward short opportunity, with a tight stop-loss and excellent setup.
🎯 Defined Targets in This Analysis:
Target 1: The midline of the descending channel
Target 2: The bottom of the long-term descending channel
💎 Important Insight:
If this bearish scenario completes and the price reaches the bottom of the descending channel, that zone could be a prime buying opportunity for long-term holders.
Technically, it's a major support level and psychologically, it's where smart money often steps in.
⚠️ Disclaimer:
This is not financial advice. This analysis is for educational purposes only. Always wait for confirmation and apply strict risk management when trading.
📩 What’s your opinion on this setup? Do you agree with the short plan, or see another scenario unfolding? 👇

Something Like ThisI believe the charts are pointing towards the market gearing up for a play somewhat like this.
The timing may well be off, but the levels and sequence seem broadly predictable.

False Breakdown on ETH – Bulls Back in Control?CRYPTOCAP:ETH just pulled a classic fakeout move — breaking below a key support and rising trendline, only to snap right back above it.
This false breakdown caught the bears off guard, and now price has reclaimed the support zone with strength.
As long as ETH holds above this reclaimed level, we could see a short-term push higher. Watch for follow-through, bulls need to keep the momentum alive.

Phemex Analysis #92: Pro Tips for Trading Sei (SEI) Sei ( PHEMEX:SEIUSDT.P ) Network’s recent advancements underscore its commitment to extreme scalability, Ethereum Virtual Machine (EVM) compatibility, and streamlined user experience, all backed by strong institutional support and rapid adoption.
The recent launch of Sei V2 marks a major milestone, enhancing Sei’s performance dramatically. With this upgrade, the network now processes an impressive 5 gigagas per second, equating to approximately 200,000 transactions per second (TPS) with sub-400 millisecond finality. Such metrics position Sei among the fastest EVM-compatible blockchains globally, facilitating groundbreaking real-time applications in DeFi, AI, and trading. Improvements like the SeiDB storage layer further boost efficiency by accelerating node syncing and reducing state bloat.
Institutionally, Sei is experiencing remarkable momentum. Recently, Canary Capital filed with the US SEC for the first-ever SEI-based Exchange Traded Fund (ETF), offering regulated access to staked SEI and on-chain yields. Additionally, prominent investors like Circle Ventures, Multicoin Capital, and Delphi Digital strongly validate Sei’s potential as a high-performance Layer-1 blockchain.
These significant developments—technical excellence, streamlined ecosystem, and strong institutional backing—position Sei Network as a top-tier contender in the blockchain industry.
Possible Scenarios
1. Bullish Continuation (Further Uptrend)
Over the past two days, SEI’s price surged by more than 45%, indicating robust bullish momentum. The immediate resistance at $0.292 appears attainable if bullish strength persists.
However, traders should anticipate significant resistance at higher levels, notably at $0.43 and $0.50. Approaching these key levels, market volatility could increase substantially.
Pro Tips:
Profit-Taking: Strategically take partial profits as SEI approaches the critical resistance zones near $0.43 and subsequently $0.50.
Risk Management: Implement protective stop-loss orders just below recent support zones, such as $0.255, to manage unexpected reversals.
2. Rejection at $0.292 (Potential Retracement)
Considering the sharp recent gains in a relatively uncertain market environment, a rejection at the $0.292 resistance is plausible. Should this occur, SEI might seek support at lower levels, primarily around $0.19 and $0.158, before stabilizing.
Pro Tips:
Buy-the-Dip Strategy: Monitor the lower support levels ($0.19 and $0.158) closely. These areas might offer favorable opportunities for accumulating SEI at discounted valuations.
Volume Confirmation: Keep an eye on trading volume during pullbacks; lower volume would indicate a potentially healthy correction rather than a sustained bearish move.
3. Breakthrough $0.292 but Retrace to Accumulate Momentum (Consolidation Scenario)
Another scenario involves SEI initially breaking above $0.292, then experiencing mild pullbacks toward approximately $0.255 to consolidate momentum. In this pattern, price may gradually climb higher, with smaller upward moves interspersed by brief retracements.
Pro Tips:
Long Grid Bots: Leverage grid trading bots effectively to capture profits from the smaller price fluctuations typical in this scenario. Start long-grid bots around the support level at $0.255 and target modest incremental gains.
Patience and Adaptability: Maintain discipline, patiently letting positions unfold while continuously managing your exposure through proper stop-loss placements and profit-taking strategies.
Conclusion
Sei Network’s robust technical performance, institutional backing, and recent bullish price action provide traders with several actionable scenarios. By carefully observing the outlined resistance and support levels and employing disciplined trading strategies—including timely profit-taking, grid bot deployment, and vigilant risk management—traders can confidently navigate SEI’s volatility to optimize returns effectively.
🔥 Tips:
Armed Your Trading Arsenal with advanced tools like multiple watchlists, basket orders, and real-time strategy adjustments at Phemex. Our USDT-based scaled orders give you precise control over your risk, while iceberg orders provide stealthy execution.
Disclaimer: This is NOT financial or investment advice. Please conduct your own research (DYOR). Phemex is not responsible, directly or indirectly, for any damage or loss incurred or claimed to be caused by or in association with the use of or reliance on any content, goods, or services mentioned in this article.

SEI/USDT – Bullish Breakout Setup!SEI consolidates in a classic ascending triangle, showing a strong structure with higher lows and flat resistance.
A breakout above ~$0.225 could trigger a move toward higher targets.
Key Levels:
Support: $0.2142 (triangle base)
Resistance: $0.2257 (breakout level)
Stoploss: Below $0.214 (invalidation of structure)
Targets on Breakout:
TP1: $0.2514
TP2: $0.2724
RSI is climbing from mid-range with a bullish crossover, indicating strengthening momentum.
Structure looks favorable as long as support holds. Wait for volume confirmation on breakout for higher probability.
Not financial advice. Do your own research before investing (DYOR).

Pullback resistance ahead?The Ethereum (ETH/USD) is rising towards the pivot which has been identified as a pullback resistance that lines up with the 50% Fibonacci retracement and could drop to the 1st support.
Pivot: 2,483.49
1st Support: 2,289.88
1st Resistance: 2,655.92
Risk Warning:
Trading Forex and CFDs carries a high level of risk to your capital and you should only trade with money you can afford to lose. Trading Forex and CFDs may not be suitable for all investors, so please ensure that you fully understand the risks involved and seek independent advice if necessary.
Disclaimer:
The above opinions given constitute general market commentary, and do not constitute the opinion or advice of IC Markets or any form of personal or investment advice.
Any opinions, news, research, analyses, prices, other information, or links to third-party sites contained on this website are provided on an "as-is" basis, are intended only to be informative, is not an advice nor a recommendation, nor research, or a record of our trading prices, or an offer of, or solicitation for a transaction in any financial instrument and thus should not be treated as such. The information provided does not involve any specific investment objectives, financial situation and needs of any specific person who may receive it. Please be aware, that past performance is not a reliable indicator of future performance and/or results. Past Performance or Forward-looking scenarios based upon the reasonable beliefs of the third-party provider are not a guarantee of future performance. Actual results may differ materially from those anticipated in forward-looking or past performance statements. IC Markets makes no representation or warranty and assumes no liability as to the accuracy or completeness of the information provided, nor any loss arising from any investment based on a recommendation, forecast or any information supplied by any third-party.

A TA Macro Look into Bitcoin to assess directionThis is a look into the macro developments happening currently in Bitcoin.
This is strictly a TA look into the big picture. We zoom out to Timeframes bigger than 1W.
At times zooming in to check (3 Day, 5 Day, maybe 1D) for potential swing trades.
I tend to look into things like price action, indicators, volume and other data to sway probabilities of where an asset may go and determine best opportunities of supply and demand zones based on my interpretations.
So jumping right in this is a look into price action on the 1 Month timeframe.
Notice trend lines drawn.
Notice the Ascending channel.
Notice the Blue rectangle zone.
Notice this months (June) Candle
Our current June candle is in a critical area.
We are around the horizontal resistance zone, indicated by red horizontal line.
This red horizontal resistance line is a powerful one.
Our previous interaction generated a massive Bearish engulfing monthly candle.
This area is not to be joked with and would urge to consider looking for more signs or better data to support continuation of bull run. If not a sell off is in the cards.
Notice our current June candle
Having equal length upper and lower wicks indicate that this month was neutral.
Bulls nor the Bears came on top.
If we close around this in 8 days.
Probabilities would be 50/50 just based on price action and candles for price movement in July.
We would need to look for other signs in indicators or something else, in other words look for confluence of multiple signs whether bull or bear.
The Ascending channel is also in my opinion over extended.
Notice the price action touch points on Green ascending support line.
The duration between touches is coming down.
2nd touch happened 365 days after first. Which was the initial part of Crypto bull market.
3rd touch happened 214 days after.
We are currently 61 days in after 3rd touch. Considering this and being logical, we could be getting close to another touch.
But consider also that the duration can extend well into in the 100's (of days), before we touch.
Notice also the Blue rectangle zone. This marks a side ways range of bitcoin.
The orange horizontal line is mid point of this blue zone.
A scenario could be that price goes to where the orange horizontal line meets the green sloping support line.
The confluence of these 2 support lines, can be a decent area for potential bounce (which can be temporary).
A break down of these 2 lines could also lead Bitcoin back down to the lower border of the Blue rectangle also indicated by Green horizontal line, which is a massive supply zone at the moment.
This scenario in my opinion would be a high probability trade by looking for bounce up but please keep in mind this does not mean a bull run would continue.
Look for more posts as things develop on Bitcoin.
DISCLAIMER: This is not financial advice, i am not a financial advisor. The thoughts expressed in the posts are my opinion and for educational purposes. Do not use my ideas for the basis of your trading strategy, make sure to work out your own strategy and when trading always spend majority of your time on risk management strategy.

Bitcoin (BTCUSDT) - Price Testing Resistance after Morning StarBitcoin (BTCUSDT) price is currently testing the resistance zone of $105,000 to $110,000 (yellow lines).
A morning star candle pattern has formed above the 100 ema (orange line), which is also $100,000 price support.
Some bullish momentum is forming on the MACD Histogram, however, Bitcoin is still technically in a short-term downtrend for the past 30 days.
Bitcoin price needs to create a new uptrend on the daily chart, a series of higher-highs and higher-lows in the price, which could take several months.
At this time, Bitcoin is still reacting to global news and stock market correlations.

Strong support found on DOGEDOGE/USDT is currently at a critical suppot This level is likely going to hold and push price higher... The daily also aligns with it .
My target is 0.1616
SL is 0.1405

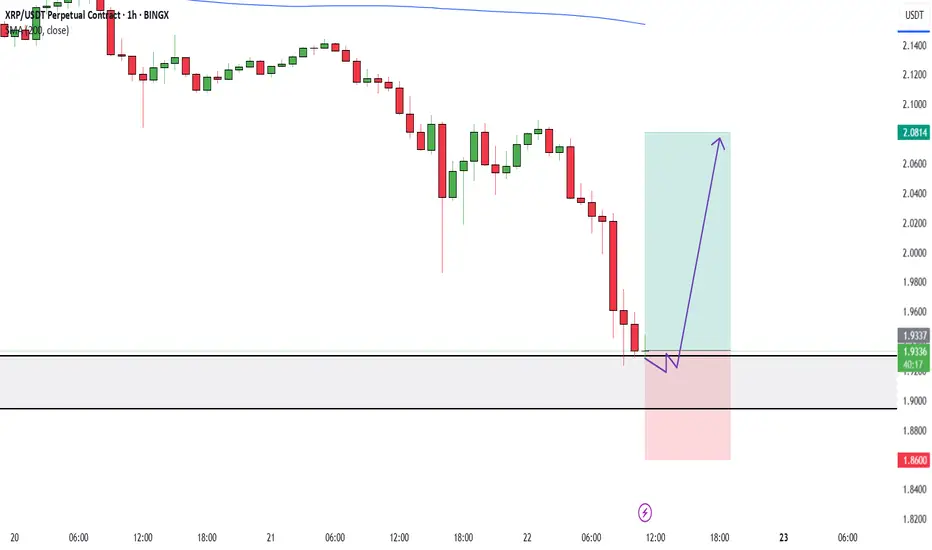
XRP should make a strong rejectionPrice is currently oversold and has eaten most the liquidity it could take for the current session. The 1.92 should hold and offer a bullish reversal in the short term.
My target is 2.0814
SL is 1.8600
Watching for a Double Signal on ETH ETH 4H – Watching for Dual Signal Confirmation
ETH is now trading above the BB center, with both the MLR and SMA also above.
PSAR hasn’t flipped yet, but if upside continues, we could see a bullish flip soon.
If PSAR flips while price holds above range low, that’s a potential dual signal (trend + structure).
Still, this is speculative—price could easily reject here and head lower.
Reminder: ETH remains under the 200MA on both the 4H and daily timeframes.
However, it’s currently holding the 5D 200MA. Idea on that coming soon.
Always take profits and manage risk.
Interaction is welcome.

Bitcoin Tests Key Support-Healthy Correction Within Bull MarketHealthy Pullback, Strong Structure:
Bitcoin’s recent dip is a constructive correction within a broader bull trend, as it tests the critical $100,000–$105,000 support zone—a former resistance area from early 2025.
Institutional Demand Holds the Line:
Maintaining levels above the psychologically important $100,000 mark highlights continued institutional accumulation and reinforces the underlying strength of the trend.
Momentum Reset, Base Building:
This pullback has helped reset overbought conditions from the prior rally, laying the foundation for the next potential leg higher.
Key Levels to Watch:
Support: $100,000–$105,000
Breakout Trigger: A close above $108,000 would confirm uptrend continuation
Outlook: Bullish bias remains valid as long as support holds
Investor Opportunity:
With structure intact and downside contained, this consolidation presents a favorable risk-reward setup for long-term investors looking to position ahead of a potential breakout.
#Bitcoin #BTC #CryptoMarket #TechnicalAnalysis #SupportAndResistance #BullMarket #RiskReward #InstitutionalBuying #MarketOutlook #PriceAction

Bitcoin Bounce Alert: Holding the $100K Fortress! 📉 Market Context & Technical Levels
Key support at ~$100K: As the chart shows and multiple analysts confirm, this level continues to act as a strong defence zone. Cointelegraph noted bulls have been “defending the $100K key support level strongly,” triggering bounces during dips
Descending channel overhead: Bitcoin has retraced into a downward channel. A clean breakout above ~107K–109K (past recent peaks) is needed to signal a bullish shift .
Liquidity target at ~106K: Plenty of orders await in that region—flipping it to support may pave the way for another push higher .
📊 Indicators & Momentum
RSI dip near 25 during the latest drop indicates oversold conditions—often a precursor to rebounds
.
Volume surge on rebounds suggests absorbing sell pressure and strong accumulation interest at lower levels.
🚩 Key Price Zones to Watch
Level Significance
$100K Crucial support; losing it risks a slide toward $95K–97K or even $92K
.
$105K–106K Liquidity zone; flipping here as support could confirm upward momentum .
$107K–109K Resistance from channel tops and prior highs; a successful break is key to next leg up .
$112K–$112K+ If breakout occurs, upside targets extend toward prior ATH near $112K and beyond .
🎯 Chart Analysis Summary
Your chart shows three distinct bounces from the $100K–100.7K supply zone (highlighted in blue) and the latest one includes a sharp wick and rebound. This aligns with broader market dynamics emphasizing support at $100K and building liquidity at $106K. The arrow projection signals a probable retest of ~106K, with room to challenge ~107–109K after consolidation.
🧭 Trade Outlook
Bullish scenario: Hold above $100K → reclaim $106K → trendline breakout → potential rally to $112K+.
Bearish risk: Fails support at $100K → breakdown toward $95K–92K region.
📌 Bottom Line
Support $100K is alive and well. Bounces have been crisp and volume-backed.
Next test lies at $105–106K. That’s the battleground—flip it, and we may see bitcoin reclaim recent highs.
Watch the channel overhead (~107K–109K). A breakout could open the door to fresh records.
✅ Conclusion: BTC is defending its psychological base firmly. If this zone holds once more, the path to $106K and beyond is in focus. Breaking above demands conviction, but it’s the pivot to watch.

ETH BUY BIASEthereum (ETH/USD) – Weekly Chart Summary
• Current Price: ~$2,250
• Trend: Bearish structure with lower highs and lower lows
• Key Zones:
• Support (Demand): $1,800–$2,000 and $1,400–$1,700
• Resistance: $2,800–$3,600 (liquidity zone)
• 200-Week MA: Acting as dynamic support near current levels
• Outlook: Potential drop into demand zones, followed by a strong bullish reversal targeting the $3,200–$3,600 region
• Risk: Failure to hold $1,800 could trigger deeper losses
📈 Bias: Wait for price to reach key demand zones before entering long positions.

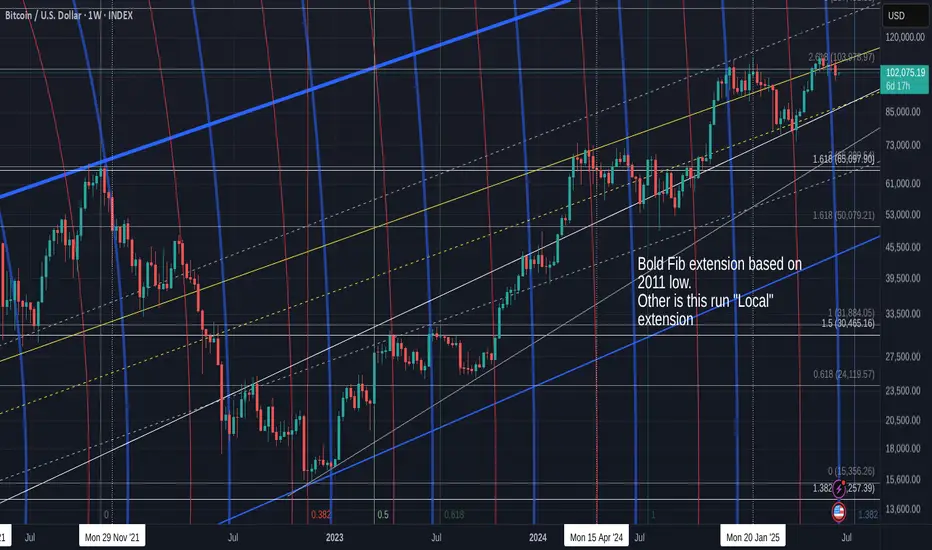
Bitcoin Closed week RED and opens Green but is back in channel
As the title says, BTC PA has fallen back in channel that offers a potential low in the High 80K should confidence fail.
PA also lost support on the Local 2.618 Fib extension.
This is a shame and poses potential problems reclaiming that.
I will say, that I do not consider this a long term Bearish beginning but it could certainly add to the "Calm" Summer I have talked about.
I say "Calm", that does depend on the world not entering a level of Madness.
The Zoomed chart below shows more detail
Here we can see clearly how PA got rejected off that upper trend line, fell through the 2.618 and is currently being rejected by it.
The potential for a further drop does exist and if we repeat the "Pattern" we have since the beginning of 2024, of bounce off Lower trend line, get rejected from Upper zone, re test lower as support and bounce again, we can expect to revisit 89K
This idea is supported from this LINEAR Daily chart
The dashed Trend line that is arrowed has origin in Sep 2024 and was also used again in April 2025.
That intersection the arrow points to is the intersection with the current supporting Fib circle at around 88500 USD
None of this is certain but these levels exist as support.
PA also has the ability to move higher
The Weekly MACD below shows us how MACD is turning down towards its signal line ( red)
We did this before in Jan 2024 ( Arrow) and The MACD bounced.
We talked about this possibility a few weeks ago But on a Daily MACD, things do look a little different.
The FEB 2024 looked like this, Bullish, rising and above Neutral
Currently, the Daily MACD looks like this
We just fell below Neutral and the Signal line just hit it
We may seea bounce but we need to have the idea that this may continue to drop a little further.
But the White bar on the Histogram shows us some recovery is currently in progress
We will have to watch the rest of this month closely. This time next week is last day of month.
I have mentioned a number of times that a small RED Month candle would be potentialy good.
We are currently Only just GREEN, so a further Drop in price is actually almost expected this week.
Interesting days ahead