$RPL 4H AnalysisGETTEX:RPL 4H Analysis 🔥
RPL is currently trading at the lower boundary of a parallel ascending channel, which has acted as strong support multiple times in the past. The price action shows a clear higher high, higher low structure, indicating an ongoing uptrend.
Currently, the price is hovering around the key horizontal demand zone ($5.5–$5.8). This level has previously acted as a launchpad for aggressive bullish moves, and we are seeing early signs of accumulation again.
Bullish Scenario:
If the support holds, RPL is likely to retest the midline of the channel around $7, followed by a potential breakout toward the upper trendline near $9 – $9.5.
The risk/reward setup here is highly favorable for swing traders.
What to watch:
Hold above $5.5 = bullish continuation likely 🚀
Break below $5.5 = invalidation of structure ⚠️
📈 Conclusion:
Structure remains bullish. This is a textbook channel bounce setup with targets of $7 → $8.5 → $9.5 if momentum kicks in. Volume confirmation will be key.
#RPL #RocketPool #CryptoTrading #Altcoins #BreakoutSetup #TechnicalAnalysis
Cryptomarket

BTC 4H Analysis📈 BTC 4H Analysis – Symmetrical Triangle Breakout Loading
Bitcoin is currently consolidating inside a Symmetrical Triangle, forming higher lows and lower highs – a classic sign of volatility compression.
🔹 Structure: Symmetrical Triangle
🔹 Support Holding Strong – bulls defending the zone
🔹 Breakout Expected Soon
🔹 Major Resistance: $110,200
🔹 Breakout Target: $112,000+
Price is coiling up. Break above the triangle = strong bullish continuation likely.
🚀 Eyes on breakout — next move could be explosive!
NFA | DYOR

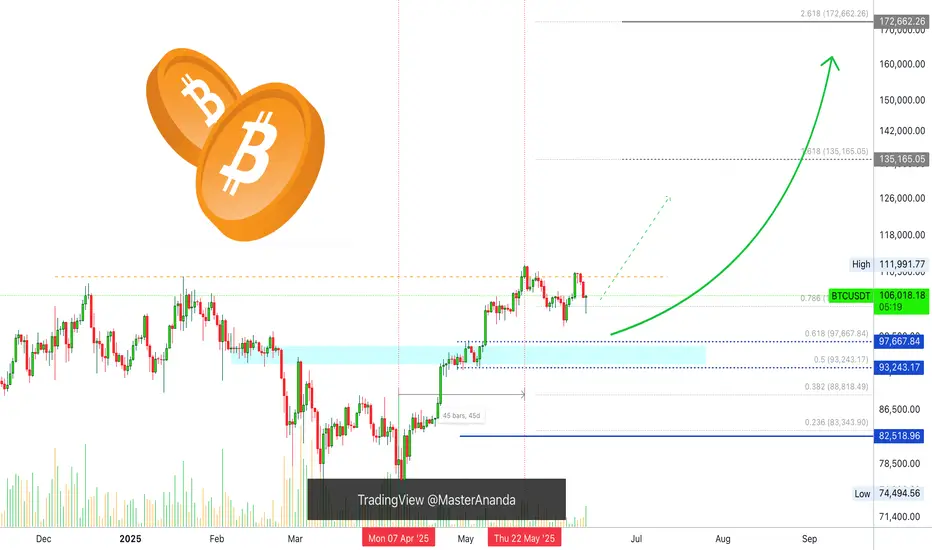
Bitcoin Mid-Term, 4H Timeframe, Bullish ($119,165 Next Target)On the 4H timeframe we have a consolidation pattern with a bullish bias. Bitcoin is aiming higher after a close above EMA8 & 13 with higher lows.
The drop 13-June found support perfectly at 0.786 Fib. retracement on a wick. The session closed above 0.618. The action turned bullish immediately and we are seeing slow but steady growth.
The recent drop was a market reaction due to a geopolitical situation. As soon as the event is priced in, the market seeks balance and goes back to its previous trend.
Bitcoin's bullish bias is not only supported by strong prices, $105,600 is very strong, but also by the altcoins and the cyclical nature of the market.
While Bitcoin already produced several new all-time highs this year the altcoins are yet to do the same. A bull market happens every four years or the year after the halving. For Bitcoin this is already true but this is a marketwide event and the altcoins are yet to go there and this is a bullish factor and soon this will be obvious on the chart.
We are 5-6 days away only from very strong bullish action. Notice that this isn't a long time, it is less than a week. The altcoins will reveal this bullish bias much sooner than Bitcoin but Bitcoin will also grow and hit a new all-time high soon. This new all-time high will be the catalyst for everything to boom.
» Ignore the short-term it is all noise—crypto is going up.
The next target is $107,558, followed by $109,508 on this timeframe. The latter being a mild resistance.
The main target here is $119,165 and this is a good resistance zone. It can be rounded up to $120,000. If this level gets hit it will only confirm additional growth. The target that follows is $130,000 and the minimum for this cycle is $160,000 but we are aiming higher.
Feel free to follow for more.
I will continue to detail Bitcoin on all the timeframes as well as many of the top, mid- and small altcoins.
Thank you for your support.
It is appreciated.
Namaste.

Bitcoin in expected price zone, may go lower then UP ?
This is the old fractal chart and I have faded out the Fractal from 2013 to 2017,
Everything ese remains unchanged since Feb this year.
We hit the expected price range indicated by the circle and we are still in that area but I expect, once the month closes and we have a small red month candle, then we can start printing Green again.
The daily version of this chart shows us more local detail
We have left the area of resistance and so now, we have a free move BUT I think we may dip down to that line of support around 100K - 98K
This would not be a bad thing to do before the end of the month as it would cool off the PA / RSI and MACD and so give confidence to the serious investor while scaring the pats off the New guys and Gals.
The Daily MACD still has a way to dip before it may find support on the neutral line
This level could see PA near that line of support but it is possible for MACD to drop while PA ranges.
So we could see that Dip to line of support and it may offer the last 100K buying zone for a very long time ..
But we do have Stupid people trying to start WW3 with Lies and Greed - this could possibly destabilise things.
Be Cautious

Dogecoin - Don't forget the dog now!Dogecoin - CRYPTO:DOGEUSD - still remains quite bullish:
(click chart above to see the in depth analysis👆🏻)
Basically during every major bullrun on Dogecoin, we always saw a correction of at least -60%. Therefore the recent drop of -70% was not a surprise at all but rather a natural all time high rejection. If Dogecoin manages to now create bullish confirmation, the bullrun will continue.
Levels to watch: $0.2. $0.5
Keep your long term vision!
Philip (BasicTrading)

$BTC 4hr - The Calm Before Bitcoin’s Next Move💡 In bull markets, triangles break UP more often than down.
But volume + macro + ETF flows > patterns.
Set alerts, manage risk, stay nimble.
#BTC #CryptoAlpha #RiskManagement
🎯 Key Levels Analysis:
✅ Resistance: 106.3K
→ This level matches the upper bound of the symmetrical triangle and is reinforced by multiple recent rejections. Also aligns with previous highs.
✅ Support: 103.7K
→ Mid-range horizontal support. Price reacted here multiple times. It's also near the triangle base.
✅ Support: 99.6K
→ Clean psychological + technical level. A previous consolidation zone. Would likely trigger a strong reaction.
✅ Last Line of Bull Defense: 95.2K
→ Major horizontal support from the April/May breakout structure. Losing this would likely invalidate the bullish structure.

Safello Group AB - Bullish Outlook - Small Cap Crypto Firm Safello is starting to show signs of a breakout from its weekly triangle. If Bitcoin or altcoins start to show life, I believe this stock could outperform most crypto stocks. The company is constantly innovating its offerings and is regulated under Swedish law.
I have been DCA’ing into this stock for quite a while now and will continue to do so until the consolidation is over.
Current market cap is about 10 Million USD.
Nothing here should be considered financial advice. Always do your own research and make your own decisions.
OMXSTO:SFL
CRYPTOCAP:OTHERS
CRYPTOCAP:TOTAL
COINBASE:BTCUSD
NASDAQ:COIN
COINBASE:ETHUSD

The market recently managed to close above the Breaker Block!Bitcoin Market Update (Extended & Insightful):
The current update for Bitcoin remains largely the same as the previous one. However, there have been some slight yet significant shifts in the market behavior.
The market recently managed to close above the Breaker Block (BPR), which initially seemed like a bullish signal. But as it approached the overhead supply zone, it faced strong rejection and started to decline again. This shows that sellers are still active at higher levels.
Right now, the market is treating the BPR as an inversion level, meaning it’s testing it as potential support. This level is crucial for determining Bitcoin's next move.
🔍 So, what’s the best approach now?
Patience is key at this point. The ideal strategy is to wait and watch. Let the market clearly break either the upper supply zone (which would confirm bullish momentum) or the lower BPR zone (indicating a bearish trend). Only then can we expect a strong directional move.
Until one of these key levels is decisively broken, Bitcoin is likely to continue consolidating within this range — moving sideways without a clear trend.
🧠 DYOR — Do Your Own Research!
Always analyze before making any trading decisions.

Avalanche, The Money Tree; Great Entry Price & TimingWhat's the first thing you consider when looking at a chart? What is the first thing that catches your attention?
When you take the leap, how confident do you feel that your conclusions are correction? Do you doubt yourself? I don't.
The first I look at are the candles and the chart structure. Later comes the volume and price patterns. Finally, if somehow the direction is not yet clear, I add some indicators for additional support. What about you, what is the first thing you consider when looking at a chart?
I think Avalanche is ready to grow based on a rising channel, a structure of a higher lows. This small and young structure is a period of consolidation before maximum growth. Timing is running out. The market is about to go bullish and it will grow with full force.
It doesn't matter what is happening "out there," Crypto is going up.
Looks like a great entry timing is possible on this chart. The price is awesome. It is the same chart setup we've been looking at for months and months. The current price range has been active since early March.
The rise from March, April and May all include the 3-February low. It is certain and highly obvious, this consolidation has been going for too long. The bearish bias is missing. Bullish consolidation means that a bullish breakout will follow when this phase ends. The start of a new uptrend. All those altcoins that moved first revealed what will happen to this pair.
Did you miss those? I showed you some pairs that grew more than 100% in a single day. You know something interesting? The chart on those pairs is exactly the same as this one. The drop, the recovery and the higher low.
Soon, very soon, Avalanche will follow and the rise will be very strong.
Namaste.

W pattern off the handle. #Bitcoin to 168K.From my most recent post of the Cup & Handle I see a W pattern. Price broke out of the handle to retest to confirm support creating a double bottom.
This is a very good sign to confirm the C&H for this bullish near future.
If we continue upwards and break the psychological resistance zone at 111K, I expect 168K within 3-6 months.
I attached the Cup and Handle analysis to the current.

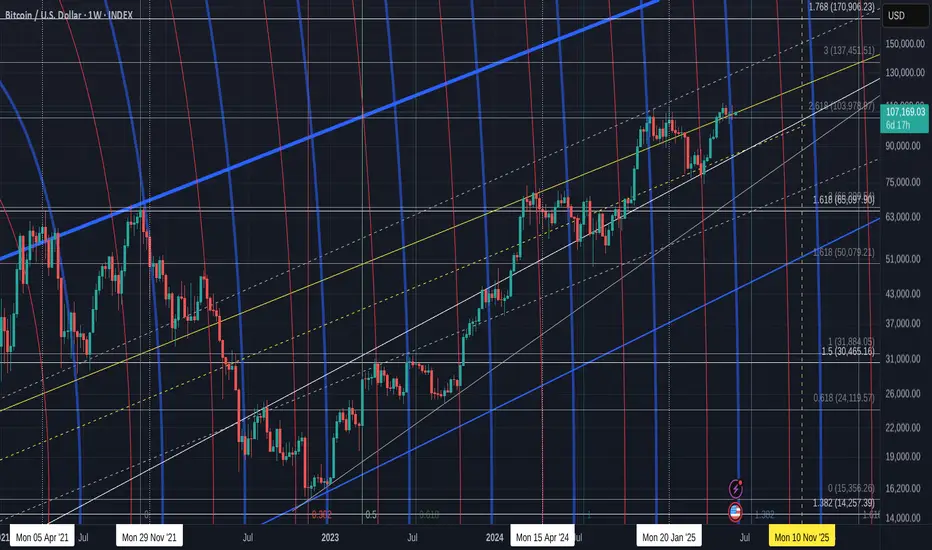
Bitcoin Will Continue Rising —Long-Term Chart —$200,000+ New ATHIn November 2021, the week after the all-time high was a crash. The weeks that followed were a continuation and the market went full red and didn't stop dropping until November 2022, a year later.
In May 2025, the week after the all-time high is neutral, sideways. Four weeks later and Bitcoin continues sideways consolidating near resistance, ready to break to new highs and continue rising.
Market conditions now are very, very different compared to 2021. Right now, we are only halfway through the current bull market, for Bitcoin, and we have room left available for plenty of growth.
In a matter of days, maybe 5-6 days, we get a new all-time high and this means not the end of the bull market but the start of the next and final bullish wave.
These targets on the chart are the most accurate of all numbers because they are based on almost 5 years of data.
Next target and minimum price for Bitcoin in the coming months is $155,601 but we know there is likely to be more, much more. With the institutional wave now in full force, banks opening to crypto because they have no other choice and the world evolving faster than anything we thought possible, we are aiming for $200,000 or more.
The next relevant level after $155,600 is $209,125. Which one is your target for this new 2025 all-time high?
Do you think Bitcoin will peak in late 2025 or early 2026?
Do you think you will manage to be successful in this round or are you bound to make the same mistakes? Over-trading, over-leverage, no being patient enough; not waiting for the right time to enter and not selling when the market is trading very high, greed; What will it be?
Do you think you have what it takes to succeed? You do!
Even if you made mistakes in the past or even if you are already doing good, you have what it takes.
If you are doing bad, this experience can be used to improve your game. If you are doing great, great, let's do better. There is never enough growth; we are happy, we are grateful but we accept abundance because we receive abundance thanks to hard work.
It is still very early but the market is starting to heat up. Once the bullish action starts, there is nothing that can stop us. The world will change for us. We will adapt to all market and geopolitical conditions, we will continue to improve and evolve.
The best one is not the one that makes no mistakes but the one that can extract learning from all experiences. Success is not being right all the time, success is never giving up.
Will you give up? Or, will you continue to trade long-term?
» Bitcoin is going up!
Namaste.

Nillion To Meet Final Resistance To Reach 273% —Trading BasicsNillion hit bottom 13-June but the bottom is only confirmed today with the current bullish breakout.
As the action turns bullish Nillion will grow to face its "final resistance" around $0.55. The good news is that this resistance level will break followed by additional growth.
Within the next 2 months, we have an easy target of 195% profits potential, followed by 273%. These are easy, and this means that NILUSDT will produce even more growth in the ensuing months. We will see an uptrend develop leading to a price discovery phase.
How far up this pair goes is a question mark because it is new, but total growth potential for this bullish cycle is huge. The fact that it is moving early is also good news.
Trading cryptocurrencies can be complex or it can be simplified, I like the simplified version; turn it into a waiting game, truly.
With a chart setup like this one, buy and hold, the market takes care of the rest. That's the waiting game but that's not all... You are waiting but once prices start to grow, you can enjoy the profits as they come. The next step will be to sell to secure a win. You only sell when prices are high, big green. Never sell when prices are low/red. Sell high. Buy low, sell high. Prices are low now.
Thank you for reading.
Namaste.

Macromics Group: Market Trends Overview (June 2025)Global Economic Landscape: What Has Changed?
June 2025 marks significant shifts in the global economy. After several years of instability caused by the pandemic, inflation, and geopolitical tensions, markets are gradually stabilizing. However, new challenges are emerging: rising risks in Asia, digital transformation in Europe, and strategy shifts in the U.S.
China and India continue to show strong growth rates—5.8% and 6.5% respectively. Europe, by contrast, is lagging behind due to slow recovery and persistent inflation. The U.S. maintains a steady course driven by consumer spending and innovation, reporting 2.1% GDP growth.
Macromics Group continues to deliver in-depth analytics and strategies for clients seeking to understand and capitalize on these changes. We analyze trends across more than 120 industries, helping companies adapt and thrive.
Macroeconomics and Monetary Policy: A Shift Toward Stabilization
Financial regulators have begun cautiously lowering interest rates after the peaks of 2024. The U.S. Federal Reserve has dropped its rate to 4.5%, while the ECB has reduced its rate to 3.75%. This is made possible by a decline in inflation: 2.7% in the U.S. and 3.1% in the EU.
Meanwhile, developing nations like Turkey and Argentina are still grappling with high inflation. These countries risk falling behind the global recovery unless decisive steps are taken.
Overall, the global course is toward soft stabilization: interest rates remain high but steady. This creates favorable conditions for investment and long-term planning.
Financial Markets: From Caution to Moderate Optimism
Stock markets in June 2025 show mixed performance. U.S. indexes such as the S&P 500 and Nasdaq hit new highs, thanks to the booming tech sector. Stocks of companies involved in AI, quantum computing, and cybersecurity are particularly strong.
European markets are less active but relatively stable. Growth is limited by high costs, demographic issues, and the transition to ESG standards. In Russia and CIS countries, markets are under pressure due to sanctions, currency restrictions, and reduced investment.
On the currency front, the U.S. dollar and Chinese yuan dominate. The ruble is volatile, the euro is stable, and the yen is strengthening as a safe haven asset.
Technology: The Engine of New Markets
The main trend in 2025 is AI and automation. Companies are deploying neural networks in logistics, marketing, finance, and HR to cut costs and boost efficiency. Demand for AI professionals and developers is surging.
5G infrastructure has matured in most developed countries, unlocking new potential in IoT, telemedicine, and remote work. At the same time, quantum computing is advancing rapidly, with commercial solutions expected by 2026.
Macromics Group invests in next-generation analytical platforms, enabling clients to access real-time insights and forecast trends before they go mainstream.
Energy and Sustainability: ESG and the “Green” Shift
Energy markets have stabilized after the turbulence of 2024. Oil prices remain between $70–$85 per barrel—comfortable for both producers and consumers. Meanwhile, renewable energy—solar, wind, and hydrogen—is seeing record investment.
Corporations are increasingly reporting according to ESG standards. It’s not just a trend, but a new business reality. Investors demand transparency, consumers prefer socially responsible brands, and regulators impose mandatory reporting.
Macromics Group supports clients in transitioning to sustainable models by developing ESG strategies, assessing risks, and offering financial solutions.
Conclusion: Outlook for the Second Half of 2025
The first half of 2025 showed that markets are learning to operate in a new reality. The global economy is no longer chasing rapid growth, but adapting to volatility. Key focus areas are technology, sustainability, and smart resource management.
For businesses, this means quick adaptation, innovative thinking, and reliance on data-driven decisions. In this context, Macromics Group serves not just as an analyst but as a strategic partner.
Our recommendation: act proactively. In times of uncertainty, those who plan years ahead and use quality data will win.

Bitcoin Consolidates Near Highs — Bullish Wedge Signals StrengthHolding Strong Amid Uncertainty:
Despite rising geopolitical tensions, Bitcoin remains resilient, trading near recent highs. This stability reflects strong institutional confidence and sustained accumulation by long-term holders.
Bullish Technical Setup:
The ongoing consolidation between $100,000 and $110,000 is forming a wedge pattern—a classic bullish continuation structure. This suggests the market is coiling for its next major move.
Key Levels to Watch:
Immediate Resistance: $112,500
Support Zone: Holding above $100,000 keeps the bullish case intact
Measured Move Target: $130,000–$135,000
Outlook:
This tight consolidation signals a healthy pause in a strong uptrend, positioning Bitcoin for a potential breakout and continuation higher. All signs point to the bulls remaining firmly in control.
#Bitcoin #BTC #TechnicalAnalysis #BullishWedge #CryptoMarket #InstitutionalBuying #PriceAction #Geopolitics #SupportAndResistance #BullRun

Magic: Higher Low, Falling Wedge & Bullish Continuation (1,046%)It seems like forever, but it is worth it because of the huge potential for growth.
The falling wedge pattern is a classic, we haven't been seeing that many recently and here we have one.
The initial breakout in April only lasted two weeks. MAGICUSDT peaked 21-April and started a long retrace, this retrace as always happens ends in a higher low. The candles formed a falling wedge pattern which can be used as a bullish reversal signal.
As the breakout from the pattern happens today, we can see trading volume going up. The highest volume since April. This high volume confirms this move being real and we can expect additional growth.
The following targets can be hit within 1-3 months. So these are huge numbers watch:
» $1.14 Gives 626%.
» $1.80 Gives 1,046%.
» $0.4759 Gives 203%.
These are great numbers, nice potential for growth. The last target can be hit short-term, within thirty days. It can be less.
Thank you for reading.
Your support is truly appreciated.
I hope we can continue to exchange for the long-term.
You give me attention, and I give you knowledge and great trading opportunities.
Namaste.

SOL/USDT at Key Inflection Point – Breakout or Rejection? Part 2Solana (SOL) is trading at a pivotal zone where price structure, harmonic patterns, and key technical indicators converge. This setup outlines three potential scenarios, guided by Fibonacci levels, auto trendlines, and momentum indicators.
Green Scenario (Confirmed Bullish Continuation)
A sustained hold above $155, especially if followed by a breakout through $156.50 with rising volume, would confirm the green path. This scenario reflects short-term bullish momentum strengthening, as RSI remains near 60 and PVT continues to climb. If confirmed, price may extend toward $160, with secondary targets in the $165–$172 range, aligning with the upper ascending trendline and harmonic extension.
Orange Scenario (Sideways-to-Bullish Consolidation)
This scenario becomes increasingly likely if SOL remains range-bound between $153.50 and $157.80. This consolidation zone overlays the 50–61.8% Fibonacci levels, Bollinger Band basis, and several key trendline intersections. With RSI holding in the 55–65 range and PVT stable, this setup would favor re-accumulation before another breakout attempt. Price action above $155 continues to support this scenario as the base case.
Red Scenario (Bearish Breakdown)
A breakdown below $153.50, especially if followed by a breach of $150 on high sell volume, would invalidate the bullish thesis. This scenario opens downside risk toward $147.35 and potentially $144.00–$140.00. RSI would likely drop below 50, and a flattening or declining PVT would confirm distribution. This path aligns with the broader red trendline and would indicate a rejection of the recent bullish breakout.
Indicators Used:
Bollinger Bands (BB 20, 2)
Relative Strength Index (RSI 14) with moving average overlay
Price Volume Trend (PVT)
Auto-generated trendlines
Harmonic Patterns (ABCD and XABCD)
Fibonacci Retracement and extension levels
Bias:
Short-term bullish if price holds above $155. Market structure, RSI, and PVT favor upward continuation or consolidation. A break below $153.50 would shift the bias toward neutral or bearish.
Strategy Outline:
Bullish if price breaks and holds above $156.50
Targets: $160 / $165 / $172
Bearish if price breaks below $150.00
Targets: $147.35 / $144.00 / $140.00
Scalping opportunity in the $153.50–$157.80 zone while awaiting directional confirmation
**This analysis is for informational and educational purposes only and does not constitute financial or investment advice. Trading cryptocurrencies involves significant risk and may not be suitable for all investors. Always conduct your own research and consult with a licensed financial advisor before making trading decisions. The author is not responsible for any losses incurred from reliance on this analysis.**

Bitcoin, Good News & Good News —Bullish Confirmed (Retrace Over)First, the good news is that we have a higher low and a strong recovery in place. The current candle has a long lower wick and is already trading green, at the top of the session.
The second good news is how far down the retrace went. Last time Bitcoin bottomed around $100,300, this time the bottom happened at $102,660. This is an early signal of course because the week is not yet over. It can happen that prices move higher today and tomorrow they move back down, crash on Sunday and we get a bearish close. But, looking at short-term price action and other altcoins, also the volume—notice the volume—we can say that the retrace is over and we are set to experience immediately additional growth.
The volume is the most revealing signal right now.
The drop had no volume compared to today. Today's session has more volume than the last three red-days combined.
Another signal to consider is the amount of over-leveraged gamblers that were liquidated, a total of 1 billion dollars. When this much greed is removed from the market, there is no need for lower prices.
I will call it early, the retrace is over. Time to go bullish again.
Thanks a lot for your continued support.
I will show you several more altcoins that are also looking ready to grow.
Namaste.
Market Overview
WHAT HAPPENED?
Strong sales resumed last week after a short period of growth. This was provoked by the escalation of the conflict in the Middle East.
After testing and fixing the $105,800-$104,500 zone (accumulated volumes), strong volume deviations appeared, which should be perceived as protection on the part of the buyer.
WHAT WILL HAPPEN: OR NOT?
At the moment, an attempt is being made to position the volumes accumulated in the range of $105,600-$104,700 in the direction of growth. Strong support has already been formed in the area of $104,000-$102,900 (abnormal volumes).
When the four-hour candle closes above the $106,400 mark, it’ll be possible to additionally consider the zone of accumulated volumes for buys (if there is a reaction from it).
The main scenario is a long position with targets up to the nearest resistance. In case of easing of geopolitical tensions, there remains the possibility of updating the ATH.
Alternative scenario: correction to the support zone of $101,600-$100,000 (volume anomalies). With this development, a prolonged rebound is possible.
Sell Zones:
$109,000–$110,000 (accumulated volume)
Buy Zones:
$105,600–$104,700 (accumulated volume)
$104,000–$102,900 (volume anomalies)
$101,600–$100,000 (significant volume anomalies)
$98,000–$97,200 (local support)
Level at $93,000
$91,500–$90,000 (strong buying imbalance)
IMPORTANT DATES
Macroeconomic developments this week:
• Tuesday, June 17, 03:00 (UTC) — publication of the Japanese interest rate decision;
• Tuesday, June 17, 12:30 (UTC) — publication of the core retail sales index for May in the United States, the volume of retail sales for May in the United States;
• Wednesday, June 18, 06:00 (UTC) — publication of the UK consumer price index compared to May last year;
• Wednesday, June 18, 9:00 (UTC) — publication of the consumer price index in the Eurozone compared to May last year;
• Wednesday, June 18, 12:30 (UTC) — publication of the number of initial applications for US unemployment benefits;
• Wednesday, June 18, 18:00 (UTC) — publication of FOMC economic forecasts, FOMC statement, US Federal Reserve interest rate decision;
• Wednesday, June 18, 18:30 (UTC) — US FOMC Press Conference;
• Thursday, June 19, 7:30 (UTC) — publication of the Q2 interest rate decision in Switzerland;
• Thursday, June 19, 8:00 (UTC) — press conference of the National Bank of Switzerland;
• Thursday, June 19, 11:00 (UTC) — publication of the June interest rate decision in the UK;
• Thursday, June 19, 12:30 (UTC) — publication of the number of initial applications for unemployment benefits in the United States;
• Friday, June 20, 12:30 (UTC) — publication of the Philadelphia Federal Reserve's index of manufacturing activity for June in the United States.
*This post is not a financial recommendation. Make decisions based on your own experience.
#analytics

Bitcoin - Inverse Head & Shoulders on 4h (Neckline broken)Looking forward to a new ATH shortly IF the neckline holds.
BITSTAMP:BTCUSD
BINANCE:BTCUSD
COINBASE:BTCUSD
CRYPTOCAP:TOTAL
CRYPTOCAP:OTHERS
BINANCE:ETHUSD
COINBASE:ETHUSD
BINANCE:SOLUSD
OANDA:XAUUSD
FX_IDC:XAUUSD

ETH/USDTEthereum (ETH/USDT) is currently maintaining its bullish momentum above a well-respected ascending trendline that has been active since early April. After a strong breakout above the 2347 level, the price entered a consolidation phase between 2600 and 2800, suggesting that the market is preparing for its next significant move. As of now, ETH is trading near 2627 and forming higher lows, which is a positive sign of buyer strength.
The key support zones are located at 2347 and 2266, while resistance levels to watch are 2768 and 2834. As long as the price holds above the ascending trendline, the bullish structure remains intact. A bounce from the current region, especially near the trendline, may present a favorable long opportunity. In such a scenario, a breakout above 2768 could open the path toward 2834 and potentially higher levels in the medium term.
A suitable long setup would involve entering around the 2620–2640 zone with a stop loss below 2347 to protect against trend invalidation. The first profit target can be set at 2768, and the second at 2834. However, traders should remain cautious: if ETH breaks below the trendline with strong bearish volume, the bullish outlook would weaken, and the price may revisit lower supports. Until then, the market structure favors buying the dips in alignment with the prevailing uptrend.

Bitcoin Bounce & Breakout PlayChart Analysis:
🔹 Support Holding Strong:
BTC is respecting a key support area (~$105,600), which previously acted as resistance (marked by recent ATH).
🔹 EMA 70 (Blue Line):
Price is hovering above the EMA, adding bullish confirmation.
🔹 Bullish Projection Path:
The chart shows a projected bullish move toward the sell zone near $113,200 – $113,300, representing a potential 4.4% gain from the breakout.
🔹 Key Zones:
Support Zone: $105,600
Supply Zone: $100,500
Sell Zone (TP Zone): $113,200+
📌 Outlook:
If BTC breaks and holds above the resistance (~$107,000), a strong upward rally could follow. Entry near support or on breakout, with tight risk management, offers a favorable risk/reward.
✅ Entry Options:
Breakout Entry:
Trigger: Break and close above $107,200
Confirmation: Retest and hold above the breakout zone
Entry: $107,300 – $107,500
Support Bounce Entry:
Trigger: Pullback to support zone (~$105,600) with bullish reversal candle
Entry: $105,600 – $105,800
🎯 Target Zones (TP):
TP1: $110,400 (minor resistance)
TP2: $113,200 – $113,300 (major sell zone)
TP3 (aggressive): $114,000+
🔻 Stop Loss (SL):
For breakout entry: SL below $106,200
For bounce entry: SL below $105,200 or $104,800 (structure break)
📈 Risk–Reward Ratio:
Approx. 1:2.5 to 1:3+ depending on entry and target
🧠 Trade Management:
Move SL to breakeven after hitting TP1
Partial profit booking at TP1
Trail remaining with manual or dynamic SL (e.g., below EMA or recent low)
⚠️ Risk Notes:
Avoid chasing price without breakout confirmation
Watch for fakeouts and heavy selling near TP zones
Adjust position size based on your risk tolerance

Bitcoin closed week RED but that is OK, it was closeFor the last 3 weeks, Bitcoin has been in a tight range and each candle has been small body and long wicks, showing indecision and uncertainty
This close up chart shows how these 3 weekly candles have occurred at the intersection of a Fib circle (blue) and This alone could explain these "wicky" candles... The Bulls have been fighting hard to keep PA up and to not let it slide down that fib circle, as is normal the majority of the time.
.
We shall find out this week because, now, there is not a lot to stop the Bulls trying harder.
The FED will let us know the decision on interest rates on 18th.
This will likely cause a reaction in markets and I think we are most likely to see Rates remain static.
PA is currently on Support and remains above the 2.618 Fib extension.
All is Good
The MVRV (Green) and Z Score (yellow) can be complicated to fully understand but what is important to understand here is how the Yellow Z Score is still above the Green MVRV. this remains Bullish. We should notice how Both are falling and we wait for them to cross back over that falling line of resistance.
Currently, This chart shows us that Bitcoin has a slightly undervalued price. The higher we go, the more Oversold, Undervalued/ the top is the opposite, overbought / over valued.
The MACD is showing us a s;light levelling off
For me, I think this is similar to what we saw in the end of 2024. The MACD may go back down to the Red signal line and bounce....Again, we have to wait and see. Remember, that just because MACD drops, BTC PA does not always follow. We can range across instead
Over all, I am still Bullish long term but we may see some continued uncertainty in this market. The FED decision later this week will have an impact for sure
Bitcoin remains strong though but should circumstances allow, we could revisit 90K on that trend line below current position. I am not to sure this will happen but a good idea t be ready if it does.
What is certain is how PA has never really been in such a "soft" controlled action.
The nearest we have is way back in 2016 to 2016.
At this time period, we also saw BTC PA rise in a slow steady rise, no sharp pushes higher till the final push to ATH.
Currently, we seem to have repeated a similar Acton though. now, for longer
So, we wait and we will find out..
Bullish bounce off pullback support?The Ethereum (ETH/USD) is falling towards the pivot and could bounce to the 1st resistance.
Pivot: 2,407.74
1st Support: 2,092.59
1st Resistance: 2,816.29
Risk Warning:
Trading Forex and CFDs carries a high level of risk to your capital and you should only trade with money you can afford to lose. Trading Forex and CFDs may not be suitable for all investors, so please ensure that you fully understand the risks involved and seek independent advice if necessary.
Disclaimer:
The above opinions given constitute general market commentary, and do not constitute the opinion or advice of IC Markets or any form of personal or investment advice.
Any opinions, news, research, analyses, prices, other information, or links to third-party sites contained on this website are provided on an "as-is" basis, are intended only to be informative, is not an advice nor a recommendation, nor research, or a record of our trading prices, or an offer of, or solicitation for a transaction in any financial instrument and thus should not be treated as such. The information provided does not involve any specific investment objectives, financial situation and needs of any specific person who may receive it. Please be aware, that past performance is not a reliable indicator of future performance and/or results. Past Performance or Forward-looking scenarios based upon the reasonable beliefs of the third-party provider are not a guarantee of future performance. Actual results may differ materially from those anticipated in forward-looking or past performance statements. IC Markets makes no representation or warranty and assumes no liability as to the accuracy or completeness of the information provided, nor any loss arising from any investment based on a recommendation, forecast or any information supplied by any third-party.
