Cosmos (Atom) 11 Months Within Accumulation ZoneThis is a repeating theme and pattern; this is a classic. Cosmos is now sideways after a correction. The correction is preceded by a bullish wave.
The bullish wave in late 2024 was a short-term, it lasted only one month. But what is interesting is the fact that the bottom range is the same now as it was before the last bullish wave.
If you count the period from the September 2024 low until present day, we have more than 280 days. A very long time. If we start counting from August 2024, when the current accumulation zone was activated, this gives us a total of 314 days, more than 10 months. This is truly all that we need to know. The same low holds for almost a year, getting very close.
If ATOMUSDT does not rise within 2 weeks, this would give us a total of 11 months within the same zone. But it doesn't break, each time a low point is activated there is strong buying and this has been happening long-term.
August 2024, September 2024, November 2024. Then again February 2025, March 2025, April, May and the same accumulation zone is still active today.
The whales are accumulating now, this is their buy-range. Once the accumulation phase is over, we will experience a strong bullish phase. Not a small jump as back in late 2024, but an uptrend, higher highs and higher lows.
Ravencoin weekly is a great example. See the 'related publications.'
Thanks a lot for your continued support.
Namaste.
Cryptomarket

SPX6900: From base building to history making.Price is fractal, right? RIGHT?!
Before the recent run, SPX6900 printed almost the same setup.
See it yourself....
Now it’s playing that over-under dance near ATH (#2). Classic. Build the base, shake the tourists.
Then comes the move... THE move.
First stop: $10.
After that, a quick push into the $50-70 zone.
Once the weak hands get flushed, $100 becomes the next base.
Long term? Way higher.
If the community keeps growing.
If people stay tired of the same rigged game.
This could and probably will make history....
Like Murad says: stop trading. Believe in something.
We’re still SO early.
This is just a "Classical charting style fractal analysis..." but the reality is that... there is no Chart. ...

Bitcoin Short-Term, 1H Timeframe, Bullish ($115,482 Next Target)Bitcoin completed its retrace 13-June 01:00 AM with a higher low at $102,663. Price action and trading volume indicates that the bearish move is over. Bitcoin is trading above support in the form of 0.618 Fib. retracement.
Bitcoin is turning bullish moving above EMA34, EMA21, EMA13 and EMA8 all in this current active session.
Immediate support stands between $105,293 and $105,314.
Next support is $104,533 and main support $104,282 matching the 0.618 Fib. retracement level.
Next target easy hit is $106,625, followed by $107,559. The second being a mild resistance.
Bitcoin can easily continue higher short-term aiming next at $108,989 followed by the last high at $110,586. Depending on how this level is handle we can update the short-term view.
The 1H timeframe is bullish now based on price action, candlestick patterns, higher lows, moving averages and the oscillators.
Namaste.

Daily vs 4H: Mixed Signals, Clear BounceOn both the 1D and 4H timeframes, price is still below the 200MA.
On the daily chart, it's also trading under the BB center line, the SMA, and the MLR.
However, on the 4H chart, price is now above the BB center line, SMA, and MLR — and it’s not far from triggering a long entry signal.
On the daily, we’ve seen a bounce from strong support: the 0.5 Fib level and the 200-week MA.
On the 4H, price looks ready to close above the last daily close — a promising sign.
Always take profits and manage risk.
Interaction is welcome.

USDT.D Consolidation Near Breakout Zone – Eyes on the Next MoveHello traders, here is the USDT.D update:
The chart is currently hovering near a major resistance zone, one that historically plays a key role in triggering altseason.
After a period of consolidation inside the mid-range S/R zone, price is now testing the downtrend line from above. A clear rejection here could spark renewed confidence in altcoins, giving them space to rally.
On the flip side, a breakout above this level may delay altseason momentum, as capital remains parked in stablecoins.
For now, this zone is the make-or-break area for altcoin sentiment. Keep it on your radar, the next move could set the tone for the coming weeks.

Ethereum Weekly Chart Shows Strength Above Key SupportEthereum is showing strong structure on the higher time frame. After rejecting lower levels, price has reclaimed the mid support/resistance zone, and is now consolidating just above it.
What’s key here is the long-term rising trendline, which has held beautifully since 2020 and once again acted as a springboard for the recent bounce. This kind of confluence — trendline + zone flip — adds weight to the current price structure.
If ETH maintains this zone, we could see accumulation continue, followed by a breakout toward the upper resistance line. For now, the chart leans bullish, but patience is key as consolidation plays out.
DYOR, NFA

Ethereum LP Range TighterVolatility has continued to decline, enabling us to tighten the liquidity provision range on Ethereum within the Base network, as indicated by the horizontal red lines. However, trading volume in ETH remains relatively low, which is resulting in minimal fee generation from the pool, we expect that to change: app.uniswap.org
BTC/USDT Bullish Reversal Zone AnalysisSupport Zone:
The horizontal purple box (~104,000 USDT area) has acted as a strong support/resistance flip zone multiple times.
Falling Wedge Breakout:
The price action broke out of a falling wedge pattern earlier, confirming bullish momentum.
Flag Formation (Current):
A smaller bullish flag/pennant appears to be forming, and a breakout above could trigger a strong upward move.
Projected Move:
The black arrow indicates a potential bounce from this support zone, with the price targeting the 111,000–112,000 USDT zone (highlighted in the top purple box).
Volume Spike:
Notable volume spike near the bottom supports the idea of accumulation and possible reversal.
📈 Conclusion:
If the support zone holds and price breaks above the minor flag, a bullish continuation is likely toward the 111,000–112,000 resistance area. Traders should watch for confirmation of a breakout and volume increase for validation.

$TOTAL2 and $USM2: Correlation never broken. What now? Today we dive into the world of crypto. We are looking into the recent rally in the Altcoins including CRYPTOCAP:ETH and §Sol and try to understand the reasons behind it and what is means for the future. CRYPTOCAP:TOTAL2 depicts the total market capitalization of all the Altcoins except CRYPTOCAP:BTC but including stable coins. When in doubt, zoom out. Today we are looking at the monthly candle stick charts for the CRYPTOCAP:TOTAL2 vs the $USM2. ECONOMICS:USM2 is the total M2 money supply from all the sources not only the banks but also other forms of cash within the economy. M2 money supply generally goes up and the economy grows and the Govt and Fed Balance sheets grow.
ECONOMICS:USM2 is primarily responsible for the increase in stock and asset prices. Crypto is no exception to it. Whenever the M2 Money supply goes up the Altcoins usually goes up. During the last Crypto cycle, the Altcoins peaked @ 1.7T $ in Nov 2021 and the ECONOMICS:USM2 peaked a few months after that in March 2022 @ 21.71T $. When the ECONOMICS:USM2 fell to 20.66T $ the Altcoins market suffered a bear market and lost 75% of the value. So, the question comes what happens to the CRYPTOCAP:TOTAL2 chart when the M2 money supply is expanding. We have clearly saw a recent surge in the Altcoin market but still below the ATH. Currently CRYPTOCAP:TOTAL2 at 1.16T $ is still below the 0.618 Fib retracement level plotted on the last cycle from top to bottom. Still CRYPTOCAP:TOTAL2 must cover a lot of ground and grow by 50% to reach its previous cycle top. In those cases, the ECONOMICS:USM2 must go up also by 1-2T $ to support such a jump in the $TOTAL2. But what will CRYPTOCAP:BTC do in that case?
Verdict : CRYPTOCAP:TOTAL2 can only go above $1.7T $ if ECONOMICS:USM2 expands by 1-2T $. Watch out for CRYPTOCAP:BTC in that case.

Thena Ready To Move Now! Strong Short- & Long-Term (1,155% PP)I don't like to post the same charts because there are just too many options and we cannot even get close to looking at all those, specially with a limit of only ten post per day. But, with that said, here we have Thena again, THEUSDT, why? Because it is ready to move and a great time-based opportunity only comes around so often.
When it comes to Cryptocurrencies opportunities are endless is true, but some tend to move faster than others and this one looks good. It looks good short-term and has huge potential also long-term. So good on all sides. Risk is very low. We have a classic local higher low and the stage is set, the world is ready; watch it grow.
Nothing is pointing down. Everything is pointing up.
No plan, no strategy, no complexities... Just buy and hold.
Namaste.

Ethereum vs Bitcoin 450% Growth Potential, Already ConfirmedEthereum is preparing a 155% rise vs Bitcoin, ETHBTC. The bottom is already in and this bullish wave confirmed. The 155% target is the minimum, "back to baseline," and it happens to match MA200 and the 0.618 Fib. extension level.
The main signal is a rounded bottom after a major multiple-years long downtrend. The same signal ETHBTC produced back in September 2019 but smaller in size.
The second signal is not specific to this pair only and relates to the cyclical nature of this market. Every four years, there is a bull market.
» ETHBTC produced a bull market in 2017.
» ETHBTC produced a bull market in 2021.
» ETHBTC will produce a bull market in 2025.
(Due to changing and evolving market conditions, the 2025 bull market can extend into early 2026. Just a possibility.)
This is true also for the small and medium cap. altcoins that are yet to grow. Strong projects such as Bitcoin and many big altcoins have been bullish for very long. These are on a league of their own. They cannot wait for the end of 2025 to produce a bull market because they have too much too strong demand and so they have been growing for years on end. The other part of the market, the neglected part, is about to go nuts. Extremely bullish in short.
This is a friendly reminder, load up and hold.
You will be happy with the results.
Prepare yourself to wait for months. On the safe side, 6-8 months. That would be minimum. The longer you are prepared to wait, the better it is for your mental state. There is no way to go wrong with Crypto unless you are doing leveraged trades. If you want to have certain profits, choose reputable projects through spot, and watch your money grow. Focused always on the long-term of course.
Namaste.

Orchid 290% Profits Target, MA200 & Price Action FractalThe classic signals are already present on this chart, the double-bottom, etc. But I also have a price action fractal plus an unconventional signal supporting a bullish jump.
The easy target here is 290%, it can be hit within months. Not more than two to be more exact after the bullish breakout is confirmed. Long-term there can be more growth.
The price action fractal is a 1,2,3 sequence. A correction leads to a low that leads to sideways and then a bullish breakout. (1) The correction, (2) then consolidation and finally (3) the bullish breakout.
The unconventional signal revolves around MA200. When MA200 starts to curve down prices tend to shoot up. Right now this indicator only has a tiny curve but this is the start.
If you look at the action around September 2024, MA200 started to curve down. Prices continued sideways for more then a month but eventually a bullish jump developed. It always happens when MA200 starts to curve down. As it goes down, prices go up.
This is another signal that can be used to spot a trend reversal.
Thanks a lot for your continued support.
Namaste.

Ravencoin Bullish Continuation, Altcoins Bull Market ConfirmedRavencoin produced a major bullish breakout, we've seen many of those. It happens that you get one of these breakouts but the following week bullish action is dead. That was all, end of story. This isn't the case here and this is truly great news.
First, Ravencoin produced some of the biggest volume ever, only once was there a week with higher volume and the volume in the last two weeks is higher even than in the 2021 bull market. This clearly reveals the start of the next bullish phase, at least for this pair, but never in the history of Crypto has this project or any other gone on a bull market on its own, not in 2021 and not in 2025. What one does, the rest follows.
So we have a bullish continuation. Really high volume to break above EMA34 followed by additional growth. We can expect this trend to continue. These weekly candles are the biggest since 2021.
Get ready, because the same will happen across hundreds of altcoins.
Here is the daily timeframe:
Two days red and it is clear that this project is creating a new uptrend... Thank you for reading.
Namaste.

Bitcoin Cash Weekly Update, Moving Averages & Bullish PotentialI already looked at Bitcoin Cash recently, this time I want to see how the moving averages are doing here to compare with the other Crypto-projects. Good news for one pair is good news for other projects as well specially when they are in the same category. Bitcoin Cash is one of the big projects.
Here we can see BCHUSDT trading weekly above EMA34, EMA89 and MA200, while rising.
Resistance was found at $453, a fib. extension level. Once this level is broken as resistance you can expect a swift advance toward $680. It will be nice and easy. This is the last barrier and current price action is kind of mix.
It is good because this week trades at the highest since November 2024 coming from a low. It is bad because it is lower compared to 19-May on the wick but the week is yet to close.
A weekly close above $420 is highly desirable and favors the bulls, anything lower and we continue with a mixed situation. Make no mistake, the situation is mixed only short-term. The chart shows a clear bullish bias and there will be additional growth in the coming weeks and months. Only the short-term is questionable.
Bitcoin Cash, Bitcoin and the entire Cryptocurrency market is set to grow.
Thanks a lot for your continued support.
Namaste.

Solana Weekly TF, Good NewsI've gone deeper into Solana's chart and I have good news... You are looking at the weekly timeframe.
I looked at EMA34 and MA200 for some of the major Crypto projects, Bitcoin, Dogecoin, XRP, Cardano and Ethereum. You can find these in my profile @MasterAnanda.
Some were clearly bullish as the action was happening above both moving averages, others were mixed and one was bearish.
Solana is trading below EMA34 weekly but safely above MA200.
MA200 weekly sits at $100 for SOLUSDT.
There is another level of relevance, EMA89. On this chart shown as a blue line and this is the good news. EMA89 is working as support, it worked last week and this week it still holds. This same level matches perfectly the 0.5 Fib. retracement support relative to the move from 7-April to 19-May.
This is all to say that we are looking at a strong support zone, which means that it is likely to hold. If it breaks, it should be brief followed by a recovery right away.
Namaste.

Acala Hits Bottom, Which Means Bull Market Next (2800-3500% PP)Acala is now five weeks into the fire. If you read often you will understand clearly what I mean; if you are new, this might not make much sense.
The low happened 14-April here, ACAUSDT. Some weak action and then red. Five weeks red and the action remains relatively sideways, not much change in price.
Current price trades above the 14-April low. The 14-April low was 0.02698. Current price is higher. Five weeks red, high bearish volume and yet, no new major lows.
Notice the drop from early December 2024 until April 2025. Five weeks red can cover a huge distance, there can be a strong decline. When you see five weeks red but no change in price, this is a bullish signal. It means that the bears have no strength. It means we are not seeing a bearish trend nor a bearish impulse, instead, a retrace and stop-loss hunt. Since bearish pressure is non-existent and after weeks of selling prices aren't going any lower, we can predict change soon.
This change is bullish. The bullish signal comes from the fact that the bearish action is just too weak. It is like seeing prices trading near resistance (say a new all-time high) for weeks, months with no advance. This would reveal that the top is in and a crash comes next. In this case, the bottom is in and a bull market will follow.
Thank you for reading.
Namaste.

C98 Hits Bottom, More Than 3,333% Growth PotentialHere C98 breaks the pattern, a channel breakdown after going sideways for years. This is the liquidity hunt event. Two signals reveal that this drop is the bottom and precedes a change of trend.
1) The highest volume ever and since 2021 came in March as C98USDT looked for a new low.
2) We have a double-bottom.
The bullish action will start without warning, Boom!, 100-200% up. Then it will continue with full force, month after month after month of a rising market, see the green arrow. We are now very close.
That's all there is. Once you hit bottom, there is no other place left to go but up. Nothing, nada, nichts, niente, rien. Only up is possible now and that's where we are headed next.
Buy and hold. Growth potential goes between 2,500% and 3,900%.
Namaste.

Ethereum Liquidity Pool RangeOn the ETH/USDC liquidity pool on the Base network, Ethereum’s volatility is beginning to stabilize, creating a favorable range for liquidity provision, as indicated by the horizontal red lines. There may be an opportunity to tighten this range further in the coming hours, but additional data is needed to confirm. For now, the concentrated range is being set slightly wider, given that we’re still relatively close to the significant volatility spike from earlier in the week.
Bitcoin Breaks 20-Jan 2025 Peak Price, New ATH Next (+Altcoins)Look at this, Bitcoin closed the day exactly above the 20-Jan 2025 high. This day Bitcoin peaked at $110,265, the all-time high before May; yesterday, 9-June 2025, Bitcoin peaked at $110,577.4 but closed at $110,270, five dollars higher. Is this a bearish or bullish signal? What to expect!
Good evening my fellow Cryptocurrency trader, I hope you are having a wonderful day.
This week starts with a bang, a big bang, with Bitcoin doing great. The question immediately arises and I will answer, Will Bitcoin continue growing? Or, will Bitcoin produce a retrace?
I can tell you with 100% certainty that Bitcoin will continue to grow. I can support this statement with data from the charts.
We have hundreds and hundreds of altcoins going bullish, strongly bullish, some coming out of a new all-time low. If Bitcoin was set to crash, these altcoins wouldn't be gaining in bullish momentum, they would be diving deep much lower in order to create new lows. But this isn't what is happening this week, last week and today, no! What we are seeing now is huge growth across the altcoins market and this confirms what Bitcoin will do next.
Needless to say, as Bitcoin trades near its all-time high this is extremely bullish.
If a new all-time high is hit but the action moves lower, say 10-15% lower and remains there, this is bearish and points to lower prices. If the action remains very close to resistance, as it is now, this is ultra-bullish. It is simple do you agree?
Because when there is an incoming drop many people in the know start to sell, so the action never stays at resistance there is always a strong rejection with high bearish volume.
On the other hand, when resistance is challenged and continues to be hit over and over, or the action stays very close, it simply means that people are buying, holding and ready for growth. Bitcoin will continue moving higher mark my words. It is very easy because this has been confirmed long ago.
The bottom was hit 7-April and we are now experiencing long-term growth. As Bitcoin continues to trade near its all-time high, the altcoins will blow up.
When Bitcoin grows 20-30%, some altcoins can grow 100-200%. When Bitcoin grows 50%, some altcoins can grow 300-500%. This is the 2025 bull market.
Thank you for reading.
Give me a boost if you trade and profits from the altcoins market.
Namaste.
P.S. Leave a comment with your favorite altcoins, I will consider the pair for a few full analysis.

Circle’s IPO and the Crypto Listing Wave: The Market EntersOn June 14, 2025, the U.S. stock market witnessed a pivotal moment for the crypto industry. Circle, issuer of the USDC stablecoin and a major player in the sector, successfully went public. Shares opened at $31 and soared to over $134 by the end of the first trading day—an explosive 330% gain.
This isn’t just a one-off success. It marks the beginning of a new chapter: the public crypto era, where leading crypto companies are stepping into the spotlight of traditional finance.
Why It Matters
Circle’s IPO signals the maturation of the crypto market. Just three years ago, crypto companies were seen as high-risk, unregulated tech startups. Now, they’re structured fintech firms with clear business models, institutional backing, and regulatory compliance.
Who’s Next in Line
Following Circle, a wave of major crypto firms is preparing for their own IPOs:
eToro – the social trading platform with crypto features has finalized its SPAC merger and is set to debut on NASDAQ.
Gemini – the exchange founded by the Winklevoss twins filed for an IPO in mid-May.
Galaxy Digital and Ripple – both confirmed listing plans for the second half of 2025.
Kraken is exploring a listing in Europe, where requirements are more flexible than in the U.S.
These companies are waiting for the right moment—regulatory clarity, growing interest in crypto ETFs, and progress in U.S. Congress (with the CLARITY and GENIUS bills gaining momentum).
What It Means for the Industry
Increased Investor Trust – Public companies must disclose financials, pass audits, and comply with regulations. This builds confidence in the broader crypto sector.
Institutional Capital Inflow – IPOs unlock access to capital from pension funds, hedge funds, and asset managers that cannot invest in private crypto startups.
Marketing Power – Going public draws media attention and boosts brand awareness. Every IPO is a PR win for the entire industry.
Risks and Challenges
Regulatory Uncertainty – Despite progress, the SEC could change direction, especially with potential political shifts.
Overvaluation Concerns – Circle’s stock is already raising eyebrows, with a P/E ratio over 200 and trading volume growing faster than revenue.
Crypto Market Dependency – If crypto prices crash, the valuations of these companies could quickly collapse.
What’s Next
Expect up to 10 more crypto IPOs over the next 6–12 months, including players in DeFi, blockchain infrastructure, and Web3. This is the next stage in crypto’s journey toward mainstream legitimacy.
What was once the domain of tech rebels and early adopters is now becoming a business—with a stock ticker and quarterly earnings. And that changes everything.

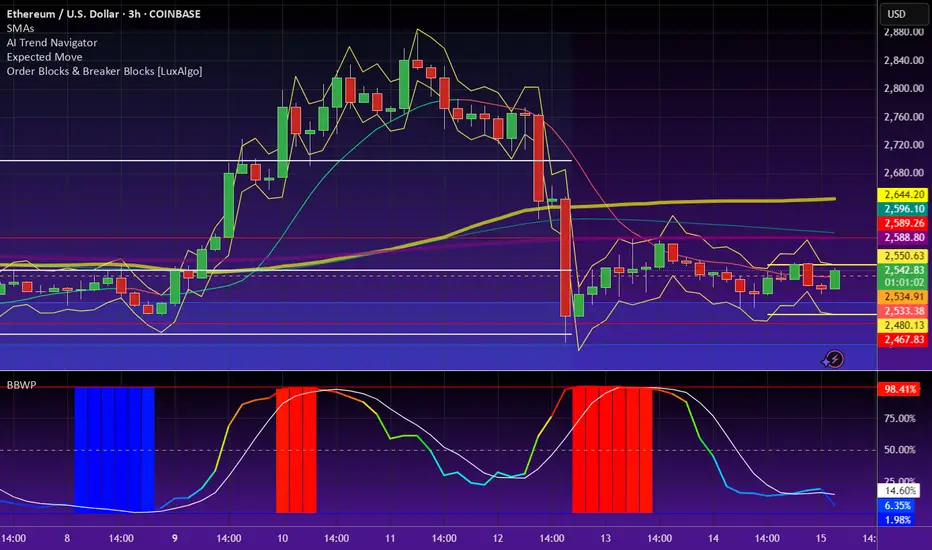
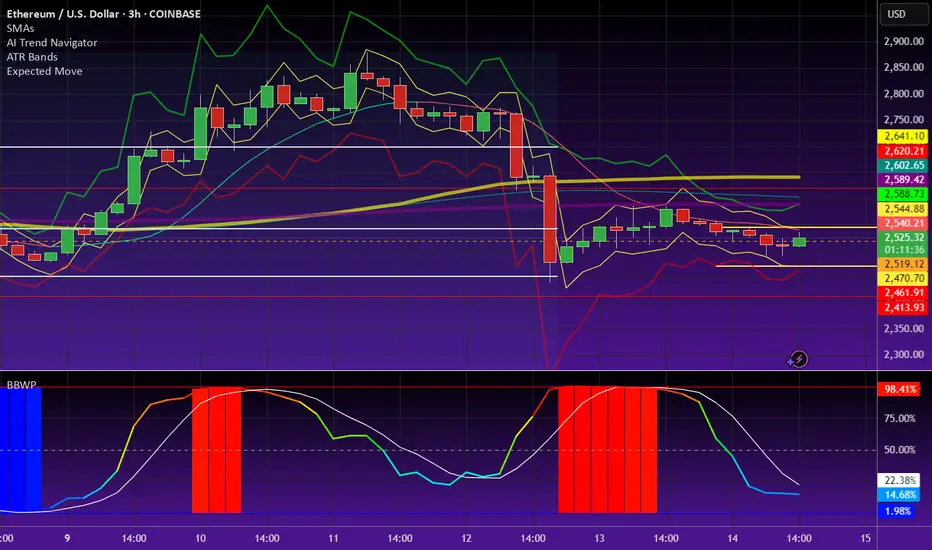
ETH UPDATE 🛡️ Ethereum Holds the Line — Critical Support Zone Tested Again
Because Ethereum has plummeted over 14% since Wednesday, traders and long-term holders are worried. Bullish investors expected ETH to break over $3,000 and confirm a wider cryptocurrency rise days earlier.
However, global turmoil has slowed markets. Israel's assaults on Iran and retaliations shook global markets on Thursday, causing crypto asset volatility and risk-off.
Historical trends between August 2021 and early 2024 suggest that keeping $2,500 has led to rallies reaching $4,000. Rekt believes Ethereum must maintain consistency around this zone to prevent a deeper retreat and maintain bullish momentum.
ETH has held $2,500 over five weeks, proving its stability despite numerous testing. In the weeks ahead, altcoins and the crypto market will depend on whether Ethereum can maintain this footing again.
Ethereum fell sharply from $2,830 this week to $2,556. On the daily chart, ETH has been rangebound between $2,500 and $2,830 for weeks. Ethereum has held above the 50-day and 100-day moving averages, which are rising, despite international threats.
The red 200-day moving average at $2,642 has provided resistance. A retracement followed ETH's short break above this level, which it failed to keep. Recent volumes have increased due to heightened attention and emotive price responses in the Israel-Iran conflict.
The $2,500–$2,520 support zone is important. This region has been a floor before and might rocket bulls if they recover control. A clear fall below $2,500 might turn sentiment negative and lead to $2,300.

Bitcoin Sentiment Slips Below Neutral As Price Hovers Near $105KBitcoin sentiment drops to 46.1% as market shows hesitation despite price rebound.
Trading volume remains flat, weakening support for BTC’s move above $105K.
Sentiment must exceed 60% with rising open interest to avoid retest of $102K support level.
According to the latest Advanced Sentiment Index data, Bitcoin sentiment has weakened despite the asset making a small recovery. As of June 13, the index recorded a reading of 46.1%, falling below the neutral 50% mark. This shift indicates a cautious market environment where investors remain hesitant to drive further gains without stronger confirmation signals. While Bitcoin has rebounded from recent lows, sentiment metrics and trading volume suggest limited conviction behind the price move.
According to the Bitcoin Advanced Sentiment Index, the current reading has fallen to approximately 46% just below the neutral 50% threshold. The chart shows that after bullish sentiment peaked above 80% in early June, the index has gradually declined; despite the recent TELEGRAM /(@TradeWithARZ) June 14, 2025
Data from the Advanced Sentiment Index shows that market optimism peaked above 80% in early June but has steadily declined since. The chart, tracking activity from May 16 to June 13, shows that sentiment dropped below 20% on multiple occasions, including June 5 and June 13, both aligning with short-term declines in Bitcoin’s price. Although the asset has since bounced back from those levels, investor confidence remains subdued.
The bell curve model used in the chart emphasizes that the majority of sentiment readings have clustered between 40% and 65%, showing a lack of extreme bullish or bearish positions. This distribution suggests uncertainty, as traders hesitate to take strong directional bets.
Recent price action within the $103,000 -$105,000 area has, however, not been accompanied by new volume inflow as net buy volume and volume delta show almost no change. The stagnation of these indicators suggests that the market participants did not support the rise to a sufficient degree.
Price Volatility Contains Within Narrow Range
According to CoinMarketCap, Bitcoin was trading at $104,950.96 at the time of writing, reflecting a 0.31% decrease over the past 24 hours. The price surged above $106,000 but faced resistance and returned to a tighter trading band. A major dip occurred around 6 PM on June 13, followed by a rebound during the early hours of June 14. Despite these fluctuations, the asset has not broken out of its recent consolidation pattern.
Source: CoinMarketCap
The volume-to-market cap ratio over the last 24 hours is 2.38%, which indicates moderate trade. The total circulating supply of bitcoin has now grown to 19.87 million BTC and is getting ever closer to the protocol-imposed limit of 21 million. Despite the stability seen in price action, analysts are monitoring bigger signs before calling a directional change.
According to analysts, the sentiment index needs to exceed 6065 percent to validate a sustainable uptrend. An increase in open interest and net taker volume is unlikely to achieve that level. In the absence of those conditions, the market is vulnerable to retesting lower support areas between $102,000 and $103,000.

Weak Pullback, Bears in Control | Will the $100K Zone Hold? BTCUSD – Weak Pullback, Bears in Control | Will the $100K Zone Hold?
🌍 Macro & Fundamental Outlook
Bitcoin continues to face downside pressure after failing to hold above the key $108K resistance. Several macro factors are influencing sentiment:
📉 US bond yields are rising again, as markets expect the Fed to delay rate cuts. This adds pressure on risk assets like BTC.
🪙 Bitcoin Spot ETF inflows remain positive, but are currently not strong enough to counter short-term selling pressure.
💵 The DXY (US Dollar Index) is recovering, as investors flee to USD amid geopolitical volatility in the Middle East.
📊 Institutional liquidity is thinning across exchanges, adding to intraday volatility.
📉 Technical Analysis – H1 Chart
🔹 Trend Structure:
BTC is now firmly in a short-term downtrend, trading below the descending trendline and all key moving averages (EMA 34, 89, 200).
Rejection from every pullback suggests that sellers are still in control.
🔹 Key Price Zones:
Bearish FVG Resistance: 106,096 – 107,004
First Support Zone: 102,821
Major Support Zone: 101,539 → 100,419
A clean break below 100K could open the door to 98,000 and below
🔹 Momentum:
RSI is neutral, hovering around the mid-40s without strong divergence signals.
Selling volume is increasing but not yet explosive — indicating the market may be awaiting a macro catalyst.
🧠 Market Sentiment
Traders are currently in “wait-and-see” mode, eyeing the next round of macroeconomic data and potential Fed commentary.
Short-term profit-taking is dominant after last week’s sharp rally.
Overall sentiment: Bearish short-term – Neutral mid-term – Bullish long-term
🎯 Trade Setup Ideas
🔻 SELL if price retests FVG and gets rejected
Entry: 106,000 – 107,000
Stop-Loss: 107,500
Targets: 102,821 → 101,539 → 100,419
🔹 BUY if price reacts strongly from 100,419 – 101,500
Entry: 100,500 – 100,800
Stop-Loss: 99,800
Targets: 102,800 → 104,400 → 106,000
Preference is given to selling the rally in the short term. Buying should only be considered on confirmed reversal signals at key support.
✅ Conclusion
BTCUSD is currently in a corrective phase, with bears maintaining control. The key level to watch is the $100,419 support zone, which may determine whether Bitcoin maintains its medium-term bullish structure or breaks further. Discipline and confirmation are crucial in this volatile environment.
📌 Strategy Focus: Look to sell rallies toward resistance; buy only on confirmed bounce from strong support zones.
