BTCUSD Price action analysis on HTFHi, I’m from Phoenix FX, and today I’ll be sharing my perspective on Bitcoin (BTC) price action based on the higher timeframes.
I’ll also give you my outlook on potential trade setups for today and tomorrow. Please remember that this is not financial advice—use this information as a guide only. If you find it helpful, don’t forget to like and share it with your like-minded communities.
Higher Timeframe Analysis
In my view, BTC tends to follow clear bullish and bearish cycle zones. Typically, we see a pump to new all-time highs (ATH), followed by the formation of resistance and a retracement down to a key support level. Our trading approach focuses on identifying those critical support and resistance levels, with some interim trades based on shorter-term analysis—occasionally even counter-trend, depending on the day’s market bias.
Over the past eight years, BTC has respected a major trend resistance line. The most recent ATH, around $112K, reconfirmed the relevance of this trendline. This makes it a valuable tool for projecting future ATH levels.
Looking ahead, I expect a move towards the $115K level in the coming weeks. This would likely act as a point of resistance, at which stage we might see a reversal and a drop back down to a key support zone.
Trade Setup
The chart I'm referencing highlights what I would consider the first premium buy zone, identified using a 4-hour Fair Value Gap (FVG).
The 50% level of this zone sits at $99,450. If this zone fails to hold, we may drop further to the secondary premium buy zone, which aligns with our higher timeframe (HTF) trend support and a weekly FVG. The 50% level of this deeper zone is around $89,150.
A potential long entry at $92,550, with a stop loss around $88,000, offers an excellent risk-to-reward (RR) ratio, targeting a move up to the $115K level.
Intraday Outlook
For today, I see bearish price action, with potential rejection around the $104,300–$105,000 range. Go short around the $104,750 to $105,000 zone
This could lead to a move down toward the lower key zones highlighted in the HTF analysis.
I recommend taking partial profits (TP) at every $1,000 increment and setting your stop loss to breakeven (BE) after hitting the first target.
Final Thoughts
Price action analysis is always subjective, so I’d love to hear your thoughts and ideas in the comments—each one, teach one.
Thanks for giving me some of your time.
From the Phoenix FX team, have a great weekend!
Cryptomarket

Bozo Benk – Road to Top 300
Bozo is a low-float, high-conviction breakout that’s showing all the early signs of a full-blown cycle runner. Right now, it’s flying under the radar — but that won’t last long.
coingecko: BozoBenk
Key Metrics:
Current Market Cap: $4.72M
Target Market Cap (Top 300 Range): ~$200M
Total Supply: 800M
Circulating Supply: ~400M (50% of tokens are locked)
If we hit a $200M market cap on just 400M circulating tokens, that gives a projected price of:
$200,000,000 / 400,000,000 = $0.50 per token
That's a 100x from here — and yes, that’s within striking distance in meme coin terms when a proper run begins.
Why This Isn’t Just “What If” Talk:
Low Float = High Velocity
With only 400M tokens in circulation, price impact per dollar is massive. When buyers show up, price moves fast — and that speed becomes the magnet.
Breakout Is Confirmed
After months of accumulation, Bozo just cleared its resistance zone. Volume spike. Momentum flip. Classic early-stage markup.
Reflexivity Effect
As price rises, more eyes come in. CT starts posting. Telegrams start firing signals. The crowd sees the move, and FOMO becomes self-fueling. This is how 10x becomes 50x.
Realistic Target Based on Ecosystem
$200M is not a moonshot. There are dozens of meme coins with less utility and worse structure sitting at or above that level. If capital rotates back into memes — and it always does — Bozo is positioned to ride that wave hard.
The Alpha:
This isn’t about “maybe” — it’s a perfect mix of low cap, reduced float, clean chart, and momentum fuel.
A $200M market cap on 400M circulating tokens = $0.50.
You're here at ~$0.005.
That’s the kind of asymmetry you don’t get often — and when it runs, there won't be time to chase.
Know what you hold. Trade it like you mean it.

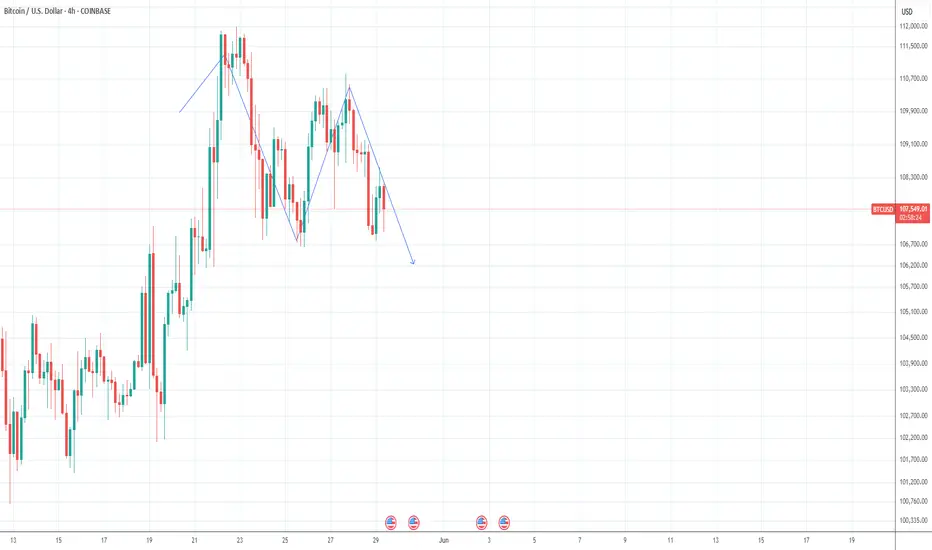
BTC/USD – Double Top Breakdown Signals Bearish Wave- 4H chart. 🧨
🔍 Chart Analysis:
🟢 Recent Price Action:
Bitcoin formed a double top pattern near the Recent All-Time High (ATH) 📈 — a strong bearish signal 🔔.
A trendline break occurred right after the second peak, confirming potential weakness ⚠️.
🟠 Supply Zone:
Price re-entered a previous supply zone (resistance area) and failed to hold above it 🧱 — indicating sellers are active again.
🔵 EMA 70 (Blue Line):
The price has dropped below the 70 EMA, signaling momentum shift from bullish to bearish 📉.
🔴 STOP LOSS ZONE:
Positioned above 110,555 🚫 — risk level for this short setup if bulls reclaim control.
🟡 Bearish Pathway (Expected Move):
Price may retest the broken zone 🔁.
Followed by a sharp drop to the 1st support near $101,503 🎯.
Confirmed by large bearish volume spikes 📊.
💥 Trade Idea:
Entry: Near 106,000 (on retest of supply zone).
Stop Loss: Above 110,555 🔺.
Target: $101,500 🎯.
Risk/Reward Ratio: 🔥 Favorable setup for swing short sellers!
📛 Pattern Breakdown:
⚠️ Double Top = Reversal Signal.
🔻 Trendline Break = Shift in Market Structure.
🧊 Supply Zone Rejection = Bearish Confirmation.

XMR/USDT Monero super cycleWarning: LONG READ
TL;DR: Monero is going to encapsulate a similar growth cycle to Bitcoin's, Privacy, agency and its extremely decentralized nature will create a FOMO storm, a new narrative for the next many years, an uprising against the control and attack on our free will as citizens.
_________________________________________________________________________________
These past few years we've seen an incredible surge in surveillance, government intervention, banks freezing funds, the list goes on, of which has led many people into deep frustration and dissatisfaction with the system.
However, what it really boils down to is the lack of agency, and within that, the lack of privacy.
This coming storm of rebellious action against the system of surveillance and control, will mean new market possibilities, and Monero is an obvious pick.
Despite its headwinds throughout the years, Monero has had incredible resilience, likely due to its very nature, providing exactly what it means to provide, privacy, agency, and decentralization.
Bitcoin has led the frontier of agency and decentralization, but an ever increasing concentration of mining power, means that its decentralization is being partially eaten away at, losing some of its initial pull of being "The people's money"
Slowly turning into a transaction-less store of value, where more and more people simply hold on without actually using it, Bitcoin was never going to have any future as a sort of day-to-day cash or money that some people were hoping for.
This should have been obvious all along, even in earlier days, that the adoption would eventually lead to stagnating transaction count, aswell as miner & ASIC concentration, meaning an ever, not increasing, but instead decreasing decentralization.
Bitcoin in its earlier days was also seen as a private, but this is simply a lack of studying Bitcoin, because its always been clear as day that we would eventually run our heads against the wall.
With states having tools to track everything, and firms like Arkham who recently uncovered Strategy's (MicroStrategy) Bitcoin wallets, where Michael Saylor prior had stated he would never unveil the adresses or location of said Bitcointo preserve privacy, well, of course someone was inevitably going to find out, Bitcoin is after all, a fully transparent blockchain, which is also good in its own sense, but that brings us to the exact problem we're facing now.
And no, i don't think Bitcoin is going anywhere.
But how are we going to take back that decentralization, take back our privacy (we never had it on Bitcoin but it certainly pushed the value thinking it did) take back our agency AND have an actual day-to-day use case where we can transact without being taxed in gigantic fees for even the smallest sums?
Monero, and it has been Monero for over a decade now.
Monero ticks all the boxes that people are so desperately trying to figure out, and Monero is slowly creeping up again, seeing impressive price increases despite its recent scrutiny, with the EU set to ban it in 2027.
Whitewashing, crime, all kinds of illegal activity, that's what the nations and states see Monero as, and for the vast majority of people, it keeps them from buying the asset, in fear of being punished for owning or using it.
Do you remember the early days of Bitcoin? I certainly do
Countries & influential people would hang Bitcoin out for being only used for criminal activity, and being nothing more than a pyramid scheme.
Again, it should be obvious that it would never be the case, a completely transparent blockchain, crime? really? the smartest criminals are not THAT stupid.
Yes, many criminals probably use Monero, the same way as criminals use dollar bills for crime, because its for a large part untraceable.
But is that untracability a feature or a flaw?
In Monero's case, its a FEATURE
A feature so undervalued, you can't even begin to comprehend the sheer size of its importance
And no, I don't support criminal activity, but Monero being used for it simply means that it is doing exactly what it sets out to be, private and untraceable.
Its not the form of money's job to fix crime, that's the job of the government and politians we "elect" in our "democracy"
It is crystal clear to me, that Monero will create a throne for itsself in the top, claiming the original purpose of Bitcoin, The people's money.
Untraceability, Privacy, Decentralization, Agency.
These key features aswell as the scrutinty it is facing on the national level, will nothing but fuel the FOMO.
The ultimate resilience, the ultimate cryptocurrency.
If you're still this early, i sincerely salute you, and congrats on life changing wealth and privacy.
BINANCE:XMRUSDT.P KRAKEN:XMRUSD CRYPTO:XMRUSD

AKT/USDT Analysis💥 CSEMA:AKT - Swing Long Plan After 30% Correction 💥
AKT faced heavy selling pressure around the weekly pivot at $2.0640 , leading to a significant correction of nearly **30%**. The big question now: **Is it time to open a swing long?**
Here’s my take👇
Although we’ve already seen a 30% drop, that doesn’t mean the downside is over . For a high-conviction swing long, patience is key. I’m watching **three key levels** to build a position safely — no FOMO here.
🔹 Long Area 1 : $1.1291 (25% allocation)
🔹 Long Area 2 : $0.9722 (35% allocation)
🔹 Long Area 3 : $0.8234 (40% allocation)
💡 This is my ultimate swing long setup . Scaling in at these levels provides a better risk-reward profile rather than chasing the bounce.
But what if price only taps **Long Area 1** and then reverses? That’s fine too. The priority is **capital preservation and strategic entries**, not catching every single move.
✅ Focus: Make more with less risk
❌ Avoid: Emotional entries and overexposure
📌 Not financial advice. Do your own research. Trade safe! 🧠💰
#AKT #SwingTrade #CryptoAnalysis #TradingStrategy #DYOR #Altcoins

BITCOIN - BEARISH MOVE !Hello Traders !
The Bitcoin failed to create a new higher high!
The price formed a descending triangle pattern.
Currently, the support level (106632 - 107332) is broken.
So, I expect a bearish move📉
________________
TARGET: 103170🎯

ETH Holding Long-Term Support – Road to $4K Open?CRYPTOCAP:ETH has successfully bounced from a long-term rising trendline that has acted as strong support since 2020. This trendline has historically triggered major bullish moves, and it’s doing its job once again.
Notably, ETH has also reclaimed the mid support/resistance level, which had previously acted as a key flip zone in past market cycles.
With both the trendline and horizontal support holding, the structure looks bullish. If momentum continues, ETH could head toward the upper resistance line, potentially targeting $4,000+ in the coming months.
The trend remains intact — this bounce could mark the start of a major leg up.

Bitcoin Correction or Trap? Watch This Support Zone CloselyExclusive #Bitcoin Update
I got lots of DMs, people are asking:
Do you think the bull trend is finished, or is it just a correction and pullback?
Guys, first stop panicking.
This is exactly what the shark wants you to do. Don’t let them shake you out.
Let’s get to the chart:
My previous chart got invalidated, and the current situation is that CRYPTOCAP:BTC is defending strongly around the $104.8K to $104.3K support zone.
According to the FIB level, we’re currently at the 0.383 level. This area has previously served as strong resistance, so it can now function as effective support.
If bulls manage to bounce from this area and push above $107K, we could trigger a sharp move toward the $112K–$113K liquidation zone,
where we have almost $12B in short liquidations acting as a strong magnet!
Let's talk about the worst-case scenario, in case we break down below this supportive area, then we have
200 EMA and a strong support around $101.4k to $101.8k.
I’ll keep you posted as things unfold. If you find my updates helpful, don’t forget to like and follow for more! #Bitcoin2025
CRYPTOCAP:BTC BITSTAMP:BTCUSD BINANCE:BTCUSDT

BTC on high time frame
"Hello traders, focusing on BTC on high time frames, the $102,000 level (referred to as the vector level) is crucial for price action. If the price convincingly breaches and closes below this level on the 4-hour or higher time frames, it suggests a potential move to the downside.
However, if the price merely sweeps liquidity and forms shadows on the high time frames without closing below the critical level, it indicates the potential for further upward momentum towards new higher highs."
If you have any more details to add or need further assistance, feel free to let me know!

Market3I haven’t been posting much lately simply because there’s nothing particularly interesting to say, the market has been a bit dull.
2025 should be a strong year for altcoins, as they’ve been consistently suppressed. With BTC dominance reaching 64%, which is quite significant, all attention remains on Bitcoin.
On this chart, you can see that $1.17 trillion acted as a rejection level for the crypto market (excluding BTC and ETH). Time will tell, but I anticipate a $4 trillion altcoin bull market before the end of 2025.
Remember, Fibonacci plays a crucial role in long-term market predictions.
Invest wisely and at the right time.
Happy Tr4Ding !

Altcoins The Moon AwaitsLike always, everything is clearly outlined on the charts :
- As a trader, it's crucial to follow logic and technical analysis. If you get caught up in the news and listen to everyone on Twitter, you won't last long.
- The first major altcoin rally was in 2018, pushing the market to $300 billion. This level later acted as a key support throughout the 2022–2023 bear market.
- The last all-time high for the crypto market (excluding Bitcoin and Ethereum) reached $1.15 trillion in 2021. ( blue doted vertical line )
- This all-time high was retested in December 2024, with this ATH acting as strong resistance. ( second blue doted vertical line )
- The next move could be a breakout above this resistance. According to Fibonacci projections, the altcoin market has the potential to reach $4 trillion.
While the spotlight remains on Bitcoin and ETFs, altcoins could catch up with a sudden and powerful surge, so make sure you’re not left behind.
Hodl!
Happy Tr4Ding !

ETH 1W – Long above 200MA | Retest or Launch?ETH just broke two major barriers:
✅ Closed above the 200MA on the weekly
✅ Broke out of the pink zone, which marks the textbook double top base from June & December 2024
That pink box held price for months — a structural pivot that now flips from resistance to possible support.
Price paused into the 50MA, which typically doesn’t offer heavy resistance on the 1W.
If we see a pullback, I’m watching for a wick into the 200MA or even into the pink zone. Otherwise, this might just go vertical if macro stays calm.

BTC 3D – Key S/R Level in PlayBTC is currently trading below the black line, which marks the double top support/resistance level on the 3D chart.
Tonight’s 3D candle close will be important:
🔻 A close below could open the way for more downside.
🔼 A close above might invite continuation—but neither outcome is guaranteed.
🎯 The best approach? Stick to the system.
Place orders just below the last PSAR, stay disciplined, and avoid emotional decisions.
✅ Always take profits.
✅ Always manage risk.
These are the only two things we can truly control.
Thanks for reading—and if you found this helpful, feel free to react or leave a comment!

Breakdown Alert: Crypto Market Cap Tests Major Demand ZoneThe total crypto market cap is testing a key support zone around $3.23T. This area has acted as a demand zone in the past, and now price is hovering right above it.
The current structure suggests a possible breakdown–retest–continuation setup. If price retests this zone from below and fails to reclaim it, further downside toward $3.0T could be likely.
This idea is based on price action and structure only — no indicators used.
❗ This is a personal analysis for educational purposes only. Not financial advice.
Feel free to share your thoughts or technical perspective in the comments

Render – Re-Entry Opportunity After Hitting First TargetRENDER hit the first take profit target (TP1) with a ~52% gain — great execution. Now, after the expected pullback, price is approaching a key support zone, offering a second swing trade opportunity.
🔹 Entry Zone:
Around $4.00 support
🔁 Previous resistance turned support
🧭 Psychological level and structural base
🎯 Take Profit Targets:
🥇 $4.80 (recent local high / resistance)
🥈 $5.40 (next significant supply zone)
🛑 Stop Loss:
$3.69 (below key support & invalidation level)

Bitcoin Short-Term, Aims Below $100,000 (Alert!)Good morning my fellow Cryptocurrency trader, overall, the market looks great.
The market looks great but never forget that nothing is set in stone, market conditions can always change.
Let's consider Bitcoin for once on the short-term timeframe.
The long-term timeframes are good to spot the bigger cycle; the smaller timeframes are good to know what will happen next.
— Bitcoin 4H TF (Short-term)
Bitcoin hit a new all-time high and was followed by a strong bearish volume session. The action went on to move below a strong resistance zone, the ath range.
Now Bitcoin is trading below "local resistance" and this opens up a bearish bias short-term. When it moves back above $110,000, we can say the bulls are back in. When it trades below $106,000, we can say bearish confirmed.
Here we can see Bitcoin bearish while aiming lower.
If it continues dropping, 100K won't be the end. Either it recovers now, or else we will see a test of the low 90Ks.
Leave a comment if you agree.
Follow if you disagree.
Thank you for reading.
Namaste.

PoL - Long Set-UPBINANCE:POLUSDT
Current Price: ~$0.2207
Support Zone: $0.18 – $0.20 (highlighted in orange)
SL Below: 0.16
Target - 0.22 , 0.25++
Structure: Price recently broke below a trendline and retested a previous support-turned-resistance (green zone).
Volume: Decreasing, suggesting weakening bearish momentum

SHORT Bitcoin 10X Lev. Full PREMIUM Trade-Numbers (PP: 175.6%)For experts only. This is not for beginners.
Leveraged trading is ultra-high risk and it is even harder when it comes to shorting.
This is not medical advice. This is not spiritual advice.
This is definitely not financial advice. This is just a chart and some numbers.
How you decide to use these numbers is completely up to you.
I am wishing you tons of luck and success; profits 100%.
This is a strong chart setup. It looks great.
_____
SHORT BTCUSDT
Leverage: 10X
Entry levels:
1) $111,111
2) $109,255
3) $108,000
4) $107,000
Targets:
1) $103,149
2) $101,012
3) $98,790
4) $94.239
5) $89,999
11) $88,888
Stop-loss:
Close weekly above $115,000
Potential profits: 175%
Capital allocation: 4%
_____
Thank you for reading.
If you enjoy the content make sure to follow.
(Leave a comment with your toughts.)
Namaste.

King BTC - Bitcoin Dominance Continues to Go Up OnlyIf market cycles still matter, this current one will be remembered as a disappointment by many crypto traders. With Bitcoin Dominance up-only, this has been the cycle of institutional traders who accumulate Bitcoin. For years, crypto traders hoped that institutions would 'buy our bags'. But for now, only 'King BTC' has benefitted. From its low point at less than 40%, Bitcoin market cap dominance versus the rest of the crypto markets is now sitting at 65%. The times when crypto traders would 'hunt gems' and hold Altcoins that would go up 10-100x are over. Between the 'crypto trenches' of memecoin traders hunting very low cap memes that can go up multiples and then go back to 0 even quicker and 'King BTC', not much of the rest of the market has caught a bid.
The picture is completely different on the institutional side. For many funds, Bitcoin is now part of a core treasury strategy. Pensions and endowments dip in through ETF exposure. Especially in the US, the regulatory and legal outlook are improving rapidly under a pro-crypto US administration. Asset managers like BlackRock are promoting BTC as a long-term store of value with lower correlation to equities than previously assumed.
In fact, institutional Bitcoin FOMO is accelerating rapidly. Michael Saylor's MicroStrategy famously leveraged its balance sheet to borrow funds, buy Bitcoin for its treasury and then rinse and repeat. The strong performance of MicroStrategy has unsurprisingly led to copy-cats. This week, GameStop became the latest one, confirming that it had bought 4,710 BTC worth about $513 million. In a sign that the buck might not stop here, SharpLink, a performance-based marketing company serving the U.S. sports betting and global iGaming industries, launched a $425million private placement to accumulate Ethereum into its treasury.
Leaving aside the question of who would lend so much money to a sports marketing company, other burning questions remain. Will Bitcoin FOMO lead to another parabolic rally? Will Ethereum treasury-buys finally lead to new all-time-highs for the 2nd largest Crypto Coin by market cap? And will that lead to a 'more traditional' Altcoin rally? Maybe most importantly: how sustainable is the MicroStrategy Treasury accumulation?
As always in Crypto markets, reflexivity is strong on the way up, but critical on the way down. If the BTC price ever drops below the average purchase price of its Bitcoin and debt-rollover deadlines are approaching, will MicroStrategy end up having to sell Bitcoin in a fire sale? Past market history tends to agree with Murphy's Law: usually, whatever can go wrong in crypto, eventually does go wrong. Maybe the day will come when the rise of Bitcoin dominance will stop 'the hard way'.

ETHUSDTEither from the current price or from the price of 2653.06, the areas worth buying are at $2852, in either case the price will reach 2852. BINANCE:ETHUSDT

my prediction is on bitcoin downward correction is onprevious post i told you guys bitcon need a downward correction. now see the results already its' going down.
Algorand 5X Lev. Full PREMIUM Trade-Numbers (PP: 1500%)This is an unusual pair for us to approach with leverage, the last time we opened a LONG on ALGOUSDT was in August 2023. Market conditions are different today.
Back then, prices were trading at the bottom before the recovery, so we were predicting the trend reversal and bullish breakout. Today, the bottom pattern is already in, a rounded bottom coupled with a long-term higher low (April 2025 vs August 2024). So we are only predicting a continuation.
Needless to say, I believe the bulls have the upper-hand. The action right now is happening above the 3-Feb. low, and after more than a month of rising prices there is still no rising volume, which means that there is plenty of room available for growth.
We are doing an easy wave, easy targets. The final wave can go much higher than what is shown on this chart. Since we are not greedy, we are happy with 465% and 1,500%.
The 1,500% is a mild target and high probability.
The rest is up to you.
Thank you for reading.
Full trade-numbers below:
_____
LONG ALGOUSDT
Lev: 5X
Entry levels:
1) $0.2355
2) $0.2200
3) $0.2000
Targets:
1) $0.2564
2) $0.3247
3) $0.3800
4) $0.4352
5) $0.5138
6) $0.6139
7) $0.7243
8) $0.7926
9) $0.9031
Stop-loss:
Close weekly below $0.1900
Potential profits: 1502%
Capital allocation: 3%
_____
Namaste.

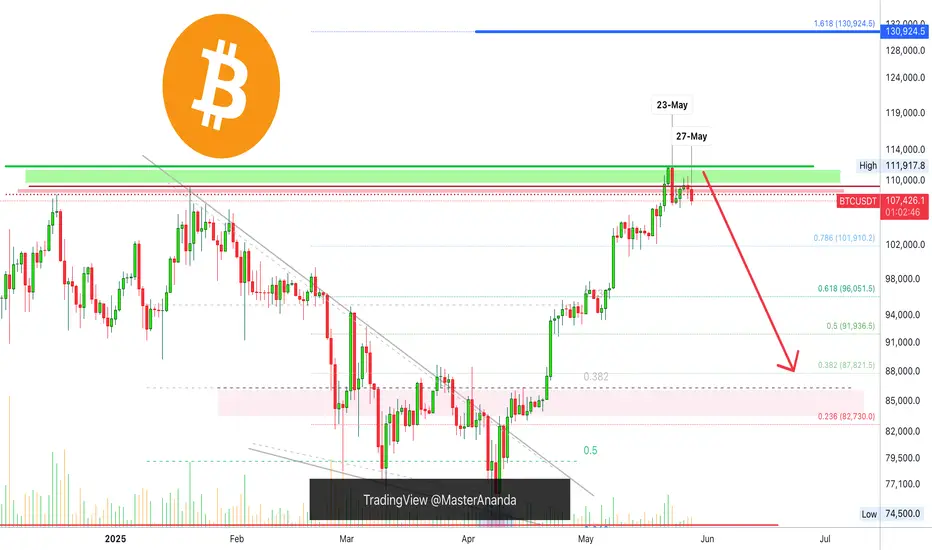
Bitcoin's Bearish Potential Explained Using Candlestick ReadingI will explain the chart as it is now based on candlestick reading and then add some additional information. The bearish bias short-term has been confirmed.
The green line marks Bitcoin's all-time high.
Dark red is the previous ath 20-Jan. 2025 and the dark red dotted line the high from 17-Dec. 2024.
Bitcoin (BTCUSDT) now trade below all three levels on a daily basis.
Right after the all-time high, 23-May, we have a full red candle.
The full red candle is a rejection as Bitcoin produced this new ath which is also a technical double-top.
After three days green, Bitcoin produces a lower high in the form of a Doji. 27-May. This Doji confirms the candle from 23-May.
Today, 28-May, Bitcoin produces a red candle as continuation of the action from 23 and 27 May.
Trading volume is super low.
Big institutions are buying and these always tend to buy at the top. The top means higher no more. A correction is upon us.
Resistance has been confirmed, how can Bitcoin turn bullish again short-term?
It needs to move and close above the all-time high on a daily basis. Anything lower and you can SHORT.
The fact that Bitcoin closed 7 consecutive weeks green, with the last few weeks become smaller, it is a sign of exhaustion, the market is looking for a relief.
A retrace can turn into a correction and if panic sets in a correction can turn into a crash.
It is still early though, but these things tend to unravel pretty fast.
Are you paying attention?
What will happen now?
A bullish trend is based on higher highs and higher lows. The bigger structure is not likely to break but, Bitcoin is going down, it doesn't matter if it is short or mid-term... Do what you have to do to protect yourself or secure profits. You can never go wrong by securing some profits when your pairs grew by 300 to 500%. If you are waiting for more, forever more, you are just a greedy ... trader.
Thanks a lot for your continued support.
Secure the win and forget the greed.
Win, win, win. And you will have the chance to play again.
Plan before buying. Develop a plan and use this trading plan to achieve trading success.
Whatever you do is up to you.
I am just reading the chart.
I left one question unanswered on purpose; How far down will it go?
Tell me in the comments, if you tell me your version I will tell you mine.
Thanks a lot for your continued support.
Buy and sell.
Sell, not hold.
Namaste.