Ethereum Classic 5X Lev. Trade Reminder (PP: 1470% Spot)I have a set of trade-numbers for ETCUSDT with 5X Leverage. I will not post them again but instead will link them below, this is a friendly reminder.
The small retrace now is sending prices back into our entry zone or entry levels. "The market always gives a second chance."
You see, there is no need to rush to try and catch a bullish wave. Notice how the market always offers countless chances after the bottom is in. Right?
Ethereum Classic started to move up but retraced back into the entry zone. Rushing can produce a buy at $21 and then a liquidation. Being patient allows for a lower entry and then massive profits. Notice how long it takes for the market to move.
Many people message me saying, "OMG! I don't want to fomo buy." "I don't want to miss-out, fast, I have to buy." But nothing is happening fast. We are here day after day, always, and we can see the swings and the waves.
If one pair starts moving, that's ok, there will always be another pair trading at bottom prices. Instead of buying LONG the one at resistance, go LONG with the one at support. This is a great example.
ETCUSDT is looking good now because prices are lower and an entire week red. This is good, simply more consolidation before the start of the 2025 bull market phase-wave.
We are going up, and it will be awesome.
Namaste.
Cryptomarket

NOTCOIN : IT'S TIME TO BUY GUYSHello dears
If you are risk-averse, this analysis is for you...
According to the bullish pattern that has formed, you can see that we had a decline and now it is time to take a logical risk, that is, we buy at the specified levels with capital management to move towards the specified goals...
*Trade safely with us*

XRPHighly likely XRP retest $2.20 before moving higher.
Long-term investors are looking for lower prices before a tariff deal with China. A liquidity sweep is needed before we move higher, or we will continue moving lower.
We break $2.50 and we will see $3 quickly after. ETF going Live on the 19th, China deal, SEC case ending will all catapult price.
LOCK IN 🔐

TradeCityPro | Bitcoin Daily Analysis #94👋 Welcome to TradeCity Pro!
Let’s go over the Bitcoin analysis and major crypto indexes. As usual, I’ll cover the New York futures session triggers for you.
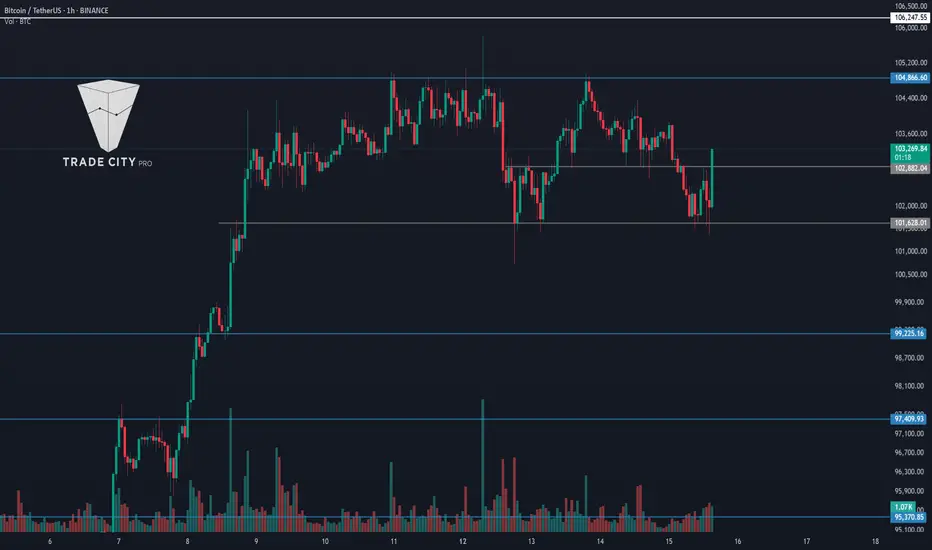
⏳ 1-Hour Timeframe
As you can see, yesterday the price was rejected from the 104204 level and formed a lower high compared to 104800. Currently, there's a strong chance the short trigger will activate, so let’s review those triggers.
🔽 For a short position, the area where the price is currently consolidating—102882—is a suitable trigger. If this level breaks, the price could drop to 101628.
📊 One note about this trigger: the zone between 102882 and 101628 is a major support range. Every time the price has entered it, it’s formed long wicks and exited with strong bullish candles.
✨ So, if we enter a position based on this trigger, the volatility of the candles increases the chance of getting stopped out. On the other hand, using a large stop loss isn’t ideal either, since these trades go against the main trend and work better with a tight stop to hit the target faster.
💥 The next trigger is the break of 101628, which seems more reasonable. Breaking this level confirms a deeper correction and opens the path toward levels like 99225.
✔️ For a long position, if the price prints a higher low above 101628, we can confirm a bullish bias with the break of 104204. A higher low indicates strong bullish momentum, allowing us to use a slightly riskier trigger.
⚡️ However, if the price falls to the bottom of the box and then returns to the top, the main long trigger becomes a breakout above 104800.
🔍 Today, most of the market volume is on the sell side, and red candles are getting solid volume, so a correction to the box bottom seems likely. Either way, we have to wait for the triggers to activate.
👑 BTC.D Analysis
Bitcoin Dominance continues its bullish move after breaking the descending trendline. Yesterday, it printed a higher low and broke 63.30, reaching 63.61, and is now consolidating below that level.
🔔 If this level is broken too, we’ll have the first confirmation of a trend reversal in dominance. Full confirmation will come after BTC.D holds above 63.95.
📅 Total2 Analysis
Let’s move to Total2. Yesterday, the 1.19 trigger activated, and the price dropped to 1.17. The reaction to 1.18 wasn’t strong or clean, so I’ve adjusted the support level to 1.17.
📉 Today, we can open a short position if 1.17 is broken. For a long, if the price moves above 1.19, we can go long on altcoins that trigger accordingly.
📅 USDT.D Analysis
Now looking at Tether Dominance. Yesterday, it reacted to 4.70 and is now forming a higher low, heading back toward that level.
☘️ I see strong bullish momentum on the chart, and I believe the probability of breaking 4.70 is high. If it breaks, USDT.D could move up to 4.82.
❌ Disclaimer ❌
Trading futures is highly risky and dangerous. If you're not an expert, these triggers may not be suitable for you. You should first learn risk and capital management. You can also use the educational content from this channel.
Finally, these triggers reflect my personal opinions on price action, and the market may move completely against this analysis. So, do your own research before opening any position.

Bitcoin Cash Short-Term: Trading Above Support And...Ever since 7-April, which marks the correction bottom and trend reversal, the maximum we have is three consecutive days closing red. This is great news.
Currently BCHUSDT closed the last three days red. This is the fourth day.
1) It can happen that this day also closes red, this puts pressure on tomorrow being green based on past action.
2) It can happen that todays ends up closing green and the market starts to turn.
This is not only true for this period but also other periods. Whenever Bitcoin Cash is rising, long sequences of bearish days are rare to come by.
If the market starts to turn, the current down period will result in nothing more than a very short stop with minimum retrace before additional growth. This is a transition period. The whales move billions of dollars and the algorithms need to be recalibrated, "reprogrammed," after just a few weeks.
Each time a set of Altcoins move forward for several weeks, there is a small pause, the programs are updated, the money is positioned and a new set of Altcoins will grow. The previous set can continue growing but the top performers tend to change. You will see this happening week after week after week throughout the entire bull market.
The trick to achieve high profits is to forget about catching the next big wave. Choose your pair and hold, if you look closely, it has been growing day after day after day. When you try to catch the next wave, it is always too late, but everything is growing slowly, we are soon to be one level up marketwide. I predicted 2-3 levels up by the end of the month. Watch!
Bitcoin Cash already produced more than 70% growth since the 7-April bottom. It will continue rising long-term, this is only the start.
Diversification can be a good strategy if you want to catch those moving up strong. But it is better to focus on strategy and sure success rather than excitement and perceived high gains. The market is growing anyway and it is not going away.
Do it right and you will earn more mid-, short- and long-term.
Namaste.

TradeCityPro | SOL: Key Retest at Support Before Next Breakout👋 Welcome to TradeCity Pro!
In this analysis, I’m going to review the SOL coin—one of the most requested assets and a very popular project in the crypto space.
✔️ This coin holds a market cap of $3.61 billion and is ranked 6th on CoinMarketCap.
⏳ 4-Hour Timeframe
As you can see, a bullish leg started from the 142.25 support and extended up to the 177.51 resistance.
🔍 Currently, after a fake breakout of 177.51 and a rejection from 183.86, the price has dropped back below 177.51 and formed a support level around 166.82.
📈 So far, the price has tested the 166.82 level twice and shown a strong bullish reaction. Recently, a powerful support candle has formed at this level, suggesting it’s being defended.
💥 If the price can move back toward the upper levels, a breakout of either 177.51 or 183.86 would provide a long entry trigger. If a higher low and higher high form before the breakout of 177.51, the trigger becomes even more reliable.
📊 Market volume has declined since the upward move ended. If volume increases as price rises again, it would provide a volume confirmation.
🔽 For a short position, the 166.82 level serves as a valid trigger. In my view, it’s a strong enough level to justify opening a short. The next major support below lies at 142.25.
❌ Disclaimer ❌
Trading futures is highly risky and dangerous. If you're not an expert, these triggers may not be suitable for you. You should first learn risk and capital management. You can also use the educational content from this channel.
Finally, these triggers reflect my personal opinions on price action, and the market may move completely against this analysis. So, do your own research before opening any position.

Bitcoin, Higher Prices Or What? How Likely Are Markets To Crash?You cannot deny that the market can crash any day right? What to expect?
Should I be worried?
Last time I was feeling all good and all was well and then suddenly a flash crash showed up and my position was gone. I lost all of my money because of my stupidity of course, I couldn't blame the market because the market did not put the leverage on my position, it was all me, so what now; will it happen again?
You cannot get liquidated if you have less than 5X leverage on your position when the market goes sideways. The squeezes, shakeouts and swings normally take out positions with 10X or more.
You cannot get liquidated if you are LONG but buy when prices are low, near support.
You can get liquidated if you are buying when prices start to rise without a plan on an impulse. The market is shaking just for you.
You will definitely get liquidated if you are trading continually with 20X. There is an entire set of experts, professionals and programs buying and selling just to distract you and when you get distracted BOOM!, out of nowhere money forever gone, namaste.
» Bitcoin
It is the same dynamic all over again, resistance turns support.
I will reveal the technicals for you and you decide what to believe and what to do but my reasoning is supported by data, facts. It is not wishful thinking or random choosing. It is true the market can move in any way but you have to go with the side that has a high probability of success. If you do this often enough, you win in the end.
When the market was going down, every time there was a stop the next move would be a continuation of the main direction, the trend.
When the market is going up, every time there is a stop the next move will be a continuation is simple.
The question is this; is the market rising or falling?
The market has been rising for more than a month. Yes, it is meeting resistance but this resistance has already been challenged several times in the past. Bitcoin moving back to it after a strong correction means the decision point. If we didn't know about the fundamentals, the change in the regulatory landscape and the Altcoins, I don't know, I would say things look mixed at the most, but knowing about all these other factors I can say with confidence that Bitcoin will continue to grow. Don't get me wrong, there can be consolidation for a few more days and even more swings to remove some of those over-leveraged trades; the next major move is up and a new All-Time High.
Thank you for reading.
Namaste.

XLMUSD Long - Inverted Head and Shoulders on the daily
- Price is re/testing the neckline of the H&S
- 20ema is now trading above the 50ema (good indication of a possible up trend starting)
- Stop loss below the higher low
- take profit around 0.35 possibly higher

TradeCityPro | Bitcoin Daily Analysis #93👋 Welcome to TradeCity Pro!
Let’s dive into the analysis of Bitcoin and key crypto indices. As usual, in this analysis, I’ll go over the triggers for the New York futures session.
⏳ 1-Hour Timeframe
Yesterday I mentioned the 102882 trigger for opening a position. The price made a bullish leg upward but failed to reach the 104866 resistance and is now moving back down.
🔍 If a lower high is formed compared to 104866 and the price approaches the 101628 support, we can open a position upon a breakdown of that level.
✨ The RSI oscillator is moving below the 50 zone, and with the selling volume coming into the market, the likelihood of forming a lower high than 104866 increases.
💥 Confirmation for a short position on the 101628 break could come from RSI entering the Oversold zone. Volume must also rise significantly, as the overall trend is still bullish, making short positions very risky. If you open one, make sure to secure profits quickly.
📈 For a long position, our trigger is still the 104866 breakout—no major change from previous days. The main resistance remains at 106247.
👑 BTC.D Analysis
Bitcoin dominance continued its upward movement to 63.30 yesterday and is now moving downward again. A breakdown of 62.65 would confirm the continuation of the downtrend in dominance.
🔼 For BTC.D to turn bullish again, it needs to break above 63.30 and could start another bullish leg if that happens.
📅 Total2 Analysis
This index didn’t move much higher yesterday due to the rise in Bitcoin dominance. It failed to reach its previous highs and is now near the 1.19 support.
📊 We can define a key support zone between 1.18 and 1.19. A breakdown of this zone could signal the start of a deeper correction.
📅 USDT.D Analysis
A range has formed between 4.51 and 4.69, and this index is consolidating within it.
🔑 A breakout in either direction could give us a trade setup. Breaking above 4.69 confirms a bullish move, while breaking below 4.51 signals a bearish trend and potential market rally.
❌ Disclaimer ❌
Trading futures is highly risky and dangerous. If you're not an expert, these triggers may not be suitable for you. You should first learn risk and capital management. You can also use the educational content from this channel.
Finally, these triggers reflect my personal opinions on price action, and the market may move completely against this analysis. So, do your own research before opening any position.

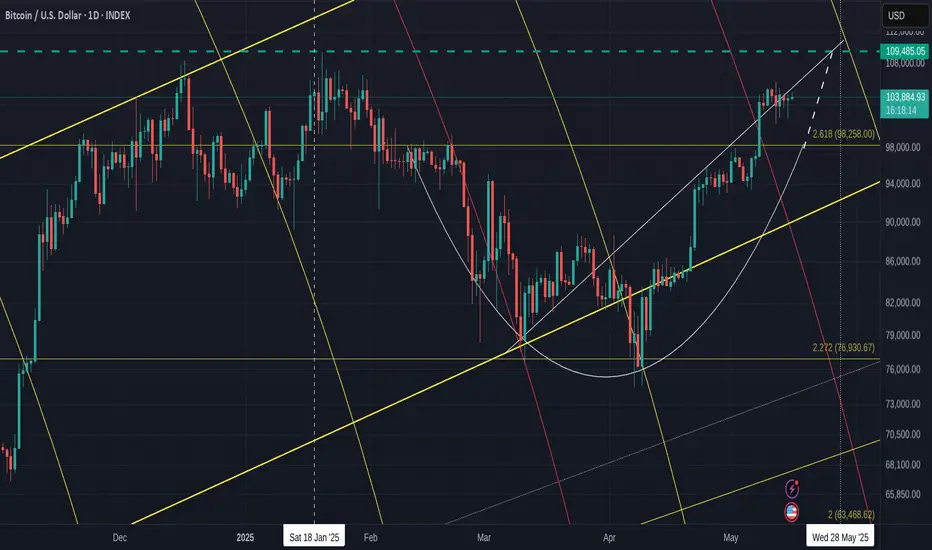
Comprehensive BITCOIN Analysis for the next 7 days - DAILY chart
First Off - Sorry for all the lines on the chart but EVERY one is very relevant to what is happening right now.
The Dashed Blue Horizontal line is the current ATH line. possible Resistance.
The 2.618 Fib extension has not yet been tested as support. This could happen still, at any point till end of month and is around the 98K usd zone.
PA has Ranged through the Local rising line of support, as if it no longer existed, which was a little surprising given the strength that PA has still. There maybe some uncertainty in the air.
PA is above the neckline of the Cup pattern it printed and, again, it would not be unusual to see PA come back down to test this Neckline as support, which is on that 2.618 Fib extension.
The Bold Yellow line is Long Term Support line since 2015, showing that Bitcoin PA is in the Lower side of a Long Term ascending channel, with plenty of room to rise,
PA has a lot of inert strength right now, so, we may not see this retest happen.
We just have to wait.
BUT you can see that Rising dashed line, the extension of the Cup pattern.
PA may range across into this and bump into it next week. If it acts as support again, PA will then be pushed into a tight Squeeze against the other rising line of support, with an Apex on the current ATH line.
PA ALWAYS REACTS BEFORE THE APEX
All that points towards some Volatile times next week if PA remains in this area.
The other descending line there is a 618 Fib Circle. You can see that 98% of the Time, PA is effected by these.
All this shows us 4 points of resistance, in the same Zone, All Next week and PA will Either Shoot through it with a Big push, Or we may see PA Drop back down. The Big question being, how Far ?
We do not want to loose the 2.618 Fib ext at 98K
But what else can we look at. ?
The RSI DAILY
This is still up high in the near Over Bought zone. It can range up here for extended periods but this is something we should be aware of as the possibility of a drop does exist.
On the weekly, RSI has room to move higher & the 4 hour is in neutral zone, again with ability to push higher.
The MACD DAILY
This is once again curling over and about to test the red signal line as support.
On a 4 hour chart, the MACD is down on Neutral line, giving it strength to push higher and if that continues, we will see the yellow MACD line bounce off the Red signal line on the Daily chart.
Once again, Look at the Histogram and the similarity to the area that the Arrow is pointing at.
We could repeat this but on a larger scale. We have to wait and see if this happens.
But also note how there was a Visit into a red Histogram ( for 4 days ) before the bigger push and I remind you about what has been said above.
So, what else can we look at that may offer some ideas ?
The Chart below is the 4 main Crypto Dominance charts by market Cap - 4 hour
BTC.D - ETH.D
OTHERS.D - USDT.D
( OTHERS = Top 125 Coins MINUS Top 10 by Market Cap) Mid to Low cap
We have recently seen a Drop in Bitcoin dominance, giving the ALTS some time to push higher. This is seen with the BTC.D dropping and the ETH.D and OTHERS.D rising
Also note how USDT.D Dropped, showing that stable coins were being exchanged for Crypto,
And as we see now, we have the possibility of BTC.D being rejected by its 50 SMA ( Red)
ETH.D is above its 50 SMA, showing it had a good push and may get support if PA drops
OTHERS.D has already fallen below its 50 SMA, showing a brutal sell off, rapid profit taking.
That is the world of ALTS.
In the last 48 hours, we saw a return for Bitcoin as it rose from a shallow Low in its Range. This was enough to cause a sell off of the ALT coins as we see in the Drop in Others.D
ETH however, remains in a range with obvious intention to continue higher if the market allows.
Lastly, we can compare Bitcoin to the other Markets
Bitcoin - CFD GOLD
DXY - S&P500
Bitcoin has performed well. It has reclaimed some position on Gold recently while it climbed alongside the S&P
We can also see how BTC climbed while DXY dropped.
This highlights some Flaws in using the BTC USD pair to judge the success of BTC but this is explaned better in another post. But in short, If the $ looses Value and your BTC USD pair appears to climb, theg ain is lost as the $ is worth less.
Use BTC XAUT pairs. Bitcoin Gold Pair - Historically, GOLD looses little Value by comparison. So when Bitcoin gains against Gold..It is WIN WIN
So, in conclusion, we see Bitcoin under some pressure to avoid Lower or sharper Drop in the short tern.
The Lower Timeframes show us that BTC has the ability for a Continued Range but with caution.
We see ETH ( and larger Alts ) intent on remain in the game now they have had a small glimpse of Gains
And we see that Mid and Lower Cap Alts are mostly just money makers providing you play the game right. And that game may have some more time if Bitcoin Stumbles in the next 7 days.
And that possibility does exist.
Today is crucial in many ways and will set the tone for the following week.
There is Financial Data being released by the USA today and if unfavourable, we may see some sharp moves.
And ,Longer Term VERY BULLISH - I HOLD AND CONTINUE TO BUY WHEN I CAN ON SPOT ORDERS
I hope this helps and I am grateful for comments
TradeCityPro | CAKE: Triangle Squeeze Nears Breakout Decision👋 Welcome to TradeCity Pro!
In this analysis, I want to review the CAKE coin for you. This project is one of the crypto DEXs that operates on the BNB network and is among the most popular projects on that chain.
💫 This project’s token, CAKE, has a market cap of $747 million and ranks 95th on CoinMarketCap.
📅 Daily Timeframe
As you can see in the daily timeframe, a symmetrical triangle has formed, and the price is moving near the end of this triangle.
💥 Personally, I don’t trade when the price is in this area of the triangle and prefer to wait for the triangle to break, because there’s a high chance of random volatility that can cause missed opportunities due to incorrect entries.
✅ I recommend that you also wait for a breakout from this triangle and open a position only after it breaks—whether to the upside or downside.
✨ For a long position, you can enter after a breakout above 2.5. The main trigger will be the 2.847 zone. An RSI move into the Overbuy zone would also be a great confirmation for this position.
🔽 For a short position, our first trigger is the 1.909 level. If this level is broken, the price could start a downtrend toward 1.461. The main confirmation of a bearish trend will be a breakdown below 1.461.
📊 In any case, whichever trigger gets activated, I believe volume confirmation is essential. If volume increases along with price movement, the likelihood of that move being a fakeout decreases.
📝 Final Thoughts
This analysis reflects our opinions and is not financial advice.
Share your thoughts in the comments, and don’t forget to share this analysis with your friends! ❤️

Aave Keeps Rising —Makes Sense? Aave bottomed 7-April, and now it keeps rising after just two days red. Aave hitting bottom 7-April means the same with Bitcoin and the rest of the Altcoins which means Bitcoin and the rest of the Altcoins will continue growing as well, makes sense?
Aave peaked in December 2024 same with the rest of the Altcoins market, they are all doing the same. The fact that Aave is bullish now and keeps rising reveals what is to come next, makes sense?
As soon as there is a small retrace people wait for the crash to come, ignoring the fact that we are already in the 2025 bull market and bull market simply means sustained growth. Makes sense?
The Altcoins will continue to reveal what will happen with Bitcoin before it does, it is inevitable, many people in the industry are in the know. When you see Bitcoin stop and you wonder what will happen next, just look around, look at the Altcoins market and the answer will reveal itself, makes sense?
Very easy. Whenever the market drops, see how far down the Altcoins go. If Bitcoin is set to drop you will know it because the Altcoins will start moving down much stronger and much faster than Bitcoin. If Bitcoin finds resistance and is set to move ahead, no retrace, you will have the proof coming from the rest of the market. Some smaller pairs will move ahead.
Thank you for reading.
Namaste.

BTCUSD Next MoveNote: This chart presents a short-biased plan for BTC/USD based on key technical levels and price action signals.
🔍 Key Levels
: Resistance / All-Time High Area: $105,000
: Support Zone: Around $101,000
: Sell Trade TP1: $99,000
: Sell Trade TP2: $96,000
: Final Target: $93,500
: Critical Breakdown Level: $101,000 (Support)
📌 Plan Breakdown
🟦 Bearish Bias Setup:
> The market is consolidating between $101,000 support and $105,000 resistance, forming a range-bound structure near all-time highs.
> A breakdown below $101,000 support with a confirmed candle close below that level would trigger a sell signal.
> Rewritten chart note:
If the price breaks below the $101,000 support area and a candle closes beneath it, we can consider initiating a sell trade.
🔽 Downside Path:
: If the price breaks the support:
: First target: $99,000 — minor support.
: Second target: $96,000 — highlighted range zone.
: If the price breaks below $96,000, expect further downside toward $93,500 (final target).
🔄 Sideways Possibility:
: If the price breaks below $101,000 but fails to push through $96,000, the market may range between $96K–$99K before choosing a direction.
: The purple box (around $96K) is expected to be choppy — a break below confirms strong bearish continuation.

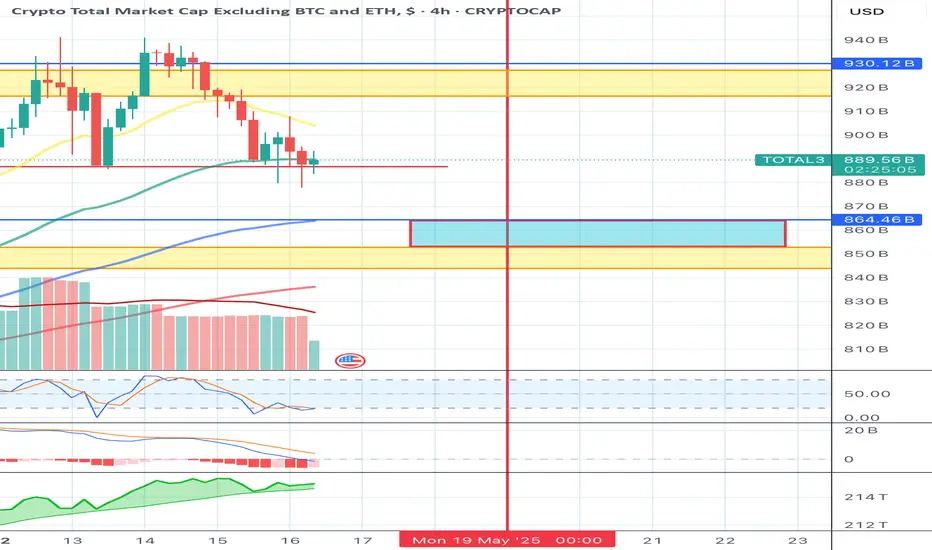
Market Pump, real or fake news?The pump is likely to begin again around the blue zone on May 19th. You might witness an unexpected surge in the #Altcoins market.
I hold(From Large to Small): CRYPTOCAP:SOL CRYPTOCAP:SUI CRYPTOCAP:ETH CRYPTOCAP:ADA CRYPTOCAP:XRP
Memecoins: $NAIIVE CA:0xB21b24F12c6125487a33fCF96aB06a5c74114444
EtherFi Governance Token & The 2025 Bull Market (PP: 1,111%)EtherFi is hot right now just as Ethereum is very hot. The project looks really good with great offerings, great products... Let's consider the chart. If you have a good product with a great chart, that's a combination for a massive 2025 bull market. You are bound to get numbers beyond this chart.
The long-term support and accumulation zone was lost in late February/early March. It was recovered again in May. The bottom was only available for two months. You are one of the lucky few if you decided to buy at bottom prices. Prices that will never become available again.
ETHFI is back above its August 2024 low, thus bullish; now trading with a bullish bias within its long-term accumulation zone. A price zone where we can buy, big, focusing on the long-term. A great chart, huge potential for growth, can't say it often enough.
There is really high volume here, the highest since launch date.
This high volume indicates and confirms that the bottom is in. If prices were to move back lower, trading volume the past two weeks would be much lower. Since prices are set to grow, volume is really high, the whales are loading up.
Not all is lost. It is still early because the last drop was a stop-loss hunt event. Notice the blue space on the chart, this is the standard buy zone. Here, in this range, ETHFIUSDT traded for more than 3 months in 2024.
A bull market can be expected now, a bullish trend.
Nice and easy, buy and hold; the market will take care of the rest.
This post is meant to alert you of a great entry timing and prices.
This is for spot traders. An easy buy. —Focused on the long-term.
Thank you for reading.
Namaste.

Bitcoin: $150,000, $180,000, $200,000 Or $220,000This is a question that nobody has been able to answer in the past 6 months: Will Bitcoin peak at $220,000 or $150,000?
Will the next All-Time High happen at $150-$160,000 or $180,000?
It is hard to say right now isn't it? But, consider this, if a new All-Time High will be hit within a few short weeks, or days, then there is plenty of room for Bitcoin to reach levels toward 200K. So maybe 150-160,000 is an easy target, it can go higher...
Now, it is true that we can guess and speculate about $250,000 or $220,000 or more, but there is no doubt that the next move is a rise, a strong rise, a continuation of the bullish move that started just a month ago. Five consecutive weeks closing green. As bullish as it gets.
Are you a SHORT trader?
You are about to be liquidated. There is till time, close your position now because Bitcoin is going up!
This is a friendly reminder.
Load up on the Altcoins.
Thanks a lot for your continued support.
Namaste.

TradeCityPro | Bitcoin Daily Analysis #92👋 Welcome to TradeCity Pro!
Let’s dive into today’s analysis of Bitcoin and key crypto indices. As usual, I’ll walk you through the futures session triggers for the New York session.
⌛️ 1-Hour Timeframe
As you can see in the 1-hour timeframe, the price has broken below the 102886 support and dropped to 101628, where it found support and is now making its way back toward the 102886 level.
✨ If the 102886 level is broken again, we could open a long position targeting the main recent high of the market at 104886.
🌩 The 104886 zone is a very significant level, and breaking it could initiate the next bullish leg for Bitcoin. However, the all-time high resistance at 106247 remains a solid barrier, forming a key supply zone between 104886 and 106247.
✔️ Since this zone is a major area of supply, it’s best to already be in a position before price reaches it. There’s a strong chance of a sharp move, and the breakout may not provide a clear confirmation candle, making it difficult to catch an entry in real time.
🔽 For short positions, our current trigger is the 101628 level. A breakdown here could begin a deeper correction. Key support levels to watch are 99225 and 97409.
👑 BTC.D Analysis
Moving on to Bitcoin dominance—yesterday, the trendline we had drawn was broken, and now dominance is heading toward 63.12.
🧩 The break of this trendline doesn’t indicate a trend reversal just yet. The bearish momentum in this current leg has been strong, and for a full reversal, we would need to see a higher high and higher low form on higher timeframes.
🔔 For now, the next corrective zones for dominance are at 63.61 and 64.10.
📅 Total2 Analysis
Let’s look at the Total2 index. Like Bitcoin, it has undergone a correction and has reached the 1.18 support level.
🎲 The current short trigger is the 1.18 level, and a breakdown here would confirm a deeper correction.
🔼 For long positions, the 1.24 and 1.26 levels are suitable triggers.
📅 USDT.D Analysis
Now let’s analyze Tether dominance. The index has corrected to the 4.69 level.
☘️ If 4.69 is broken, the market could undergo a deeper correction toward 4.82. On the other hand, if the price gets rejected from this level, the likelihood of a move back down to 4.51 increases.
❌ Disclaimer ❌
Trading futures is highly risky and dangerous. If you're not an expert, these triggers may not be suitable for you. You should first learn risk and capital management. You can also use the educational content from this channel.
Finally, these triggers reflect my personal opinions on price action, and the market may move completely against this analysis. So, do your own research before opening any position.
ETH ANALYSE We have two key levels to watch on ETH:
- Either the price reacts upwards on the $2401 level in H4,
- Or it falls further and reacts at the $2,121 Daily level.
Either way, the fall should not last too long.

XRPWe are fixing to witness a run to $3 in a hurry.
New outlets, governments, banks, institutions, are all diving into crypto. An ounce of great news for XRP sends us moving up in a HURRY.
Have an exit strategy in place to take profits, and cycle some profits into other assets to continue to build your wealth.
Lock In.

Correction Imminent? Will Bitcoin Drop Or Continue Rising?As we can see here, Bitcoin is challenging resistance very close to the All-Time High. This is a price range. The highest Bitcoin was able to hit was $105,850, right below $106,000. Will Bitcoin drop now, even if short-term, or continue moving higher?
» Bitcoin will continue higher and produce a minimum of retrace.
Bitcoin is very likely staying above $100,000 and after some consolidation continue higher to hit a new All-Time High.
While Bitcoin moved above $100,000 on the 8th of May, there isn't any bearish pressure nor bearish momentum. The bears have no strength.
If there is selling happening, the bulls are more than ready and happy to buy everything up. Anyone and everyone selling now will simply lose their coins and miss a huge opportunity because Bitcoin is already growing and will continue to grow. It is normal to see some consolidation after a strong resistance level is hit. This resistance stands around $105K. Once this level breaks, we will see additional growth.
Bitcoin is bullish.
The market is bullish.
Any retraces are just an opportunity to buy-up, rebuy and reload. Do not sell your coins, hold strong. Hold easy or even buy more because Bitcoin is going up!
It can start growing right away, within hours or it can take a maximum of few days but the next major move is up. When Bitcoin starts going, it never looks back. The market will continue growing. Rest easy and buy more Altcoins.
Namaste.

BTCUSD; Heikin Ashi IdeaBINANCE:BTCUSD
Possible continuation at marked area, or we will have a correction to lower daily demand area where impulsive move started.

ETHUSD: First red day, day 2 on the backsideHello traders and welcome back on my profile, here is Gianni, and I hope you can enjoy this detailed analysis on ETHUSD.
As always, I don't use technical analysis for market prediction, because predicting is 50/50, but I use it to calculate my risk reward in case I would position myself in the market.
My general thesis for the day is pretty short, and following, the logic behind this thesis.
Monday, opening range of the week, established the current monthly high, breaking into the low of Friday (lower low) at the end of the day. Other time frames/big players might be in play and potentially the week can setup for a pump and dump.
Tuesday performed a strong pumping day, breaking through the Monday high and expanding the range higher, closing as well in breakout long.
Wednesday the market pretty much consolidated for the whole day, coming back inside the opening range high, and closing as first red day.
First red day is only a bearish signal, it doesn't mean that the market will drop certainly, but it gives you a signal the potentially long might be trapped in the wrong direction, increasing the chances of reversal, the day later or few more days later.
Today, Thursday, the market kept breaking lower, and it looks like coiling into the yesterday low of day, definitely a sign of weakness which I will keep in consideration.
8:30am and 8:40am NYT major red news are on schedule, I would not touch this market before that time, avoiding any possibility to be stuck in the trade.
How would I take this trade?
Simply I will be looking for any sell high opportunity after the news, reinforced with bearish price action, as triple tops, double tops and any kind of reversal patterns into the most recent high in place.
What about a long view?
Actually I'm not interested today, it can go higher, it can retest the weekly high, it can consolidate, it can do EVERYTHING, I don't care, my only focus is aligning my bearish thesis with a bearish setup.
I won't take in consideration any long opportunity for the day.
Overall, the market strongly pumped up during the previous week, I do not expect any crazy move, I do not think that this market trapped volume enough for a huge bearish collapse.
The potential opportunity of today, if presented, will be targeting the current weekly low (Monday low).
Stay tuned for further update during the NY session

