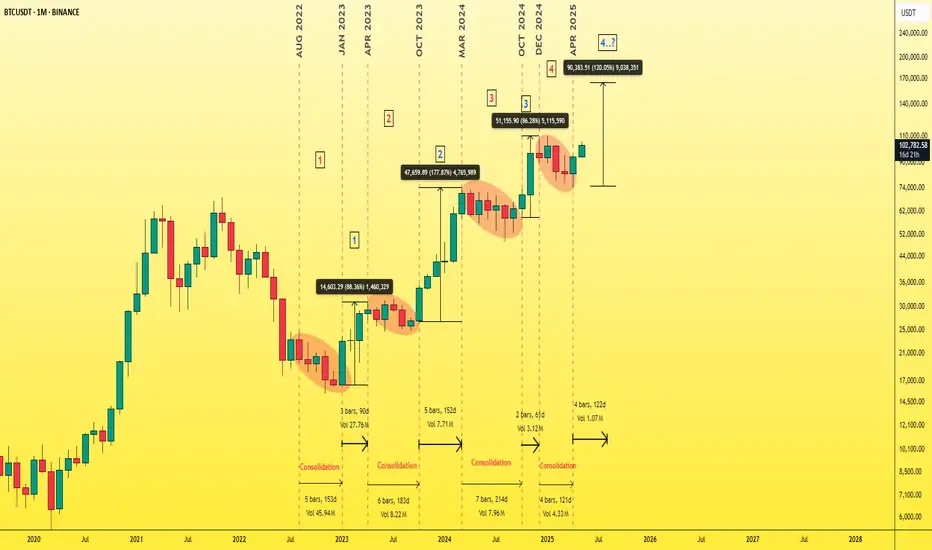
Bitcoin - An unusual chart!Over the past 3 years, I’ve noticed that Bitcoin has been moving in a consistently bullish pattern, as shown on the chart.
After breaking out of the red ellipse shape, Bitcoin tends to rally strongly—and that’s usually the signal for altcoins to follow. We’ve now broken out of this ellipse, and it looks like the real bullish move is just beginning.
In this chart, I’ve tried to illustrate both the potential upside ahead of us and the estimated timeframe in which this move could unfold.
I’ve divided the chart into segments from August 2022 to April 2025.
🔸The red numbers 1, 2, 3, 4 indicate periods of consolidation.
🔸The blue numbers 1, 2, 3, 4 represent strong Bitcoin and altcoin rallies that follow the breakouts.
While the exact percentage gains and time durations may vary, if we take the average, we can estimate the upcoming move to be around 120%, taking Bitcoin to around $165K.
Similarly, the average time duration for each bullish move has been approximately 120 days.
[b ]Welcome to the bull market.
Best Regards Ceciliones 🎯
Cryptomarket
Altcoins Market Consolidation until 19th May 2025Total3 (Altcoins market cap) is currently consolidating between $900b-$930b expected until 19th May 2025 before the market continue to climb, just as I pointed out in last week’s analysis. No need to worry, #Altcoinseason is already here. A healthy correction is better than none.


$WEN on $SOL. Possible bottomAppears NASDAQ:WEN may have double bottomed at the .786 retrace of the entire 1-5 wave count.
Accumulating between .00015-.0002
This is an accumulate and HODL. Spot only. Small size, this type of token should only be purchased with funds you are absolutely willing to lose a large % of.
This is key. It will make it it a lot easier to HODL no matter what.
The goal is to hodl until it pumps, period.
Will update upon pump
small size, spot, patience
😉 goodluck

Bitcoin - The Bottom Is In!Bitcoin ( CRYPTO:BTCUSD ) is reversing right now:
Click chart above to see the detailed analysis👆🏻
It was really just a matter of time until Bitcoin actually manages to create a potential short term and longer term bottom. With this monthly candle, bulls are taking over again and starting to buy cryptos quite heavily. The chart just tells us that this is not the end, but rather the continuation.
Levels to watch: $70.000, $300.000
Keep your long term vision,
Philip (BasicTrading)

BTC bull cycle comes to an end.We can see it clearly on the chart. BTC has ended the 5 waves pattern in Elliot wave count. you can see it on the chart, you can see it on the MACD & RSI.
What we are seeing now is that because of Greed & Hype no one is selling bitcoin. the up-trend we are seeing now is the result of no sellers and Hype Buyers. This is a bull trap. We can see the divergence clear as day. Stay alert and dont let them catch you this time.

TRUMPUSDTi Observed these Levels based on Price Action and Demand & Supply which is my own Concept "PENDAM CONCEPTS"... Please don't take any trades based on this chart/post... Because this chart is for educational purpose only not for Buy or Sell Recommendation... Thank Q

FARTCOIN Bearish Head and Shoulders – Testing Blue Support🚨 $FARTCOIN Bearish Head and Shoulders – Testing Blue Support 📉
$FARTCOIN has formed a bearish head and shoulders pattern and is now testing the blue support. There’s potential for a breakout, so we need to watch closely for any signs of further movement! 📊
Let’s monitor this closely! 💼💸

DOGE (Dogecoin)–Pullback Opportunity Amid Market-Wide ResistanceWith the total crypto market cap stalling at a major resistance zone, many altcoins — including DOGE — are due for a healthy retracement after recent strong moves. This sets up a potential buy-the-dip opportunity as DOGE returns to key support near $0.20.
🔹 Entry Zone:
$0.20 (next major support zone after recent rally)
🎯 Take Profit Targets:
🥇 $0.23 – $0.24
🥈 $0.30 – $0.31
🛑 Stop Loss:
Just below $0.18 (invalidates the support-based long idea)

Bitcoin is heading towards a new high.Bitcoin continues its upward trend, heading towards its highest peak ever, and a new peak is expected.

TradeCityPro | Bitcoin Daily Analysis #91👋 Welcome to TradeCity Pro!
Let’s dive into the Bitcoin and major crypto index analysis. As usual, I'll go over the key triggers for the New York futures session.
⏳1-Hour Timeframe
As you can see, Bitcoin made a bullish move yesterday after breaking above 102,882 and reached as high as 104,866.
✔️ After hitting 104,866, the price failed to break this resistance and got rejected, pulling back to retest 102,882 with a wick.
✨ As long as the price stays above 102,882, I consider the market momentum bullish. I still hold my long position opened around 85,000 and plan to open another one if we break 104,866.
📈 So the best long trigger is a clean breakout above 104,866. The next resistance is 106,247, which makes the 104,866 breakout a bit riskier due to proximity to that major supply zone.
🔽 For short setups, the first trigger is again 102,882. If the price forms a lower high below 104,866, a breakdown of 102,882 could justify a risky short.
📊 Personally, I’m not opening any shorts yet since higher timeframe trends are bullish. My first valid short trigger would be a breakdown of 101,628.
👑 BTC.D Analysis
Bitcoin dominance continues to fall and has now reached the 62.07 support level and is reacting to it.
💫 If 62.07 breaks, we could see another bearish leg down to 61.34.
🔼 For BTC.D to flip bullish, we first need to see the descending trendline break and then look for confirmation and a long trigger from that.
📅 Total2 Analysis
After breaking through 1.24, Total2 moved up to 1.26 and is now pulling back to retest 1.24.
🧩 If 1.24 holds and the price breaks above 1.26, there’s a strong chance it continues toward 1.31. This would confirm a long setup for altcoins.
🔔 For short positions, the only valid trigger for now is a breakdown of 1.18.
📅 USDT.D Analysis
Tether dominance faked a breakdown below 4.51 yesterday but has now bounced back above it.
💥 Currently, we should wait for the price to retest 4.51 again and reassess that support. If it breaks down cleanly, we’ll get confirmation of bearish momentum for USDT.D, which would support a bullish trend in the broader crypto market.
❌ Disclaimer ❌
Trading futures is highly risky and dangerous. If you're not an expert, these triggers may not be suitable for you. You should first learn risk and capital management. You can also use the educational content from this channel.
Finally, these triggers reflect my personal opinions on price action, and the market may move completely against this analysis. So, do your own research before opening any position.

If you're stuck, watch (full analysis)Hello friends
Given the high growth of this token, now that it has made a good correction, it makes sense to buy in stages and with capital management and move with it to the specified goals.
*Trade safely with us*

FXAN & Heikin Ashi Trade IdeaBINANCE:ETHUSD
In this video, I’ll be sharing my analysis of ETHUSD, using FXAN's proprietary algo indicators with my unique Heikin Ashi strategy. I’ll walk you through the reasoning behind my trade setup and highlight key areas where I’m anticipating potential opportunities.
I’m always happy to receive any feedback.
Like, share and comment! ❤️
Thank you for watching my videos! 🙏

TIA SIGNALSHello friends
As you can see, this currency has a beautiful chart and the technical analysis we did is that if the valid resistance is broken, we can open a buy trade with capital and risk management and move with it to the specified targets.
*Trade safely with us*

LITCOIN SIGNALSHello dears
You see that after a good growth, the price was in a range and then we had a decline until the support area was identified, which is also a good area and it was able to record a new ceiling, which is a good sign. Now the best and least risky thing is to buy steps.
We have identified the buying steps for you and the targets...
Note that this analysis is in daily time and may take a while, so if you are not patient, do not enter.
*Trade safely with us*

Having a Mini ALT pump -but it may not last much Longer -CAUTION
The main chart is the Daily BTC PA and the BTC DOMINANCE ( BTC.D ) super imposed below, for the same period.
When BTC.D Drops and BTC PA remains stable, we see ALTS increase in Value, Mostly.
On the main chart, you can see that in Nov 2024, Till Dec, we had a mini ALT seasons and we are having another now
But will this last ?
If we look in more detail at the BTC.D chart below, we can get some ideas
Will it Last ? I do not think so.
We are on two areas of strong support right now.
The 618 Fib extension has provided support already and PA bounced. In fact, at time of writing, Many ALTS are in the RED on an hour chart. We need to watch and see where we go in the next 7 hours
Should this Fib extension Fail, Just below is a longer term line of support.
SO, I would head towards a High rate of Caution with the ALTS right now.
Does this mean that Bitcon will push higher ?
The potential is there, YES
High Level of Caution for th eALTS right now

TradeCityPro | LINK: Eyeing Breakout as RSI Signals Divergence👋 to TradeCity Pro!
In this analysis, I’m going to review the LINK coin. This project is one of the well-known DeFi and Cross-Chain platforms, and it's considered one of the top projects in these categories.
🔍 The LINK token currently has a market cap of $627 million and holds a ranking on CoinMarketCap.
⏳ 4H Timeframe
As you can see, LINK has started a bullish leg, rising from $13.30 to $17.62. After a pullback that reached as low as $15.92, it has returned to test the previous high.
⚡️ If the $17.62 resistance is broken, the price could rally toward $19.42. Therefore, a breakout above $17.62 can be used as a long entry trigger.
📊 So far, volume has aligned well with the upward trend, and there are no signs of weakness from the volume perspective. However, if volume rises during a pullback or drops during a bullish move, it would signal a volume divergence, potentially indicating a trend reversal.
💥 Meanwhile, the RSI oscillator shows a bearish divergence. If RSI closes below the 50 level, this divergence would be confirmed, suggesting the possibility of a corrective move.
✨ To confirm a deeper correction or trend reversal, a breakdown below $15.92 would be significant. The next support after that lies at $15.22, with the main support far below at $13.30.
✔️ For short positions, I recommend waiting for clearer signs of trend reversal, such as volume divergence or confirmed RSI divergence. At the moment, there’s no solid short setup, and we need to wait for a suitable structure to develop.
📝 Final Thoughts
This analysis reflects our opinions and is not financial advice.
Share your thoughts in the comments, and don’t forget to share this analysis with your friends! ❤️

SUIUSDT; Heikin Ashi trade ideaBYBIT:SUIUSDT
Simple explanation on the chart. For any additional info's, you can let me know in the comments.
Thank you

SOLANA (SOL/USDT) – Bullish Flag Forming on 4H!Hey traders!
#SOLANA is currently consolidating sideways and printing a bullish flag pattern on the 4-hour timeframe – a classic continuation signal after a strong upward move! 🚀
Here's the plan:
Wait for a clean breakout above the flag's resistance
Enter on the retest of the breakout level to confirm support
Apply strict risk management and target the next major resistance zone
Watch for increasing volume to validate the move
Why this matters?
The bullish flag often leads to explosive moves when confirmed properly. Don’t chase the breakout — let price come to you. Patience = profits. 🧘♂️
Key Levels & Entry Plan marked on chart
Drop your thoughts below – do you agree with this setup or see it differently?
Like & Follow for more clean, no-hype trade ideas!
#Solana #SOL #CryptoTrading #BullishFlag #TradingView #TechnicalAnalysis #Altcoins #CryptoSetup #BreakoutTrade

Bio Protocol Short-Term (PP: 315%) —Trading vs InvestingFor some trades, we focus on the short-term. Lately, when the charts are young we are using them for the short-term signals. Rather than ignoring them completely, these tend to be hot and attract a lot of interest from market participants. We should also play.
BIOUSDT produced a bottom pattern here, notice the cup and handle. Enough to open a trade. Something like this: Buy and wait for the market to move in your direction (up). Set up your sell order on target before the target hits, normally after buying. When the target hits, the project in question will have disappeared from your portfolio, but you will see new funds in USDT (or BTC if you are trading a Bitcoin pair).
In short, buy and hold, the market takes care of the rest.
There are two targets on the chart, which one you choose is up to you. You can also choose both or none. By none I mean you keep holding long-term. While this is a short-term chart/trade setup, this does not cancel out the fact that we are entering the 2025 bull market cycle and phase. Which means that there is room for massive growth. By both I mean selling a portion at each target. Whatever you do is up you. I give you great entry prices and great timing. Also the analysis to remove any doubts when it is time to wait.
If prices drop you have two options:
1) Who cares? This option means that you keep on waiting until the market turns. The wait can last 1 day, 3 days just as it can last 1 week or 6 weeks or months. It depends on the broader market cycle.
2) After prices drop a certain pre-defined number, you close the trade; sell at a loss.
These are two options. Some people will buy and hold, others will decide to trade.
If you go with #2, you are trading.
If you go with #1, you are investing.
Thank you for reading.
Namaste.

Neiro: Your Altcoins Choice (S5)I am very curious as to why dogs became so famous within the Cryptocurrency market... It is very interesting. What is the relationship of dogs and this technology? Why dogs and not turtles or dragons? We know the cats went to videos but Crypto gets to enjoy man's best friend.
Neiro is good my dear friend very good just as you. Thanks a lot for your support.
I appreciate the time took out to comment and make this analysis request, I hope you are happy with the results.
NEIROUSDT is good, this is a solid chart.
This analysis is 100% based on the chart, technical analysis—TA.
The RSI looks pretty good on the bullish zone (above 50).
There is a bottom pattern in the form of a rounded bottom coming after a major downtrend. The action recovered above the 11-March low and the ensuing retrace was minimum which is a signal of strength.
The chart candles, the volume and indicators are telling me that an advance will happen next. The main move will be an up-move. Higher prices for sure. You can find targets mapped on the chart, it will be easy, it is high probability and it will be great.
Strategy? Buy and hold. But make sure to sell when prices are up do not become greedy. Enjoy the profits and move on. Opportunities are endless. You are good because you have good timing. Having good timing means that you are balanced in your life because you are looking at the market just at the right time. To be able to be here at the right time means that you are looking to win. Those that are looking to play will join when it is too late.
Timing is very important when trading because it removes all the complexities that come with joining a move when it is already underway. Buy and hold easy. NEIRO is set to grow in the coming weeks and months.
Thank you for reading.
Namaste.

ETH Testing Red Resistance – Breakout Potential!🚀 CRYPTOCAP:ETH Testing Red Resistance – Breakout Potential! 📈
CRYPTOCAP:ETH is currently testing the red resistance zone. If the price breaks through, the first target could be the green line level! 📊
Let’s watch this breakout unfold! 💼💸

PI Testing Red Resistance – Breakout Potential!🚀 NASDAQ:PI Testing Red Resistance – Breakout Potential! 📈
NASDAQ:PI is testing the red resistance zone again. If the price breaks through, the first target could be the green line level! 📊
Let’s watch this breakout unfold! 💼💸
