BTC NEXT MOVE?🚀 Bitcoin (BTC) Market Update
We are expecting a small dip in Bitcoin's price, potentially down to the 89,000–90,000 USD zone. From that level, we anticipate a strong rally toward 101,000 USD, as highlighted in the chart.
📈 This move could also lead Bitcoin toward making a new all-time high!
Stay patient and follow the setup carefully.
Cryptomarket

MOG Coin Testing Key Resistance – Breakout Ahead?🚀 TSXV:MOG Coin Testing Key Resistance – Breakout Ahead? 📈
TSXV:MOG Coin is currently testing the black resistance line. If the price breaks through, the first target could be the green line level. A clean breakout here could signal strong upward momentum. 📊
Let’s capitalize on this potential move! 💼💸

Bitcoin in wave 1 of larger 5th?COINBASE:BTCUSD seem to have started wave 5 up and currently in minor degree wave i of 5.Combined this with ACMI breadth oscillator which went below 30, it looks like cryptos might show some recovery from here.

TradeCityPro | Bitcoin Daily Analysis #85👋 Welcome to TradeCity Pro!
Let’s move on to the analysis of Bitcoin and key crypto indices. As usual in this analysis, I’ll review the futures triggers for the New York session.
📰 Yesterday, the U.S. interest rate decision came out, which remained unchanged and didn’t have much impact on the market—this was expected for some time. Now that the news had no real effect, the market can continue its previous trend.
⏳ 1-Hour Timeframe
As you can see in the 1-hour timeframe, after the news came out yesterday, the price ranged a bit and then moved upward, triggering the 97409 level. I hope you entered a position with that trigger because I had emphasized it strongly.
✔️ Currently, the price has reached the 99337 zone and is stabilizing above it. If this holds, the next resistance level is 101965.
💥 The RSI oscillator is also in the Overbuy zone, which is helping the price maintain its bullish momentum. There’s a resistance at 75.77 on the RSI, and if that breaks as well, we could see a very sharp move in the chart.
📊 Buy volume has been strong in this leg and aligns with the trend. If volume starts decreasing, divergence will appear, and we’ll get the first sign of trend weakness. Just remember—weakness doesn’t mean trend reversal.
📉 As for short positions, I think by now you know my trading style. In a market like this, where momentum is strongly bullish and price is breaking resistance one after another, I don’t think opening a short position makes sense. We should wait for proper structure to form before considering a short.
👑 BTC.D Analysis
Moving on to Bitcoin dominance—yesterday the 65.28 zone was broken and price moved up near the top of the channel, but then reversed and has now dropped to the midline of the channel.
🔑 Currently, the dominant trend is still bullish, but short-term momentum is bearish, and there’s a good chance it drops further to 64.91.
⚡️ Since the higher timeframes are still bullish, we could see bullish momentum return at any time. Technically, the 64.91 zone is the next major support.
📅 Total2 Analysis
Let’s look at Total2—finally, the 1.05 trigger was activated, and Total2 started moving upward. I had strongly emphasized this trigger as well, and I hope you took advantage of it.
🧩 Price has now reached the 1.07 level, and if that breaks, it could move up to 1.1.
🔼 If this bullish move turns out to be a fakeout, the next valid triggers for short positions are a break of 1.03 and then 1.01.
📅 USDT.D Analysis
Now to Tether dominance—this index also broke the 4.99 level and is now trending downward.
🔍 If this move continues, we could see a drop to around 4.82. That would allow the market to continue its upward movement even further.
❌ Disclaimer ❌
Trading futures is highly risky and dangerous. If you're not an expert, these triggers may not be suitable for you. You should first learn risk and capital management. You can also use the educational content from this channel.
Finally, these triggers reflect my personal opinions on price action, and the market may move completely against this analysis. So, do your own research before opening any position.

TradeCityPro | HYPE: Bullish Momentum Builds Near Resistance👋 Welcome to TradeCity Pro!
In this analysis, I’m going to review the HYPE coin for you. The Hyperliquid project is one of the DEX projects in the crypto space that also functions as a Derivatives platform, and it currently holds the highest 24-hour volume among all DEXs.
🔍 The token for this project, with the symbol HYPE, has a market cap of $7.23 billion and is ranked 20th on CoinMarketCap.
⏳ 4-Hour Timeframe
In the 4-hour timeframe, as you can see, this coin is in an uptrend with an ascending trendline, and it’s currently encountering resistance at 21.48.
📈 If the price stabilizes above this zone, a new bullish wave can begin, with the next resistance being at 22.799.
✔️ You can enter a long position using the 21.48 breakout trigger. Buying volume has increased significantly, which raises the chances of this level breaking.
📊 For short positions and a potential bearish trend in this coin, the first trigger would be a rejection from the 21.48 resistance. If the price gets rejected at this level, the likelihood of breaking the trendline increases.
⭐ A break of the trendline itself can also serve as a trigger. Breaking this trendline would eliminate bullish momentum in the market, and a breakdown below the 39.29 level on the RSI would further support bearish momentum.
🔽 The main short position can be opened upon breaking the 19.552 level. This is a very strong support, and if the price closes below it, it could drop further to 17.88.
👀 Overall, the long setup on this coin looks quite logical, and if the 4-hour candle closes as is and doesn’t turn out to be a fakeout, it could be a great entry opportunity.
📝 Final Thoughts
This analysis reflects our opinions and is not financial advice.
Share your thoughts in the comments, and don’t forget to share this analysis with your friends! ❤️

Moonriver Short-Term Boom 128% PP & 390% Mid-Term (You Choose)I am sharing Moonriver as a short-term trade setup but this doesn't invalidate the long-term potential. It will grow strong with the rest of the market but here is a fast target.
A "fast target" based on the fact that we have a bullish flag on the chart. The bull-flag is a continuation signal which means higher prices in the coming weeks and days.
Now, remember, the market can change course but if this happens the bullish bias is not invalidated rather we wait. If prices move down first before additional growth this is nothing other than some noise, a market shakeout before additional growth.
The bias is bullish, the signals are bullish and this means we are going up.
The main target for the short-term is a nice double-up. Whatever money you put in it can more than double if-when the target hits.
If there is a drop support will be found at the 3-Feb or 11-March low support. I am not betting on the low, but we need to be prepared.
Aim high, you got this. This is another easy chart. Remember Kaito?
Oh yes... We are bullish now and this is only the start.
The entire Cryptocurrency market will be extremely bullish by late May.
Prediction confirmed, success.
Thank you for reading.
Namaste.

BTC LIMITHello friends
Due to the price drop, we can buy in the price drop and move with it to the specified targets, of course with capital and risk management.
*Trade safely with us*

BUY MARKET!!!Hello dears
If you are risk-averse, this analysis is for you...
Given the decline we had, you can see that the price was supported within the specified support range and a range was formed that can be purchased with risk and capital management and moved to the specified ranges...
*Trade safely with us*

PEPE BUY ...Hello friends
Due to the price drop, good conditions have been created to buy with risk and capital management and move towards the specified goals...
If you are risk-averse, this signal is for you...
*Trade safely with us*

SUI – Long Trade Setup After Trend ReversalSUI has broken out of its downtrend, hitting all prior upside targets and now pulling back toward a key support area and the 200-day EMA, potentially forming a higher low—an ideal spot for re-entry.
🔹 Entry Zone:
Around $2.80
🎯 Take Profit Targets:
🥇 $3.40 – $3.60
🥈 $4.00 – $4.20
🥉 $5.00 – $5.20
🛑 Stop Loss:
Daily close below $2.20
📌 Strategy Notes:
Look for bullish confirmation (e.g., wick rejections, bullish engulfing candle) near $2.80
Structure remains intact as long as price holds above $2.20
EMA retests often precede strong continuation if trend strength remains
Futures on CME and Launch of XpFinance DeFi PlatformOn May 7, 2025, the XRP ecosystem received two major developments that signal a new chapter in its evolution. First, the Chicago Mercantile Exchange (CME) announced the launch of futures contracts for XRP. Shortly thereafter, developers behind the XRP Ledger unveiled XpFinance — the first non-custodial lending platform built on the network. These two events are poised to reshape XRP's market perception and could attract a wave of new investment.
XRP Futures on CME: A Leap Toward Institutional Adoption
Set to go live on May 19, the new CME product will enable investors to trade XRP through regulated futures contracts. This is a major milestone. With similar contracts already in place for Bitcoin and Ethereum, XRP becomes the third digital asset to gain such legitimacy in institutional markets.
The introduction of futures means greater liquidity, risk management tools, and a clear path for hedge funds, pension managers, and banks to engage with XRP — without needing to custody the underlying token directly. Analysts anticipate that this added market structure could drive up demand, especially if the rollout is smooth and met with trading interest.
XpFinance and the XPF Token: DeFi Comes to XRP Ledger
The second big announcement came from XpFinance, a new decentralized lending protocol. What sets it apart is its non-custodial model — users can lend assets and earn interest while retaining full control of their private keys. At a time when centralized platforms are under scrutiny, this approach appeals to security-conscious users.
XpFinance is powered by a new token, XPF, which will be used for staking rewards, fee payments, and governance. The pre-sale of XPF has already begun and is generating buzz, especially among XRP community members eager to participate in the first major DeFi initiative on the ledger.
Market Outlook and Analyst Forecasts
Reactions from analysts have been positive. According to a report from DigitalMetrics, if both the CME futures and XpFinance platforms gain traction, XRP could see a sharp upward move — potentially reaching $10 by summer 2025. That would represent a fourfold increase from its current price.
However, risks remain. Ripple Labs continues to face regulatory pressure in the U.S., and crypto markets overall remain volatile. Still, the general tone has shifted. With increasing institutional interest and expanding utility, XRP appears to be entering a new phase of growth.
Conclusion
The combination of institutional infrastructure and decentralized finance innovation makes May 2025 a pivotal moment for XRP. If these initiatives succeed, XRP could transition from a mid-cap altcoin to a primary digital asset in the eyes of both institutional investors and the broader crypto community. Whether this momentum will translate into long-term market dominance remains to be seen — but the foundation is clearly being laid.

Bitcoin Parabolic Curve - 2022 to 2026 Market CycleThis line chart shows the current Bitcoin market cycle from the bear market bottom in November 2022. As you can see, the price has formed a parabolic curve, which was violated around the beginning of March. A couple of weeks later, there was a retest of the curve, which was rejected. The price of BTC has since returned to the bottom side of the curve and is following it upwards.
I am also watching the Bitcoin monthly chart and, more specifically, the monthly Stochastic RSI indicator. As you can see in the chart below, between the second and third months after the market cycle peak, the Stochastic RSI indicator has always dropped below the "20" level, and was near zero at the close of the third month.
There was some speculation that the new all-time high set on January 20th at just over $109k was the peak for this market cycle. At the beginning of April, the Stochastic RSI dropped well below the 20 level but rebounded and was at 16.81 when the April candle closed. One week into May, the Stochastic RSI has pushed back above the 20 level and currently sits at 26.38.
I am still keeping an open mind, but if the high set on January 20th were the market cycle peak, based on past history, I would have expected the Stochastic RSI to have been much lower at the close of April. If the May candle closes with the Stochastic RSI above the 20 level, it will give me much more confidence that Bitcoin has not peaked for this market cycle.
My assumption for now is that Bitcoin is still following a 4-year market cycle. If this is true, I would expect a market cycle peak sometime in the final months of this year. Either way, it has been a very interesting market cycle with huge changes for the crypto asset class.

Bitcoin Dominance - the two scenarios!Bitcoin dominance continues to rise after breaking out of a rising wedge pattern on the weekly chart. It has now also broken through the 0.786 Fibonacci level.
Next stop is Rectangle 1, where Bitcoin dominance is expected to reach 68% — and most likely, this will mark the top of dominance before it starts to drop, triggering a historic altcoin season.
Scenario 2:
Dominance keeps pushing higher toward Rectangle 2, potentially surpassing 70%. At that point, many altcoins may form new lows, and weak projects could get wiped out.
Fear in the market will hit extreme levels —
but that could signal the beginning of an altseason and the collapse of BTC dominance.
Best regards Ceciliones 🎯

RDNT/USDT 4H Chart: Inverted Head and Shoulders? Hey traders! Let’s dive into this 4-hour RDNTUSDT chart.
Radient Capital is setting up a classic pattern that could signal a big move!
We’re seeing an inverted head and shoulders forming, with the price breaking above the resistance of Wedge around $0.2290. The "head" bottomed out near $0.1590, with the shoulders forming at higher lows.
If this pattern plays out, we could see a bullish surge targeting $0.2650 and higher!
However, if the breakout fails, we might see a pullback to the shoulder low at $0.2160 or even the support at $0.1974.
Key Levels to Watch:
Resistance: $0.2650
Support: $0.2160 (shoulder)
Breakout Target: $0.2650+
Breakdown Risk: $0.1974
Is RDNT ready to soar, or will this breakout fail? Drop your thoughts below!

BTCUSDTHello Traders! 👋
What are your thoughts on BITCOIN?
Bitcoin is currently testing a major resistance zone between $98,000 and $100,000, which also aligns with the 0.707 Fibonacci retracement. This area has previously acted as a strong supply zone, raising the possibility of a short-term rejection.
Scenario 1 – Bullish Breakout:
If price breaks and closes above $100,000, we could see a strong continuation toward $106,000 → $112,000, driven by momentum and possible FOMO.
Scenario 2 – Deeper Pullback Before Continuation:
If Bitcoin gets rejected at resistance, a retest of the lower support zone (previous demand area) may follow.
A successful bounce from that support could reignite bullish momentum in the medium term.
Trading Strategy:
Wait for a confirmed breakout and candle close above $100K for a high-conviction long entry.
Alternatively, look for buy setups on a pullback toward the support zone for a better risk-reward entry.
How are you planning to trade this setup? Breakout or dip-buy? Share your strategy below! 👇
Don’t forget to like and share your thoughts in the comments! ❤️

TradeCityPro | Bitcoin Daily Analysis #84👋 Welcome to TradeCity Pro!
Let’s dive into the analysis of Bitcoin and major crypto indices. As usual, I’m going to review the New York futures session triggers for you.
⏳ 1-Hour Timeframe
As you can see in the 1-hour timeframe, yesterday after news of tensions between India and Pakistan, Bitcoin moved upward and made a sharp rally to the 97409 zone, returning once again to this high.
📰 This news created fear in the market, and the buying that occurred was driven by fear and news impact. In my opinion, this bullish leg won’t be sustainable in the long term unless the price stabilizes above the 97409 level and starts a new upward leg.
✨ If the 97409 level is broken, we can enter a long position since it aligns with the current bullish trend, and we can position ourselves for the breakout with a wide stop-loss.
✔️ But make sure your stop-loss is wide and placed below the market’s main support because a significant resistance is being broken, and there's a high chance of volatility before the market actually moves upward. A tight stop-loss may get triggered before the actual rally begins.
💥 A momentum confirmation for today’s long position could be RSI entering the Overbuy zone, and if that happens, the chances of breaking 97409 increase significantly.
📉 For a short position, we should wait and see how the news impact plays out in the market. If it turns out to be driven by FOMO, naturally in the next few days, the price may move back down, and we could enter short positions on breaks of levels like 95370 or 93626.
👑 BTC.D Analysis
Let’s move to Bitcoin Dominance. Yesterday, dominance stabilized above the 64.91 level and managed to move up to 65.25.
🎲 Currently, Bitcoin is a much better option for long positions since dominance is rising, and even breaking 65.28 would confirm another bullish leg in dominance, potentially pushing it toward the top of the channel.
📅 Total2 Analysis
Let’s analyze Total2. Yesterday, this index faked a breakdown below 1.01 and simultaneously moved upward with the news, now reaching the 1.03 zone. A break of this zone could confirm a bullish move toward 1.05.
⭐ The main trigger for a long position remains the break of 1.05, and I strongly recommend being positioned if that level is broken.
🔽 For a short position, you can still enter on a break of 1.01 — I still think it’s a valid trigger.
📅 USDT.D Analysis
Now for USDT Dominance: yesterday, this index also faked a move above the 5.20 level and has since dropped to 5.04.
💫 Activation of the 5.04 trigger could be confirmation for a long position and a sign of USDT dominance starting to decline. The main trigger remains the break of the 4.99 bottom.
❌ Disclaimer ❌
Trading futures is highly risky and dangerous. If you're not an expert, these triggers may not be suitable for you. You should first learn risk and capital management. You can also use the educational content from this channel.
Finally, these triggers reflect my personal opinions on price action, and the market may move completely against this analysis. So, do your own research before opening any position.

Bitcoin Cash, 200% In 3 WeeksThis is my idea, Bitcoin Cash will grow some 100-200% within the next 2-3 weeks, what do you think?
Sounds-looks possible?
It would have to be a very strong rise but I think it is possible maybe a bit longer but for higher prices.
The first target here for a long-term higher high and the higher in years sits at $993. The next target is $1,439. The All-Time High is $1,650 and we know there will be a new All-Time High in 2025.
So maybe 200% in two weeks is too much for Bitcoin Cash because it is too big, but this based only on left brain logical thinking. Bitcoin Cash can grow 200% in the coming weeks. 2-3 weeks. It can happen fast and then after a strong retrace additional but long-term growth. Makes sense?
It can happen. Cryptocurrency is wild and while it has been slow for years that's only because these were the years of slow. When it goes fast it is the time of being fast and all can happen in a flash. By the time we try to act or react it is already too late and the action has gone off the chart.
It is a guess, a prediction. I don't know if it will grow 200%, 300% or 500% but I know for certain it will be going up.
The consolidation period is over. This week is the fifth week since the correction low.
The market is bullish now and the next advance will produce the highest prices since November 2021.
It will be easy for Bitcoin Cash to grow by 200%. A new All-Time High will be very interesting, it's been so long.
Are you ready for what the market is preparing?
I hope you are.
Namaste.

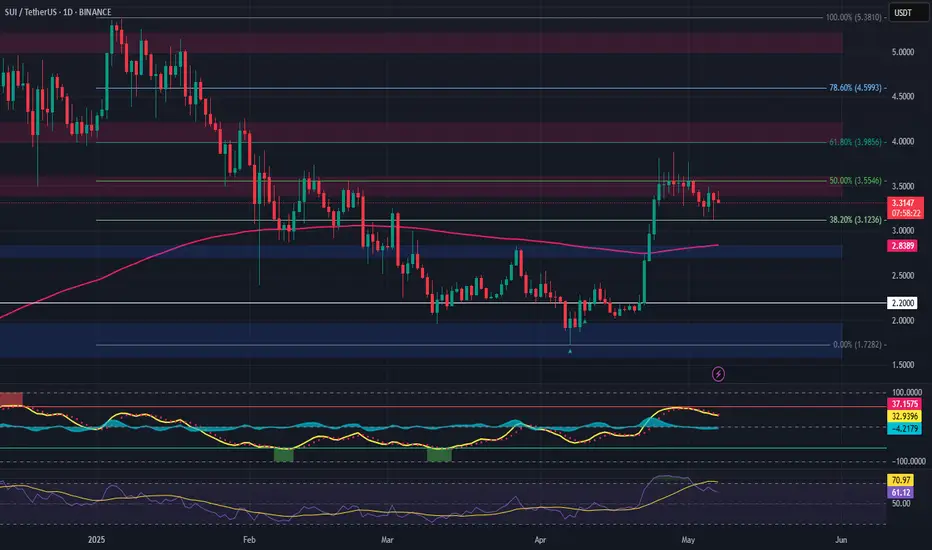
TradeCityPro | SUI: Bullish Push Faces Key Resistance Test👋 Welcome to TradeCity Pro!
In this analysis, I want to review the SUI coin for you. It's one of the DeFi layer-1 projects that was highly hyped in 2024 and has recently gained renewed attention due to some news from the project.
🔍 This project's coin, with the symbol SUI, has reached a market cap of $11.3 billion, ranking it 11th on CoinMarketCap.
📅 Daily Timeframe
As you can see in the daily timeframe, since the last analysis I shared in this channel, the price has rebounded from the support zone I highlighted and, after breaking the trendline, made a bullish leg up to 3.6402.
📊 A significant amount of buying volume has entered the market, and the RSI has entered Overbuy territory. These two factors drove the bullish move, and the 3.6402 resistance is a key level that has temporarily held off further price increases.
✔️ Currently, we’re seeing a few corrective candles that caused the price to reject from this resistance, but it's holding up well and still looks poised to move back toward this level.
🛒 For spot buying, if the price moves back toward this area, you can enter a position on a break of 3.6402. The next trigger is the break of 4.0866, and the main resistance ahead is 5.2689.
🔽 If a correction occurs, support levels are 2.7830 and 2.2495. If price retraces, these can serve either as short targets or long entry zones depending on the price reaction.
📉 Confirmation of trend reversal would come if the price fails to make a higher high above 3.6402 and breaks the current low. After that, we can consider opening a short position.
📝 Final Thoughts
This analysis reflects our opinions and is not financial advice.
Share your thoughts in the comments, and don’t forget to share this analysis with your friends! ❤️

BITCOIN UPDATE TOTALLY BULISHSO
correction endedearlier, now is totally up
Buy Level @ 96.400
Targets @ 98.400 / 99.400 / 101.800 / 106.600 and Further

Bitcoin Moving Averages: Back To BasicsBitcoin today is trading safely above the long-term SMA200 moving average on the daily timeframe. This is a major signal. The break above this level happened 22-April with a huge green candle. This event marks the confirmation of the next major advance. While Bitcoin was trading below SMA200 daily, black line on the chart, there was still space for doubt. Once the action moved above this indicator, the bullish bias is confirmed.
Bitcoin is also trading daily above EMA8/13/21 & 34 which are moving averages to gauge the short-term potential of an asset.
Then we have EMA55 and EMA89 which is used to measure mid-term potential. Once Bitcoin trades above EMA55 daily, we can say that mid-term growth potential is now active. 1-3 months. Once the action moves above EMA89, this potential is fully confirmed.
Finally, I track also EMA233 and EMA377, very long-term and Bitcoin trades above these as well. These are in the same range as SMA200.
Bitcoin is ultra-bullish right now and set to produce additional growth.
Remember that the MACD and RSI are also flashing bullish signals across all timeframes. Also basic.
All the technicals are 100% bullish.
Thanks a lot for your continued support.
Bitcoin (and the Altcoins) is going up.
P.S. The green action today allows for volatility tomorrow without hurting any of the bullish technicals. So bullish it is impossible to miss. The fifth consecutive week green.
Namaste.

Lumia & The Altcoins Market —Cryptocurrency & The FedToday LUMIAUSDT is producing an advance, a bullish continuation, after a higher low. This is based on today's full green candle coupled with high volume.
Many other projects are producing strong green candles today, two to three digits green. This is happening while Bitcoin and the top projects trade sideways. What does it mean?
It means that we are bullish—bullish confirmed.
It means that the market will continue growing in the coming days and weeks.
It means that the recent retrace will not be extended nor become strong.
It means that the weak bearish action we saw in the past few days is all the bear action we will get.
It means that whatever happens with the Fed tomorrow, Cryptocurrency will respond in a positive way.
Now, short-term there can be volatility as professional traders take advantage of any and all opportunities to shakeout beginners. Regardless of the outcome of the political event, its effect on the market, volatility at first can be wild.
Continuing, technical analysis is king.
The market is bullish, Bitcoin is bullish and the Altcoins are bullish. This means that the results from the Fed meeting will be something positive for the market. Whatever it is that is interpreted as bullish, that will be the result. Why? Because everything will grow.
The market has been growing since 7-April, an entire month and by late May 2025 everything will be up 200%-300% from its correction bottom and low.
Lumia is not the only example, many pairs are already breaking green today. Since these are smaller than Bitcoin, and the other giants, they can easily move ahead of the pack and that is exactly what is happening.
Thanks a lot for your continued support.
Namaste.

PENGUUSDTA risky analysis of a popular meme coin..
Based on this analysis, we are in wave 4 and it is expected to end soon and enter wave 5..
Around 0.091 to 0.085, if the price reaches it, it will be suitable for a short swing to the target of 0.0163 and 0.0175..
Ideal time zones are also marked with low tolerance..
This analysis can be easily filled..

XRP on the Brink: Hold $2.11 or Break to $2.36+? Massive move incoming — if XRP holds $2.11, $2.19 is next. Break that and we could hit $2.36 before the real moonshot. But drop below $2.11? Expect a test of $2.00 before a rebound to $2.30+.
Kris/Mindbloome Exchange
Trade Smarter Live Better
