FORM/USDT Analysis: ATH Incoming
This token has just tested its all-time high on Binance.
During the price increase, we spotted a strong volume zone between $2.48–$2.42, where the market is currently trading.
We are considering a long position targeting a new ATH.
This publication is not financial advice.
Cryptomarket

Bitcoin Stabilizes at $94,000 — What's Next?Following a strong rally in early 2025, Bitcoin is now showing signs of stabilization, hovering around the $94,000 mark. For a notoriously volatile asset, this steady price movement might seem unusual. However, this calm may be the calm before the storm—either a breakout or a pullback. So, what’s behind this current phase of Bitcoin’s price?
Firstly, all eyes are on the U.S. Federal Reserve. Investors are nervously anticipating its next interest rate decision. As always, monetary policy acts as a major catalyst for risk assets. A rate cut could boost inflows into the crypto market, while a hike might lead to capital outflows and dampen sentiment.
Secondly, retail investor activity appears to be cooling. Trading volumes have declined compared to the high levels seen in February and March, when the market was filled with euphoria. Now, we are witnessing a period of cautious waiting. The "Fear and Greed Index" reflects this, hovering around neutral territory, indicating market indecision.
From a technical standpoint, analysts identify two key levels: strong resistance near $100,000 and a support zone around $90,000. As long as Bitcoin remains within this range, short-term traders are operating in a sideways market while longer-term investors remain on standby.
Beyond macroeconomic factors, crypto-specific developments will also influence BTC’s price. Important upcoming events—such as Ethereum’s upgrade, potential regulatory changes in the UK and Japan, and global crypto conferences—could all act as catalysts.
Institutional investors are another major factor. Companies like MicroStrategy continue to accumulate Bitcoin, adding confidence to the asset’s long-term outlook. If more institutions follow suit, Bitcoin could see increased demand and stronger bullish momentum.
In the near term, market participants are advised to stay cautious. Bitcoin may continue consolidating until a clear macro or market-specific catalyst emerges.
All in all, $94,000 is more than just a number. It represents a temporary equilibrium of forces—bullish and bearish. The question is not whether Bitcoin will move again, but when and in which direction.

TradeCityPro | Bitcoin Daily Analysis #83👋 Welcome to TradeCity Pro!
Let’s dive into the Bitcoin analysis and key crypto indices. As usual, I want to review the triggers for the New York futures session.
🔍 Today, I’ll provide the analysis in the 4-hour timeframe, since not much has changed on the 1-hour chart compared to yesterday, and it's better to take a slightly longer-term look at the chart.
⏳ 4-Hour Timeframe
As you can see in the 4-hour chart, we have an upward leg that started from the 84,000 zone and extended to 97,108. Currently, it's ranging between 93,626 and 95,370.
✔️ The main market top lies at 97,108, but the price has formed a range slightly lower, with 93,626 acting as support.
⚡️ There's a strong divergence visible in the RSI — while Bitcoin has formed three consecutive higher highs, RSI has printed lower highs. This divergence was activated when RSI broke below 50, and the price corrected to 93,626.
📊 In my opinion, the market has now digested the divergence, but the impact it had was a correction down to this level. If 93,626 breaks, deeper corrections could follow.
✨ The 93,626 zone overlaps with the 0.236 Fibonacci retracement and forms a PRZ. If this level breaks, we can open a short position. I open this kind of trade in lower timeframes as a scalp and take quick profits, since it’s counter-trend.
🔽 The maximum short-term target I expect for this trade is the 91,945 area. It's possible that the price corrects further or even reverses trend, but it's not logical in my strategy to hold these kinds of trades longer.
🔑 The key supports ahead are 91,945 (which overlaps with 0.382 Fibonacci), and further down are the 0.5 and 0.618 Fibonacci levels.
📈 For a long position, breaking 95,370 is currently the best trigger. You can also enter on a break of 97,139, but there's strong resistance at 98,828 that could halt the upward move.
🔼 If the price corrects and reaches 91,945, you can consider a long entry based on the price’s reaction to the supports I mentioned.
👑 BTC.D Analysis
Let’s move on to Bitcoin dominance. On the 4-hour chart, there’s an ascending channel where price is moving, with multiple touches. Right now, it’s testing resistance at 64.91.
☘️ If this level breaks, dominance could move up to the top of the channel. There’s also a very important static resistance at 65.59. If price reaches this area, we need to watch its reaction.
📅 Total2 Analysis
Now onto Total2. Similar to Bitcoin, it had a bullish leg, but corrected more deeply — down to the 0.382 Fibonacci retracement, and now it’s at the 1.01T support.
⭐ If this zone breaks, the next supports are at the 0.5 and 0.618 Fibonacci levels. There’s also a strong support at 980B, and the major bottom is at 932B.
📉 For a short position, breaking 1.01T is suitable. For a long position, a bullish reaction from this same area is a good trigger. The main long trigger is the break of 1.05T.
📅 USDT.D Analysis
Let’s move to Tether dominance. This indicator has reached a major top at 5.19. If this level breaks, it can move upward.
👀 If it breaks, the next resistance is 5.37. This move would coincide with a market correction or drop.
📊 To confirm a bearish Tether dominance (bullish market), rejection from 5.19 is a good trigger. The main trigger is still the break of 4.99.
❌ Disclaimer ❌
Trading futures is highly risky and dangerous. If you're not an expert, these triggers may not be suitable for you. You should first learn risk and capital management. You can also use the educational content from this channel.
Finally, these triggers reflect my personal opinions on price action, and the market may move completely against this analysis. So, do your own research before opening any position.

TradeCityPro | SAND: Critical Support Test After Pullback👋 Welcome to TradeCity Pro!
In this analysis, I want to review the SAND coin for you. It’s one of the most popular Metaverse projects, widely recognized and among the top in its category.
✔️ This project’s coin currently holds a market cap of $693 million and ranks 91st on CoinMarketCap.
⏳ 4-Hour Timeframe
As you can see on the 4H chart, after a bullish leg that pushed the price up to 0.3140, a correction phase began. Following the break of 0.2903, the price has now corrected down to 0.2714.
🔍 If this 0.2714 level breaks, the price could continue down to the support at 0.2437 — so a break below 0.2714 would be a valid short entry.
👀 Personally, I prefer waiting for the price to first bounce off 0.2714, move upward, and print a lower high relative to 0.2903, then break 0.2714 on a second attempt. In that case, the short setup becomes much more reliable.
🔽 That said, even if the level breaks now without a bounce — since RSI is already near the oversold zone — I’ll still open a short. If RSI enters oversold, it could lead to a sharp drop.
⚡️ One negative factor for short positions is that volume has been decreasing since the price started correcting from 0.3140, which isn't a good signal for further downside — there’s a divergence between price and volume.
📈 However, that’s a positive signal for potential long positions. When volume drops during a correction in an uptrend, it shows buyers still have control. As long as this divergence persists, the uptrend is more likely to continue than to reverse.
📊 For long positions, if buying volume enters the market and the price holds above 0.2714, you can enter based on lower-timeframe structure breaks. The main long entry will be confirmed once the price breaks above the 0.3140 high.
📝 Final Thoughts
This analysis reflects our opinions and is not financial advice.
Share your thoughts in the comments, and don’t forget to share this analysis with your friends! ❤️

KASPER - THE GHOAST OF KASPA (TA + TRADE PLAN) BY BLAŽ FABJANTechnical Analysis for KASPER (KASPER/USDT) by Blaž Fabjan
Trend Analysis:
The chart indicates a rising wedge pattern on the horizon, a bearish reversal signal, which suggests a potential downward price movement after the completion of the pattern.
The price is currently in a consolidation phase, with a series of lower highs and higher lows within the wedge structure.
Support and Resistance Levels:
Resistance: The price has approached a resistance zone around the Wick High level, which indicates selling pressure in this area. A breakout above this resistance level could lead to a continuation of the upward trend.
Support: The Strong Low zone is acting as the lower support for the current price action, with buyers attempting to defend this level.
Indicators:
RSI (Relative Strength Index): Currently at 82.43, which is in the overbought territory, indicating that the asset may be overextended and susceptible to a pullback or correction.
MFI (Money Flow Index): The current MFI reading suggests an inflow of capital into the asset, indicating that the buying pressure is strong. However, if the price hits the overbought region, it could signal a reversal.
Stochastic: The stochastic oscillator is at 96.19, indicating that the price is in an overbought condition and might be due for a pullback or consolidation in the short term.
VMC Cipher B Divergences: The indicator is showing bullish divergence at the recent lows, suggesting that buying pressure could continue, but it needs to be validated by a breakout above resistance.
Volume:
The volume is gradually increasing, which is a positive sign for the continuation of the trend. However, volume spikes during a breakout are crucial to confirm the trend's strength.
Trading Plan for KASPER (KASPER/USDT)
Key Entry Levels:
Breakout Entry: If the price breaks above the resistance zone near 0.00001000, consider entering a long position. Set the take profit target at around 0.00001500 (strong bullish continuation level) for a potential 50% price increase.
Reversal Entry: If the price fails to break the resistance and starts falling towards the Strong Low support level near 0.00000500, consider entering a short position. A move below the Strong Low could signal a reversal of the current uptrend.
Stop-Loss and Risk Management:
Long Position Stop-Loss: Set a stop-loss just below the Strong Low (around 0.00000450) to protect from a sudden price drop. The stop should be tight as this asset is volatile.
Short Position Stop-Loss: If entering a short position, place the stop-loss above the resistance level at 0.00001050 to minimize losses in case of a breakout.
Target Levels:
Short-Term Target (Bullish): If the breakout occurs, consider targeting a price of 0.00001500 based on the rising wedge pattern's projected price target.
Short-Term Target (Bearish): If the asset fails to hold above the support zone and breaks lower, target the 0.00000350 level as the next potential support area.
Trading Psychology:
Patience: This is a volatile asset, and it's important to wait for clear confirmation of a breakout or breakdown before entering the trade.
Risk-Reward Ratio: Aim for a 1:3 risk-reward ratio, which ensures you are risking less compared to the potential reward on each trade.
Monitor Indicators: Regularly monitor the RSI, Stochastic, and MFI for overbought or oversold signals. Additionally, follow volume patterns closely to gauge market momentum.
Exit Strategy:
Exit the position once price targets are reached or if indicators show signs of an exhaustion or trend reversal (e.g., RSI turning downward from overbought levels, stochastic crossing down).
Given the current chart formation and technical indicators, KASPER could be poised for a breakout to the upside, but there is a high risk of a correction given the overbought conditions.
Caution is recommended: monitor price action closely and adjust your strategy accordingly to avoid entering too early in a rising wedge or an overbought market.

Chainlink Trend update on 06/May/2025Chainlink market update on 06/May/2025. Currently, it break 13.8$ and keep our eye to see whether it touch 12.8$ zone and reverse or not.
#Chainlink #Defi

TRUMP: Advanced Trading Strategy For 6,666% Instant ProfitsThe higher low is in and support is being confirmed now as I write this; patience is key.
It is a waiting game. This whole trading experience, venture or adventure... It is all a waiting game.
The better you get at waiting the best you can do.
You see, when the market is bland, boring and sideways this can last for a long while. When the market starts crashing or rising everything can happen within a day.
In order to catch the rise, we have to be in and ready to wait.
In order to avoid the crash, we have to set our sell orders on target before the rise takes place. Something like buying in, setting the orders high up (never stop-loss) and then waiting for the market to take care of the rest.
I know it can be boring sometimes and at other times doubt can even creep up. This is not bad nor is there anything wrong with you if this happens, this is normal but you shouldn't worry if you are ready to hold.
The market can go up slowly for 3 months and you wouldn't mind the fact that it is growing if the price moves from $10 to $13 in three months. Then on the fourth month, there is an advance from $13 to $50 and wow!
But if the market drops slowly from $10 to $7 within 3 months we start to become anxious and scared, why? Then, on the fourth month there is an advance from $7 to $50 and wow!
You see? It is all psychological you know. When the market was rising slowly, there was no difference, no secured profits and yet you didn't mind having to wait. But when the market moves lower, you might want to secure a losing trade.
Both the up and the down produce $$$ changes on paper only, nothing changes when it comes to the amount of coins you bought and hold.
If the coins are going to be worth more down the road, six months from now, say, 500% more; this should be an easy hold.
Ignore the short-term, ignore the noise hold strong.
You can do it and you are doing it, for doing this you will be paid and when you get paid you will be happy with the results.
I should give you my strategy once more: Buy and hold.
Thanks a lot for your continued support.
Bitcoin and the Altcoins market is set to grow really, really strong in the coming months.
Just be prepared to wait, it will be worth every day, every minute every second once you get your reward.
Actually, I like to wait. I can study and exercise—prepare—while the market goes through its consolidation phase. I can plan.
Once the new high—All-Time High—is in and the bullish wave is over, I will be prepared to pocket huge profits because I planning and studying today.
Thank you for reading.
Namaste.

Bitcoin Ultra-Bullish Now! Ignore Short-Term Noise, Focus!Very important right now to stay focused and true to your commitment of holding Bitcoin (Crypto-Altcoins) long-term. It is very important because a major rise is in the making and letting go of your position now can be detrimental to your success.
Did you notice, Bitcoin has not produced three consecutive days red since the 7-April market bottom and low. Very interesting. When Bitcoin was coming down, it produced many three days red sessions, now that we are bullish—bullish now not once. This is a strong revealing signal.
Bitcoin will continue growing and as it grows the Altcoins will follow. Marketwide bullish action is happening now today all across.
Feeling any doubt, any worries?
Don't worry. No need to doubt, Bitcoin is going up and has been going up now for an entire month. What more can you ask for?
Bitcoin has been rising since 7-April the same for the Altcoins. The Altcoins closed four weeks green Bitcoin is the same. That is a strong recovery if you ask me but asking, knowing you, it is enough for you to rest easy and be prepared to hold long-term, why? Because the market is set to grow in proportions not seen before. With interest rates going lower this will definitely support the 2025 bull market that we've been waiting for and the recovery and low that is already confirmed.
» Bitcoin trading above $90,000 is ultra-bullish.
» Bitcoin trading below $95,000 is a very, very strong buy. You can even buy with leverage because lower prices are hard as whales are watching, waiting and buying everything that anybody wants to sell. With whale-buying working as support, the low is already in, when the buying is over liquidity hunt will happen up, toward resistance.
Billions of short traders will be liquidated once again but that is their choice, they are remaining clueless to all the signals the market offers and shares. Trading easy above 90K, several weeks closing green, the Altcoins market producing strong gains and even when there is a retrace many stay green. Classic—classic bull market dynamics. Are you with me?
Just a friendly reminder. Focus on what we know will happen next. Bitcoin closed two days red is that a big deal? Enough to shake you out? No! You are ready to hold, you are ready to grow I am ready for the 2025 bull market.
It is happening now.
Thank you for reading.
Namaste.

TradeCityPro | INJUSDT Ready for a Big Move?👋 Welcome to TradeCityPro Channel!
Let’s dive in and analyze one of the popular crypto projects, INJ, which has a high likelihood of movement, and check our entry triggers together.
🌐 Overview Bitcoin
Before starting the analysis, I want to remind you again that we moved the Bitcoin analysis section from the analysis section to a separate analysis at your request, so that we can discuss the status of Bitcoin in more detail every day and analyze its charts and dominances together.
This is the general analysis of Bitcoin dominance, which we promised you in the analysis to analyze separately and analyze it for you in longer time frames.
📊 Weekly Time Frame
On the weekly time frame, I see that the seventh period is stable, INJ, and compared to the majority of altcoins that have their own low price levels, it is in a better space and is engaged in its own supports!
After breaking the primary trend ceiling, namely 9.28, we experienced a sharp upward movement and formed a historical ceiling at $53, and after forming a distribution box and breaking the important floor of 16.20 and pulling back to it, we experienced a continued decline.
We have now reached support again, which was previously a very important resistance, and now, as a result, it is probably not lost, but the weekly candle is a very good and bearish candle! Don’t forget to save your profit, your strategy booklet, and your positions, otherwise, you will have made a 450% move without adding anything to your capital!
📉 Daily Time Frame
On the daily time frame, our trend is completely bearish as you can see, and the events are completely accompanied by the formation of a downward bottom and top, but we are likely to suffer for a while.
After getting rejected from 34.16 and forming a box between 20.16 and 25.93 and losing the bottom, it made a move and then while pulling back with low volume and the next conversion to red, it became an inverted Sharpe, we experienced a decline!
After breaking the daily trendline, which was also an important trendline, its trigger at 8.48 was broken, and we are currently engaged with the resistance at 10.47, and the next and most important trigger, so to speak, is after breaking 10.47, and you can even have a spot buy with this level!
🕓 4-Hour Timeframe
In the 4-hour time frame, we are also ranging between the box of 9.24 to 10.41, and practically, whichever side we break, we can say we can take its position and go along with it!
📈 For a long position, the trigger is completely clear, and after breaking 10.41, make sure to take a long position, and you can even open a position before this trigger breaks with the presence of momentum in lower time frames!
📉 For a short position, we have just formed the support at 9.24, and if we bounce from this support and hit a lower high, or better yet, get rejected before 10.41, we go for a short position and a break of 9.24!
✍️ Final Thoughts
Stay level headed, trade with precision, and let’s capitalize on the market’s top opportunities!
This is our analysis, not financial advice always do your own research.
What do you think? Share your ideas below and pass this along to friends! ❤️

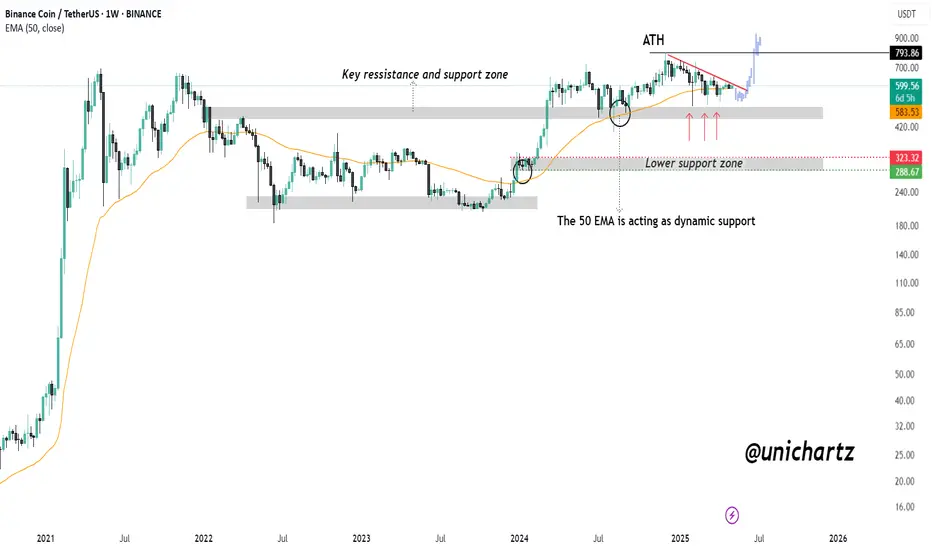
BNB Bull Flag Activated — Watching for $794 CRYPTOCAP:BNB is showing strong bullish momentum after rebounding off the marked support zone. This level, which previously acted as resistance, is now holding firmly as support following the breakout.
As long as BNB sustains above this zone, the bullish structure remains intact — and the path toward a new All-Time High (ATH) around $794 is wide open. The 50 EMA continues to act as dynamic support, further strengthening the setup.
DYOR, NFA
XRPPrice has swept the Weekly Lows of last week. Now, we should begin our climb towards $2.36, which was previous weeks high.
We may see a impulse move towards $2.26 mid week, followed by more buying heading into the weekend.
If we fail to break above $2.26 we may see more drawdown towards $2.08 support.
There are plenty of catalyst to propel us towards $2.50+, we should still be accumulating if possible.
Stay diligent, our time is coming!

ALT COIN SEASON IS JUST WEEKS AWAY, HOPE YOU HAVE YOUR BAGS FULLHey Traders,
We’ve been watching this Bitcoin Dominance (BTC.D) chart closely — and it’s heating up again!
For those unfamiliar, BTC Dominance tracks the percentage of total crypto market cap that belongs to Bitcoin. When BTC.D rises, it typically means altcoins are underperforming compared to BTC — either due to their market caps falling, or BTC’s increasing. When it drops, altcoins are gaining ground.
While this chart won’t tell you whether markets go up or down, it’s critical for spotting where to diversify and when. It’s a must-have tool in your crypto trading utility belt.
⸻
Why This Chart Matters Now:
We’re nearing the top resistance trendline of a long-term triangle formation that dates all the way back to 2017. This line has rejected BTC.D multiple times in the past — and we’re back to test it again, hovering between 63% and 66% dominance.
Each of these rejections previously led to a drop in BTC Dominance — which triggered powerful altcoin seasons.
⸻
Key Bearish Signals:
• Bearish Divergence on the MACD
• MAJOR Bearish Divergence on the RSI
(Just like before previous alt seasons!)
• TOTAL2 (the white line representing all altcoins) looks poised to spike if history repeats.
Altseason Clue: When BTC.D forms bearish divergences on these indicators, it’s often followed by a surge in altcoin market cap — a key early signal we may be close to another one.
⸻
BUT… This Isn’t 2021 Anymore:
Let’s be real — the market has changed. Solana-based launchpads like Pump.fun and Jupiter DEX have revolutionized how easily tokens are created and traded. That’s new capital flow and speculative behavior we didn’t see last cycle.
Plus, the geopolitical landscape is shifting fast. With President Donald J. Trump calling for crypto regulation frameworks within 180 days, we may soon see an influx of institutional money — but it could come with strings attached.
⸻
Final Thoughts:
A breakdown in BTC.D could mean a major rotation into alts — but don’t bet the farm.
Markets could still dump. We may even skip altseason altogether this cycle.
However, this chart gives you a crucial edge — so use it wisely. Know your tools. Zoom out. Plan ahead.
As always — stay sharp, stay safe, and stay profitable out there.
— Savvy

NOT SELLHello friends
Due to the sharp drop in price, we can open a trade in the direction of the trend, of course with capital and risk management.
*Trade safely with us*

TRB SELLHello friends
Due to the sharp drop in price, we can open a trade in the direction of the trend, of course with capital and risk management.
*Trade safely with us*

Bitcoin Confirms Breakout — Bullish Trend Gains StrengthStair-Stepping Uptrend:
Bitcoin has confirmed a breakout above the critical $88,000–$90,000 resistance zone, forming a classic pattern of higher lows and higher highs. This technical structure signals a decisive shift in market sentiment.
Momentum Builds:
The breakout marks a clear resurgence in bullish momentum after months of consolidation following January’s highs. It suggests that the market is regaining strength and preparing for a sustained move upward.
Key Support Level:
As long as Bitcoin holds above $92,000, the bullish structure remains valid. This level now acts as a critical threshold for traders to manage risk and assess continuation.
Outlook:
With the trend now clearly favoring the bulls, Bitcoin is well-positioned for further upside in the near term. Continued strength could open the door to retesting previous all-time highs and potentially reaching new ones.
#Bitcoin #BTC #Crypto #Breakout #TechnicalAnalysis #BullishTrend #CryptoMarket #SupportAndResistance #MarketUpdate #PriceAction

Bitcoin Daily Bullish CUP pattern but with resistance coming in
Please excuse the number of lines here but this is my working chart and I am short of time but I wanted to share this.
Bitcoin Daily has printed a Bullish CUP and is back on the Rim but we have still to reach the edge of the Cup, which is expected around 15th May, 10 days. When PA entered thhis Cuo, it also ranged sideways for a while.....
Something that PA has to face in the near future is that red 236 fib circle. And PA may be already reacting to that.
Look to the left and see what happened last time we hit a red 236 fib circle.
I think we are in a stronger position this time though but a Drop to the Long term rising trend line is a very real possibility
That is around 92K - > 87K -Not a Major drop and it would actually play into the Bulls hands by resetting the Daily MACD that is already beginning to turn slightly Bearish
This is NOT a reason to PANIC or Sell but is more an opportunity, maybe the last one, to Buy BTC at around this price.
I think a drop back down to the 2.272 Fib extension at 77K is highly unlikely but we should have a plan should this happen.
We do have the DXY support group, sorry, THE FED announcing the Next decision of Rates on 7th and it is very likely that PA will Drop till then, slowly hopefully, resetting the MACD as previously mentioned, and then push through that 236 Fib circle after the continued Freeze on Rates is announced.
We have to wait and see......
