HBARUSDT 4H Chart Analysis |Volume & Fibonacci Reaction in FocusHBARUSDT 4H Chart Analysis | Volume & Fibonacci Reaction in Focus
🔍 Let’s break down the latest HBAR/USDT setup, highlighting a clear technical reaction and a new opportunity on the horizon.
⏳ 4-Hour Overview
HBAR has completed a strong impulsive leg after breaking above the RR2 of the key reversal trendline, supported by notable volume confirmation. This impressive surge was then followed by a corrective leg—a healthy sign for bulls, especially for those who missed the initial breakout.
📉 Corrective Phase & Fibonacci Support
- The current corrective leg is characterized by decreasing volume, suggesting profit-taking rather than heavy selling pressure.
- Notably, price has reacted firmly at the 0.236 Fibonacci retracement level, aligning with classic pullback zones for continuation setups.
- This volume pattern shows traders are waiting for the next major move rather than exiting positions.
🔺 Bullish Continuation Setup
- A strong candle close above the $0.255 level on either the 1H or 4H timeframe will serve as a clear bullish confirmation.
- Such a breakout may pave the way for another impulsive leg upward, with the first upside target identified near $0.30—roughly 19% higher from the recent candle close.
📊 Key Highlights:
- The prior trend reversal was validated by surge in volume and momentum.
- Volume decline during the correction favors further upside rather than distribution.
- Price is respecting key Fibonacci levels, hinting at trend continuity.
- A confirmed close above $0.255 unlocks the next target at $0.30, marking a potential 19% move.
🚨 Conclusion:
HBAR is showing textbook trend continuation signals. For those sidelined after the initial move, the current consolidation offers a safer re-entry point, with actionable confirmation above $0.255. Stay alert for a strong candle close and keep the $0.30 target in view as bullish momentum builds.
Cryptomarket

Thena: Hold Until The End (1,337% Profits Potential)Which one will you take? Endless opportunities the Cryptocurrency market has to offer; which one will you take?
Doesn't need to be just one can be many. You can choose many pairs to trade.
Countless opportunities are available now and these will be generating huge profits in the coming days.
The first burst forward will produce 100%, in 1-3 days. And this will be followed by sustained long-term growth. It will grow so much and for so long, that you will become bored. It won't be exciting anymore... Until the correction of course.
Thena here has more than 1,000% potential for growth. Right now this pair, THEUSDT, is sitting on a higher low or double-bottom, in this case it is the same.
This is the same pattern produced by Ravencoin, remember?
That project that grew more than 150% in a single day. "Altcoins Market Bull Market Confirmed, Ravencoin." And it is true, watch everything grow.
This same pattern is present on so many altcoins, not all of them but many and we know exactly what will happen next because what one does, the rest follows.
THEUSDT is about to go bullish, can take a few weeks or less, a few days.
When the bullish wave starts it will go for months, months of sustained growth. You simply hold until the end.
Thank you for reading.
Namaste.

TradeCityPro | Bitcoin Daily Analysis #129👋 Welcome to TradeCity Pro!
Let’s take a look at the Bitcoin analysis and key crypto indices. As usual, in this analysis, I’ll review the futures triggers for the New York session.
⏳ 1-hour timeframe
Yesterday, Bitcoin faced a sharp drop after being rejected from the 122733 top and fell down to the 116829 level.
⚡️ Currently, the price has reached an important support area that I’ve marked for you, and at the same time, the RSI has entered the Oversold zone.
✅ Considering the main trend of the market is bullish, this RSI entry into Oversold could be a very good entry point for a long position, as it may indicate the end of the correction.
✨ If the price holds above the 116829 zone, we can enter a long position, and it’s worth opening a position at this level. Further entries can be taken with breakouts of 118494 and 122733.
👑 BTC.D Analysis
Let’s go to Bitcoin dominance. It has continued its downward movement and after breaking 64.44, it’s now moving down toward 64.18.
📊 If this level breaks, we’ll get confirmation of the continuation toward 63.96. In that case, long positions on altcoins would be very suitable.
📅 Total2 Analysis
Total2 is also undergoing a correction like Bitcoin and has settled below the 1.3 level.
⭐ If the correction continues, the next level to watch is 1.26. For long positions, you can enter after breakouts of 1.3 and 1.33.
📅 USDT.D Analysis
Now to Tether Dominance. After bouncing from the 4.22 bottom, it has returned to the box between 4.36 and 4.44.
🔑 If 4.36 breaks, the next bearish leg could start. On the other hand, if 4.44 breaks, we’ll get the first signal of a trend reversal.

TradeCityPro | SOL Holds PRZ as Bulls Eye Range Breakout👋 Welcome to TradeCity Pro!
In this analysis, I want to review the SOL coin for you. This is one of the popular Layer1 projects, nicknamed the “Ethereum killer,” with a market cap of $85 billion, currently ranked 6 on CoinMarketCap.
📅 Weekly timeframe
In the weekly timeframe, after the bankruptcy news related to FTX, this coin had a very sharp bearish move and even dropped to as low as 9.84, but it managed to recover afterward.
⭐ From the key top at 27.62, a very strong bullish move started, reaching up to 255.96 and retesting its previous ATH.
📊 Currently, a range box has formed between the 128.66 and 255.96 levels, where the bottom of this box is a very strong PRZ, created from the overlap of a major support zone and the area between the 0.236 and 0.382 Fibonacci levels.
🔍 Also, the price is being supported by the SMA99, which has supported the price twice so far and has prevented the box from breaking to the downside.
⚡️ If you have already bought SOL, you can set your stop-loss if the price closes below this area. A confirmed breakdown could lead to deep corrections toward lower Fibonacci levels.
🛒 For buying this coin, the first trigger is the break of 178.22, which is a bit riskier but offers a good price entry. On the other hand, if the price revisits 128.66 and gives confirmation, we can enter from there.
📈 However, the main trigger for spot entry is the breakout of the 255.96 top. Breaking this level can unlock some very ambitious targets. If that happens, I’ll definitely update the analysis and provide those targets.
📅 Daily timeframe
In this timeframe, we can see the price action in more detail. A small range box has formed between 144.11 and 164.74, and the price is currently stuck below the top of the box and reacting to it.
✨ If 164.74 breaks, we can enter a long position. The next major resistance is 183.54. A breakout above that will serve as the main confirmation for a long position targeting 255.96, which can also be used as a spot trigger.
💥 The RSI oscillator is now above the 50 zone, and if it enters the Overbuy area, it will serve as strong momentum confirmation for this position.
✅ If the price gets rejected from the top, we can also open short positions on lower timeframes. A break below 144.11 will be the main short trigger.
📝 Final Thoughts
This analysis reflects our opinions and is not financial advice.
Share your thoughts in the comments, and don’t forget to share this analysis with your friends! ❤️

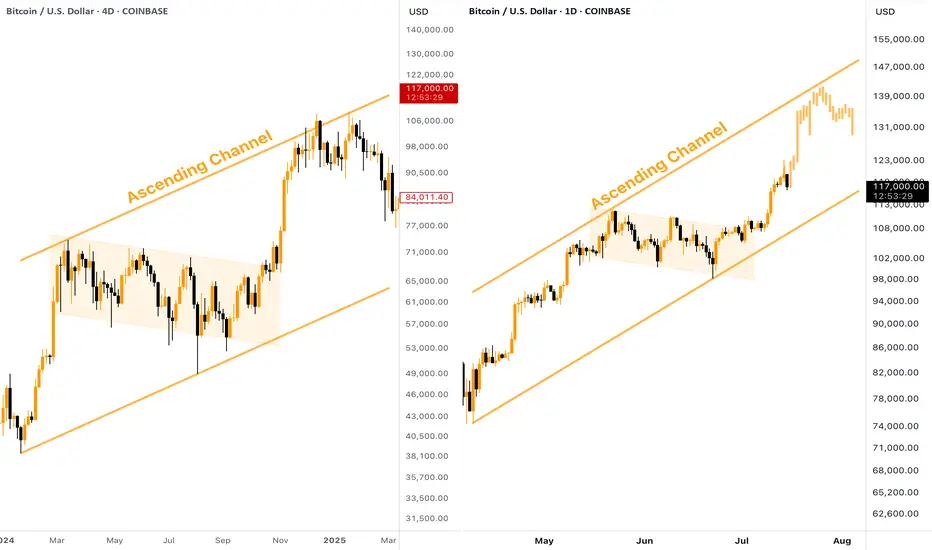
[BITCOIN] - Where is Potential TOP (ATH) of the Bull Cycle?Many people wondering where is the potential TOP of the current Bitcoin Bull Run? Besides setting a Fibo Retracement, we can take a look at the past. The current situation on CRYPTOCAP:BTC chart reminds me of what we've seen in the end of 2024, here is why:
Big ascending channel, price perfectly moves inside without breaking borders
Descending consolidation inside the bull flag
Strong breakout and pump towards the resistance of the channel
👉 According to this pattern, the target for the current Bitcoin upward move should be located in the $140,000 zone. Keep this in mind when planning your trades.
Bitcoin’s Wild Ride to New ATHs: What’s Next for Traders?Hello, TradingView warriors! 👋
Have you caught Bitcoin (BTC) smashing through a new all-time high (ATH) this Monday? 🎉 If you blinked, you might’ve missed it! But don’t worry, the crypto king isn’t done with its rollercoaster ride just yet. After soaring to new heights, BTC has pulled back for a retracement—not a full-on reversal, so hold your horses! 🐎 Whales are playing their usual games, setting traps for unsuspecting traders. Don’t fall prey to their tricks! 🦈 Let’s break down the key levels to watch and stay one step ahead. 💡
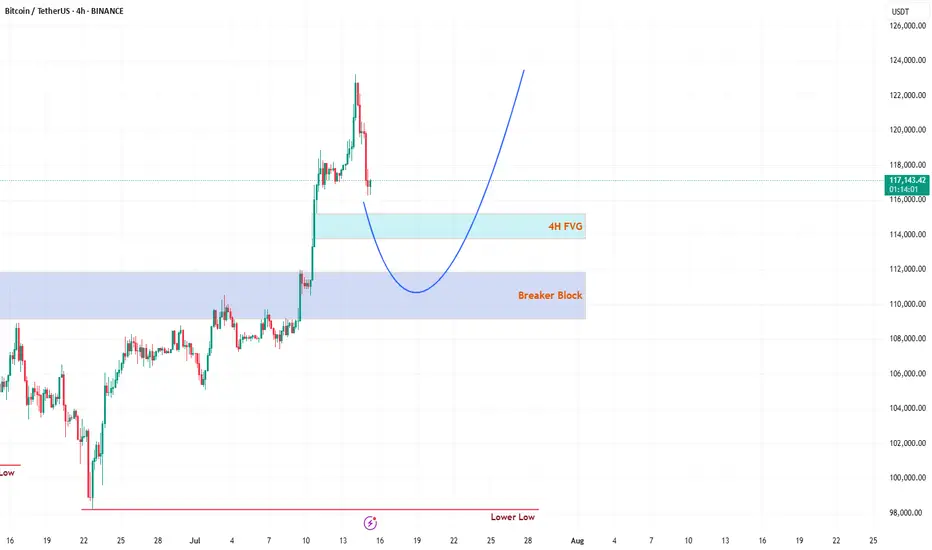
🔍 Key Levels to Watch on the Chart
1️⃣ 4H Fair Value Gap (FVG)
This 4H FVG is a thing of beauty—my personal favorite! 😍 But let’s be real, Bitcoin doesn’t care about aesthetics. This FVG is likely to act as the first resistance level. Here’s the plan:
If respected, expect BTC to use this level as a springboard to catapult back toward the ATH. 🚀
If broken, BTC might slide toward the stronger resistance below. Keep your eyes peeled for how price reacts here! 👀
2️⃣ Daily Breaker Block (PD Array)
This is the big one—a rock-solid resistance zone on the daily timeframe. I’m leaning toward BTC dipping into this Breaker Block to clear out liquidity before making its next big move to retest the ATH. 🏦 This level is a magnet for price action, so don’t sleep on it! 😴
🛠️ Trading Strategy: Stay Sharp!
Patience is your best friend right now, traders. 🙏 Don’t rush into trades without confirmation. Watch how BTC interacts with these two levels:
4H FVG: Look for rejection or a breakout to gauge short-term direction.
Daily Breaker Block: If price dips here, it’s likely hunting liquidity before the next leg up.
Wait for clear price action before jumping in—let the market show its hand! 🃏 Stay disciplined, avoid the whale traps, and let’s ride this BTC wave together. 🌊
📚 Want More? Follow Me!
If you’re hungry for more technical analysis insights and market updates, hit that follow button! 📈 I share tips, tricks, and breakdowns to help you navigate the markets like a pro. Let’s level up your trading game together! 💪
What’s your take on BTC’s next move? Drop your thoughts below, and let’s discuss! 💬 Happy trading, and may the profits be with you! 📈
AVAX/USDT - H4 - Wedge Breakout (29.06.2025)The AVAX/USDT pair on the H4 timeframe presents a Potential Buying Opportunity due to a recent Formation of a Wedge Breakout Pattern. This suggests a shift in momentum towards the upside and a higher likelihood of further advances in the coming Days.
Possible Long Trade:
Entry: Consider Entering A Long Position around Trendline Of The Pattern.
Target Levels:
1st Resistance – 21.77
2nd Resistance – 24.35
🎁 Please hit the like button and
🎁 Leave a comment to support for My Post !
Your likes and comments are incredibly motivating and will encourage me to share more analysis with you.
Best Regards, KABHI_TA_TRADING
Thank you.

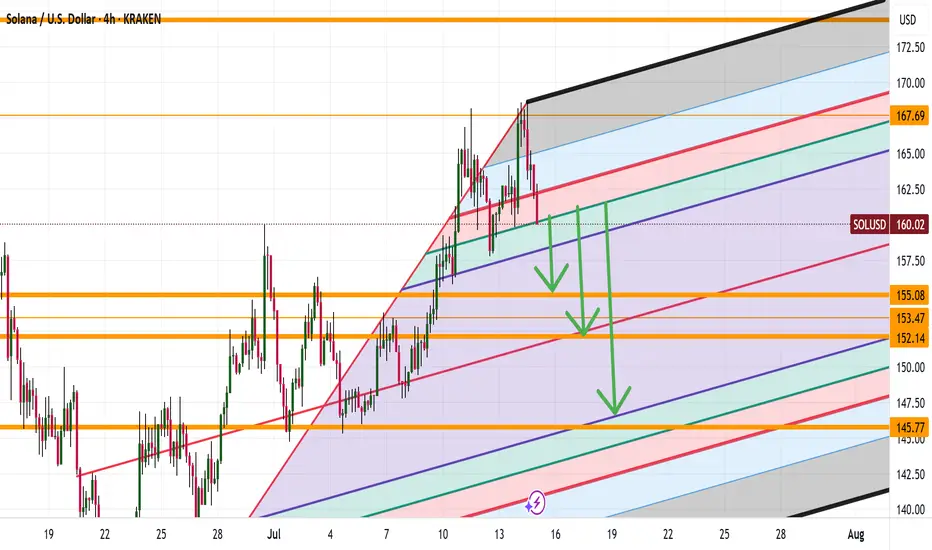
SOL DOWN TO 146 ? Is this possible? Good evening trading family
Based on what we are seeing here is a typical correcting of any good bull mark needed to sustain our movement upwards. Currently we have spotted 3 levels down to the 146 marker with a these of a bullish move upwards if they hold.
Happy trading folks
Kris/ Mindbloome Exchange
BTC bullish sentiment and All time highs?BTC is printing a good structure and characteristics resembling the highs of 2021. 2025 is the only bullish year left before BTC crashes again.
Usually BTC is bullish in the end of the year. This OCT/NOV could print 130K-136k for btc before a fatal crash

Bullish continuation?The Ethereum (ETH?USD) is falling towards the pivot which is a pullback support and could bounce to the 1st resistance.
Pivot: 2,821.91
1st Support: 2,649.43
1st Resistance: 3,077.96
Risk Warning:
Trading Forex and CFDs carries a high level of risk to your capital and you should only trade with money you can afford to lose. Trading Forex and CFDs may not be suitable for all investors, so please ensure that you fully understand the risks involved and seek independent advice if necessary.
Disclaimer:
The above opinions given constitute general market commentary, and do not constitute the opinion or advice of IC Markets or any form of personal or investment advice.
Any opinions, news, research, analyses, prices, other information, or links to third-party sites contained on this website are provided on an "as-is" basis, are intended only to be informative, is not an advice nor a recommendation, nor research, or a record of our trading prices, or an offer of, or solicitation for a transaction in any financial instrument and thus should not be treated as such. The information provided does not involve any specific investment objectives, financial situation and needs of any specific person who may receive it. Please be aware, that past performance is not a reliable indicator of future performance and/or results. Past Performance or Forward-looking scenarios based upon the reasonable beliefs of the third-party provider are not a guarantee of future performance. Actual results may differ materially from those anticipated in forward-looking or past performance statements. IC Markets makes no representation or warranty and assumes no liability as to the accuracy or completeness of the information provided, nor any loss arising from any investment based on a recommendation, forecast or any information supplied by any third-party.

Sperax: Bullish pennant.Sperax is consolidating in a bullish pennant pattern after a strong recovery rally off the March lows. Price action has tightened between ascending support and descending resistance, forming a textbook continuation setup. Volume has decreased during this compression, which is often a precursor to explosive movement.
Fundamental Catalysts (Despite GENIUS Act Stalling):
Retail DeFi Narrative is Still Alive – While the GENIUS Act failed in the Senate, the momentum for regulatory clarity in the DeFi space continues. Future bills or executive actions could unlock capital flows to protocols like Sperax.
Deflationary Pressure —Over 13% of the total SPA supply has been burned, with more tokens locked and lost. The actual circulating supply is meaningfully lower than the total supply shown on aggregators.
SIP-70 has been passed , shifting SPA emissions from an automatic release model to a DAO-controlled emission schedule. This marks a significant milestone towards sustainable tokenomics and the preservation of long-term value.
Long-Term Accumulation – Wallet data and order books suggest that whales and long-term holders quietly accumulate during this sideways range.
Sperax remains a low-cap token with outsized potential in the next altseason if it secures even one meaningful partnership or fiat on-ramp.

SUIUSDT Weekly Chart Analysis | Breakout Confirmed!SUIUSDT Weekly Chart Analysis | Breakout Confirmed, Massive Liquidity at $4–$4.20
🔍 Let’s dive into the SUI/USDT weekly chart after a decisive breakout from the symmetrical triangle, highlighting the critical liquidity zone and what it means for price action.
⏳ Weekly Overview
SUI has broken out of its multi-month triangle pattern following a textbook fakeout, with volume dynamics confirming renewed bullish momentum. The breakout is now awaiting daily candle confirmation for full validation.
🔺 Bullish Breakout & Key Liquidity Zone
A major liquidity cluster sits between $4.00 and $4.20, with more than $140 billion in liquidity concentrated in this range. This zone is crucial for several reasons:
- It represents a significant area where large buy and sell orders are stacked, likely leading to heightened volatility as price approaches or breaks through.
- Clearing this liquidity could unlock rapid moves toward the next upside targets at $7.03 and $9.50, as shown on the chart.
📊 Key Highlights
- Symmetrical triangle resolved with a bullish breakout, confirmed by increasing volume.
- The $4.00–$4.20 range holds over $140B in liquidity, making it a pivotal battleground for bulls and bears.
- Daily candle confirmation remains essential for trend validation.
- SUI ecosystem has reached a new all-time high in DeFi TVL, adding fundamental strength to the bullish case.
🚨 Conclusion
The breakout above the triangle, combined with surging volume and a record DeFi TVL, sets the stage for a potential rally. Watch the $4.00–$4.20 liquidity zone closely—how price interacts with this level could determine the speed and magnitude of the next move. Stay alert for daily confirmation and be prepared for volatility as SUI tests this high-stakes region.
#SUI #CryptoAnalysis #TradingView #Altcoins #ACA

ETH 4H: Retest in Progress
ETH on the 4H starts the week strong, currently retesting support at the 0.382 Fib, a level that acted as resistance last week.
We’ve had two 4H candle closes above it, but now a close below seems likely.
I’ve set a TP at the 4H-50% line, just under the PSAR dots, to take 50% profit if price dips further.
Always take profits and manage risk.
Interaction is welcome.

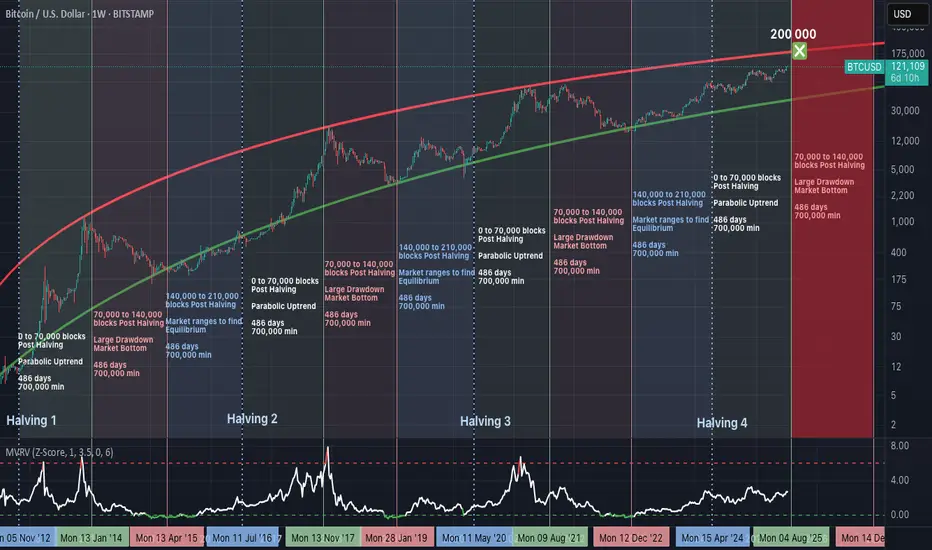
Bitcoin’s 486-Day Halving Blueprint: The $200,000 Blowoff?Summary
Bitcoin’s price consistently follows a 3-phase structure after each halving, with ~486 days per phase. If history repeats, we are nearing the end of the parabolic phase, with a potential peak around $200,000, before entering a structured drawdown.
Halving Cycles: The Real Clock Behind Bitcoin
Bitcoin’s monetary policy is pre-programmed.
A halving occurs approximately every 210,000 blocks (~4 years), and market behaviour after each halving follows this repeating pattern:
Phase 1: Parabolic Rally (0 to 70,000 blocks post-halving).
Phase 2: Major Drawdown (70,000 to 140,000 blocks).
Phase 3: Equilibrium Phase (140,000 to 210,000 blocks).
Each phase lasts approximately 486 days, and this structure has repeated reliably since 2012.
Phase 1: The Parabolic Rally (Current Phase)
We are currently in the growth segment of the cycle:
Price rising rapidly.
Miner profitability at highs.
Hashrate and network security increasing.
MVRV Z-Score steadily climbing, but not yet overextended.
Roughly 700,000 BTC are mined during this period, creating a supply shock as issuance is halved while demand accelerates.
Phase 2: The Drawdown (Expected Next)
Historically begins between block 70,000 to 140,000 post-halving.
Market peaks and begins to correct.
Miner margins compress.
Hashrate may plateau or decline.
Forced selling and miner capitulation drive volatility.
Price retraces significantly from the peak.
This phase resets the market and eliminates unsustainable excess.
Phase 3: The Equilibrium Phase
Occurs between block 140,000 to 210,000 post-halving.
Price enters consolidation.
Realized value and market price converge.
Ideal accumulation period for long-term investors.
Network fundamentals stabilize ahead of the next halving.
This phase is critical in building the base for the next cycle.
MVRV Z-Score: Market Thermometer
The chart includes the MVRV Z-Score, a key metric showing how far price deviates from realized value:
Readings above 6.0 have consistently marked cycle tops.
Readings near or below 0 have marked major bottoms.
Current value is around 2.67 — indicating a rising trend, but not overheated.
This metric reflects market-wide profitability and speculative pressure.
Why $200,000 Is in Sight
The projected resistance curve on the chart suggests that:
$200,000 aligns with the top of the long-term parabolic channel.
It corresponds with the expected end of the parabolic phase (Q1–Q2 2026).
It fits prior extension patterns following each halving.
It is a strong psychological target, likely to trigger heavy profit-taking.
This price level is not arbitrary—it is derived from the same structure that defined previous peaks.
What Comes After
If the historical cycle structure remains intact:
The peak should occur before mid-2026.
A deep correction phase follows, likely into 2027.
True bottoms tend to occur as miner capitulation concludes and difficulty adjusts downward.
This is where conviction and preparation matter most.
Final Thoughts
Bitcoin cycles are not random. They are structured around block height, issuance, and miner economics.
Every cycle since 2012 has followed this 486-day framework, divided across parabola, crash, and reset. This model has outperformed calendar-based predictions and technical narratives.
Disclaimer
This content is for educational and informational purposes only and does not constitute financial, investment, or trading advice. Past performance is not indicative of future results. Always do your own research and consult with a qualified financial advisor before making investment decisions. The author holds no responsibility for any losses incurred as a result of using the information presented herein.
Top Altcoins Choice —Your Pick · Bitcoin Hits New All-Time HighBitcoin is once again trading at a new all-time high and as this happens the altcoins go boom.
The first instance circled around the fact that Bitcoin was strong and range trading between $100,000 and $110,000. When Bitcoin goes sideways within a bull market, the altcoins tend to blow up, and blow up they need. Now, when Bitcoin moves to hit a new all-time high and keeps growing; the 2025 Cryptocurrency bull market is fully confirmed.
» Which one is your favorite altcoin trading pair?
» Which project you think will grow the most in 2025 & 2026?
» What is your TOP ALTCOIN CHOICE?
Top Altcoins Choice —Your Pick
Leave a comment with some of your favorite altcoins pairs, the ones you like most and I will do a full analysis for you. I will publish in my profile and also answer directly in the comments section. I will pick and choose.
If you see other commentators that have a pair that you like, make sure to boost their comment and reply. The more boosts a comments gets, higher priority will be given to the project and trading pair.
Boost this publication and leave a comment, let's get started with your TOP ALTCOINS CHOICE!
Namaste.

TradeCityPro | Bitcoin Daily Analysis #128👋 Welcome to TradeCity Pro!
Let’s get into the analysis of Bitcoin and key crypto indexes. As usual, I’ll be reviewing the futures triggers for the New York session.
⏳ 1-Hour timeframe
In the 1-Hour timeframe, as you can see, Bitcoin broke the 118494 top yesterday and is now moving upward.
✔️ According to the Fibonacci Extension zones, the price has moved up to the 0.5 Fibonacci level and has been rejected from there, printing a few red candles for now.
📊 The buying volume in this bullish leg was very high, and as you can see, volume was in convergence with the trend. Now that the corrective phase has started, the volume is also decreasing, and still remains in convergence with the uptrend.
🔔 From a momentum perspective, we’ve reached a market top because RSI has reached the ceiling it previously formed at the 85.90 level, reacted to it, and has now dropped back below the 70 zone.
💥 If the 85.90 zone on RSI is broken, we’ll likely see a very sharp and explosive bullish leg from Bitcoin. In that case, the next targets would be the 0.786 and 1 Fibonacci levels.
🔑 For opening a position now, we can enter on the break of 122512, and we could also use the price’s pullback to the SMA25 as an entry. For now, our triggers aren’t highly reliable, so positions should be based more on market momentum.
👑 BTC.D Analysis
Let’s move to Bitcoin Dominance. The dominance range box between the 64.44 and 64.82 is still ongoing, and dominance hasn’t broken out of this box yet.
⚡️ If the box breaks downward, a large amount of capital will flow into altcoins, and we could see major pumps in altcoins.
📅 Total2 Analysis
Moving on to Total2. Yesterday, the 1.3 top was broken and the price moved up toward 1.33 and has now reached that area.
I✨ f that resistance breaks, the next target will be 1.41. If a correction happens, 1.3 and 1.26 are the lower support zones.
📅 USDT.D Analysis
Now to Tether Dominance. A new bearish wave started yesterday and has continued down to 4.22.
🎲 If this zone breaks, the bearish leg can continue down to 4.08.
❌ Disclaimer ❌
Trading futures is highly risky and dangerous. If you're not an expert, these triggers may not be suitable for you. You should first learn risk and capital management. You can also use the educational content from this channel.
Finally, these triggers reflect my personal opinions on price action, and the market may move completely against this analysis. So, do your own research before opening any position.

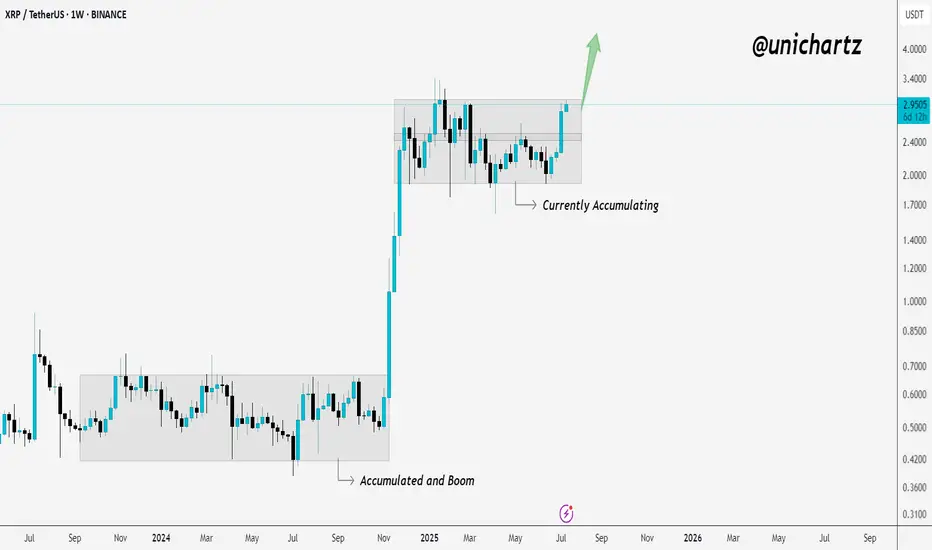
Accumulation Ending? XRP Showing Signs of BreakoutXRP is in the process of breaking out of its weekly accumulation range.
The last time we saw this kind of structure — it led to a massive move.
Now, price is pushing toward the top of the zone again… and momentum is picking up.
If it closes strong above this level, it could trigger the next big leg higher.
Stay alert — this could be the start of something big!
Ethereum Breaks $3,000: Hype Meets UtilityEthereum (ETH) has surged above $3,000, driven by a wave of retail and institutional momentum following the presale success of Little Pepe (LILPEPE), a meme coin built on a new Ethereum-compatible Layer 2 network. With over $5 million raised during the presale, the appetite for meme-coin ecosystems continues to fuel Ethereum’s utility narrative, giving it both technical and psychological strength.
Key Levels to Watch:
• Short-term Structure (H4 Chart): ETH is currently forming a bullish flag pattern, a continuation structure that often precedes further upside.
• Upside Scenario: A confirmed breakout above $3,100 could extend the rally to $3,200, and potentially test $3,300, a level of major historical resistance.
• Downside Risk: Failure to hold current levels may see ETH retrace back toward $2,900, with the 50% Fibonacci retracement at $2,600 acting as the next support zone.
If sentiment in the broader crypto market remains elevated and Bitcoin holds firm near all-time highs, Ethereum’s bullish setup may have further room to run.

CARDANO WILL BE $2!Our first downside target was touched, but then it failed to reach the second target and the g-wave ended at 0.54.
Based on past price movement, we can expect the price to reach $1.5-$2.
Good luck
NEoWave Chart

Bitcoin Fractal, increase to $116k Hi Everyone☕👋
BINANCE:BTCUSDT
Been such a long time since I posted. Today I'm looking at BTCUSDT, and I'm looking at the previous all time high cycle and what we were seeing (the pattern aka fractal).
Here's why we're likely going a little higher.
First correction of -32%
Followed by first peak, ATH
Correction, then the second peak and the REAL ath. Which is where we likely are:
Interesting to note that the previous time, the second ath was NOT THAT MUCH HIGHER. This should be considered to manage expectations in terms of how high we can go. Anything above +6% is a bonus.

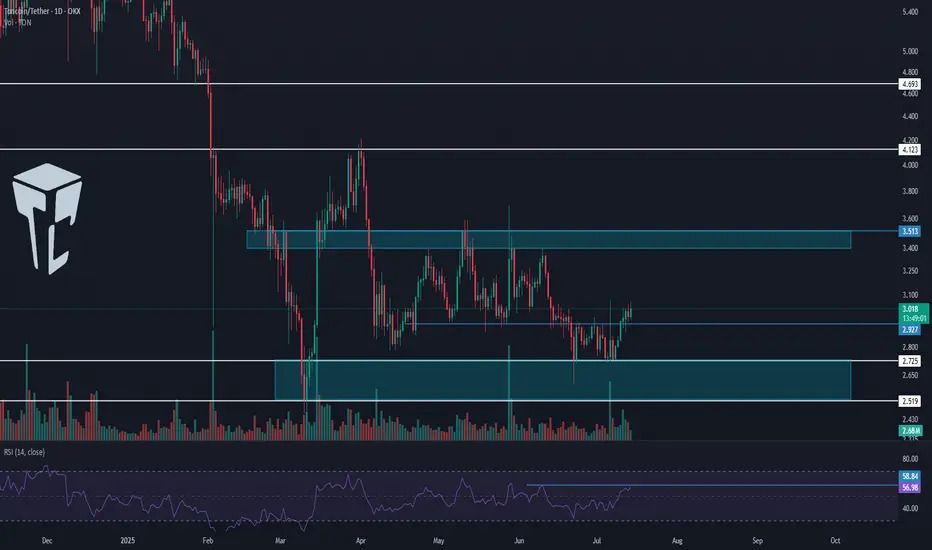
TradeCityPro | TON Eyes Breakout After Support Zone Rebound👋 Welcome to TradeCity Pro!
In this analysis, I want to review the TON coin for you — one of the popular coins owned by Telegram, currently ranked 20 on CoinMarketCap with a market cap of 7.51 billion dollars.
📅 Daily timeframe
In the daily timeframe, unlike other coins that have already broken their highs and are moving upward, this coin hasn’t yet reached its top and has just been supported from the bottom of its range box.
✔️ A Maker Buyer zone has formed between the 2.725 and 2.519 levels, which is the main support zone for this coin, and the price has been supported from this area and is now moving upward.
📈 The trigger confirming this support was the 2.927 level, and after this trigger got activated and the price consolidated, it seems the main bullish leg has now started, and the price can move toward the top of the box.
✨ If you already have a long position on this coin, I recommend holding it — especially if you have other open positions — because this move has just started, and if an uptrend forms, your entry is at a great level.
⭐ The first zone where I might take partial profits is the 3.513 top, which is a Maker Seller zone and may cause a pullback.
💥 On the other hand, if you don’t have an open position yet, the first long trigger is the break of 3.513. This level is the top of the box, and breaking it confirms the beginning of a bullish trend.
🔍 The RSI trigger and the entry of bullish momentum into the market is the break of 58.84 on this oscillator. Volume so far is well aligned with price, and if this buying volume continues to rise, we can expect sharp bullish moves from this coin.
📝 Final Thoughts
This analysis reflects our opinions and is not financial advice.
Share your thoughts in the comments, and don’t forget to share this analysis with your friends! ❤️
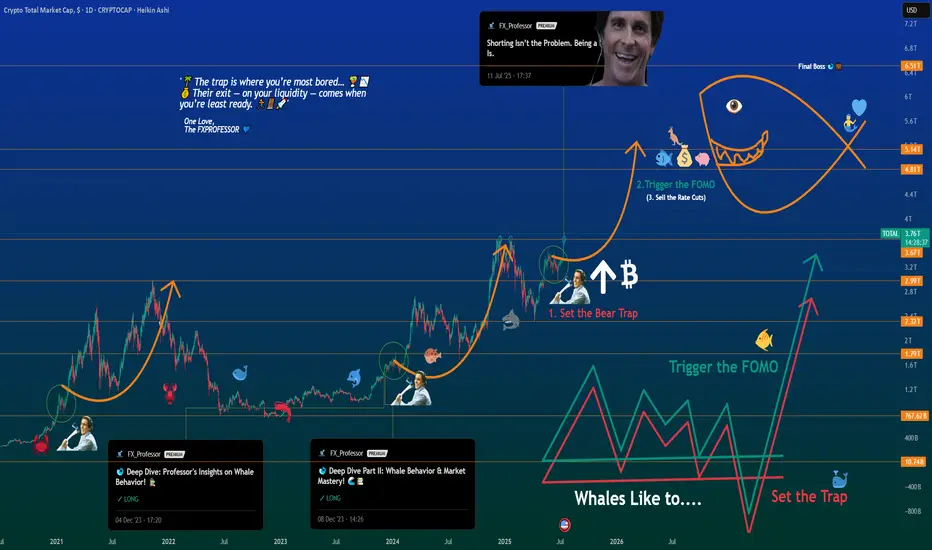
Deep Dive Part III – The Next BIG Whale Play UnfoldsDeep Dive Part III – The Next BIG Whale Play Unfolds
📍In Parts I & II of this Deep Dive, we broke down the psychology of whale behavior — from “Buy the Rumors, Sell the News” to the critical breakout zones that echoed historical patterns.
🐋 Back then, we spotted the whales' playbook early. The strategy was simple:
Buy the Rumors – Sell the News.
🧠 But now, the script has changed.
“The trap is where you’re most bored… 🌴📵
Their exit — on your liquidity — comes when you’re least ready. 💰🏄♂️💼”
Let’s break this moment down into what’s really unfolding.
We are officially entering the next stage of the cycle — not just in price, but in psychology.
This is no longer just about charts.
This is about human behavior on autopilot.
Here’s what I see happening right now — broken into three truths:
1️⃣ People Are On Holiday 🌞
From my community to the broader market, the energy is low.
People are either sunbathing on a beach or mentally checked out.
The focus is not there. The reflex to take action is dulled.
📉 The trap is where you’re most bored… 🌴📵
💰 Their exit — on your liquidity — comes when you’re least ready. 🏄♂️💼🚀
We’re seeing it unfold now:
1. Set the Bear Trap
2. Trigger the FOMO (will be down the road, yes)
3. Exit on Liquidity (the closing act of the play)
🕶️ But when everyone is away or asleep, that’s when the trap is laid.
It’s during these quiet, lazy days that the big moves get built.
2️⃣ This is a Disbelief Rally 🎢
The market trained everyone with a rhythm:
pump ➝ dump, pump ➝ dump, pump ➝ dump…
So what happens now?
People don’t trust the breakout. They’re frozen.
“We’ll dump again,” they say.
Except… what if this time, we don’t?
That disbelief becomes fuel.
It becomes hesitation — and hesitation becomes missed opportunity.
3️⃣ Bears Are Shorting Into Strength 🧨
This is key. While retail is confused, the bears are pressing in hard.
Their shorts are adding fuel to the pump they don’t see coming.
That’s why I posted recently:
“Shorting isn’t the problem. Being a psycho bear is.”
It’s not about being bullish or bearish —
It’s about timing , discipline , and narrative awareness .
Whales love this moment.
They lure in shorts, set the trap, then ignite the breakout straight into FOMO.
🧠 The Game:
Set the Trap → Trigger the FOMO → Exit on Liquidity 💥
This is what you’re seeing on the chart.
Not just price action — psychological choreography.
🕰️ In 2020–2021, we saw the exact same structure.
Part I warned about early accumulation and baiting behavior.
Part II showed how whales manipulated expectations with layered waves of doubt.
Now in Part III — the explosion few are ready for.
Zoom into the chart and it’s all there:
The curve, the trap, the trigger… and yes — the Final Boss.
🎯 The Final Boss: 6.51T
That’s the ultimate liquidity zone.
If this cycle plays out, we’re headed toward it.
“Sell the Rate Cuts” will be the new “Sell the News.”
It’s not the headlines that matter — it’s who’s left holding the bag.
🔚 Final Thought
The real exit — the one that traps most of retail — will come not when you’re euphoric,
but when you’re still saying:
“Surely we must dump now…”
So stay sharp.
Trade the chart — but don’t forget to read the behavior.
One Love,
The FXPROFESSOR 💙
Part1:
Part2:https://www.tradingview.com/chart/idea/VgMBPsp3/
The Bear Trap:
Disclosure: I am happy to be part of the Trade Nation's Influencer program and receive a monthly fee for using their TradingView charts in my analysis. Awesome broker, where the trader really comes first! 🌟🤝📈
BTC Weekly Update -as of Jul14🕰 Timeframe:
📆 Date:
🔎 Market Overview:
💼 Massive Institutional Inflows:
▪️ Over $1.1 billion in net capital inflows have entered spot Bitcoin ETFs in recent days, bringing the total weekly inflows to $2.72 billion so far.
▪️ The total assets under management (AUM) across all Bitcoin ETFs now exceed $150 billion, representing over 6% of Bitcoin’s total market capitalization.
⚖️ Favorable Political and Regulatory Support:
▪️ The ongoing Crypto Week in Congress is reviewing key legislative proposals like the Genius Act and the Clarity for Digital Assets Act, both of which offer promising regulatory clarity for the crypto industry.
▪️ Additionally, former President Trump’s executive order to establish a “Strategic Bitcoin Reserve” signals strong official political support for Bitcoin adoption.
📊 On-Chain & Sentiment Indicators
📦 Exchange Reserves:
Bitcoin reserves on centralized exchanges are at their lowest levels in years, suggesting a trend toward long-term holding (HODLing) and reduced selling pressure.
🧠 Fear & Greed Index:
The sentiment index remains firmly in the “Greed” zone, even hitting its highest level since May, indicating strong bullish sentiment among retail and institutional investors.
🌀 Whale Activity:
Whale wallets continue to show heavy accumulation, with large and steady transfers into private wallets, further supporting a bullish on-chain trend.
📈 Technical Setup
🔵Trend: Ranging upward
🔸 Key Support: 118,000➖ 115,000
🔸 Key Resistance: 125,000➖ 130,000
🔸 Indicators Used: RSI above 70
🧭 Next Week – Key Points
🔹 Watch for the outcomes of Crypto Week legislation in Washington — this will be a key driver for market direction.
🔹Monitor ETF capital inflows — if daily inflows stay above $500M, the bullish trend will likely strengthen.
🔹 Track the Federal Reserve's interest rate policy and the USD outlook, especially in response to inflation or other macroeconomic factors.
🔚 Summary: Final Analysis
📌 After reaching a new all-time high above $122K on July 14, Bitcoin’s bullish trend has strengthened. Strong institutional inflows and political support have reinforced the foundation for growth.
● Key Level Ahead: $125,000
● Outlook: If price consolidates above resistance, we could see a move toward $135K and beyond.
● Weekly Bias: Bullish, with potential for a pullback before continuation upward.
✅ If you like this analysis, don't forget to like 👍, follow 🧠, and share your thoughts below 💬!
