What I See on SOLUSD Crypto Hi, I'm making this simple, so SOL coin had a crazy run in 2024 now it's in a dip faze and ranging era so therefore I'm buying low and dips area don't make profits complicated
not a Financial Advisor so please take at your own risk
Cryptomarket

VIC Faces Crucial Resistance Test After Explosive RallyVIC just popped over 100% and is now testing a key resistance trendline.
After weeks of sideways chop and downside pressure, VIC has made a strong bounce off the demand zone and is now pushing right into the falling resistance trendline.
This is a crucial level, if it breaks and holds above this trendline, we could see a shift in structure and more upside toward the next supply zone.
But if it gets rejected again, price might cool off and retest lower supports.
DYOR, NFA

Decade-Long Uptrend Holds Strong – SPX Hits Fresh HighsS&P 500 Just Hit a New All-Time High (ATH) 🚀
The index has been in a strong uptrend for over a decade, consistently printing higher highs (HH) and higher lows (HL).
Every major resistance level has flipped into support, classic bull market structure.
Even during corrections, the 33 EMA and 100 EMA have acted like dynamic support zones.
Now that SPX has cleared its previous ATH, the structure remains intact, unless a strong breakdown occurs, momentum is still with the bulls.

Free signals: today (TRX)hello friends✋️
Considering the drop we had, you can see that the price was well supported in the specified area and buyers came in. Now in the return of the price, we can buy step by step in the specified support areas and move with it until the specified goals, of course, with the management of shame and risk...
*Trade safely with us*

Litecoin:Is the main climb coming?hello friends👋
As you can see, the price, after falling in the support area specified by the buyers, has been supported and returned, forming an upward pattern.
Now we don't enter into a transaction with just one pattern, we also check the entry of buyers and the amount of currency and other factors and draw conclusions.
According to the points we have said, we have identified very important support points for you to buy step by step with capital and risk management and move to the specified goals.
🔥Follow us for more signals 🔥
*Trade with us safely*

Live tradehello friends👋
✅️Considering the drop we had, now the price has reached an important and good support and the price is supported by the buyers, and the downward trend line has broken and the ceiling has been raised. Considering this, we entered into the transaction with capital and risk management.
🔥Join us for more signals🔥
*Trade safely with us*

Live trade hello friends👋
Considering the fall that we had, you can see that the buyers supported the price at the support point and caused it to grow. Now with the return of the price and the construction of an upward pattern, you can see that we can enter into the transaction with capital and risk management and move to the specified goals with it.💰
🔥Join us for more signals🔥
*Trade safely with us*

Sui update hello friends👋
✅️Considering the drop we had, now the price has reached an important and good support and the price has been supported by the buyers and the downward trend line has broken and the ceiling has been raised. Considering this, it was possible to enter into the transaction with capital and risk management and move to the specified goals with it.
🔥Join us for more signals🔥
*Trade safely with us*

TradeCityPro | Bitcoin Daily Analysis #121👋 Welcome to TradeCity Pro!
Let’s dive into the Bitcoin analysis and key crypto indicators. As usual, I’ll walk you through the triggers for the New York futures session.
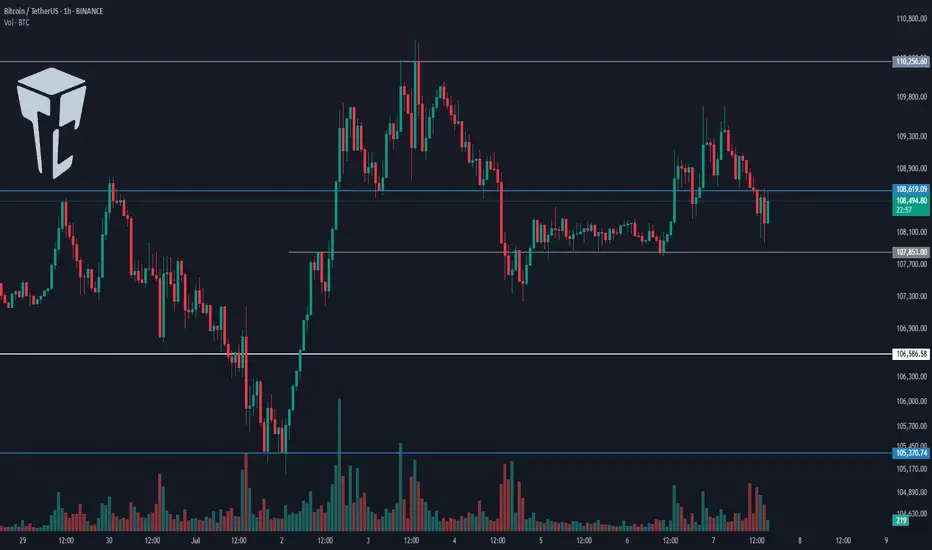
⏳ 1-Hour Timeframe
As you can see on the 1-hour timeframe, the upward move Bitcoin made yesterday turned out to be a fakeout, and the price is now heading downward.
⚡️ I’m not moving the 108619 line for now. I’ll wait to see if the price reacts to it again in the future, then decide whether to adjust it.
✅ Currently, if the 107853 level breaks, we can enter a short position. We already have volume confirmation, and if this increase in volume continues, we could see a sharp downward move.
📈 Next support levels for Bitcoin in this timeframe are 106586 and 105370, which can be used as targets.
✨ If Bitcoin starts moving upward again, the long trigger remains the 110256 level. A breakout here would mark the beginning of a true uptrend.
👑 BTC.D Analysis
Bitcoin dominance continued its downward move today, dropping close to the 65.04 level.
🔼 We’re currently seeing a reaction at this level, suggesting some support. A break below 65.04 could trigger a strong downtrend.
📅 Total2 Analysis
This index is still in an uptrend but showing significant weakness. It’s currently sitting on key support at 1.15.
⚡️ A break below this level could give us a short position. Additional support levels are 1.14 and 1.13. For a long position, the only trigger we have right now is 1.17.
📅 USDT.D Analysis
Looking at Tether dominance, it’s still hovering around the 4.78 level. After a brief fakeout below, it has returned above that zone.
📊 If this level breaks again, Tether dominance could move down toward 4.72.
❌ Disclaimer ❌
Trading futures is highly risky and dangerous. If you're not an expert, these triggers may not be suitable for you. You should first learn risk and capital management. You can also use the educational content from this channel.
Finally, these triggers reflect my personal opinions on price action, and the market may move completely against this analysis. So, do your own research before opening any position.
USDT Dominance Locked in Range – Altseason Not Ready Yet?USDT Dominance has been trading inside a wide sideways range for the last 567 days — bouncing between the 3.6% demand zone and the 6% supply zone.
The recent price action shows a rejection from the top of the range and now heading toward the mid or lower part of the channel. A minor trendline (in red) had shown some short-term support, but it looks weak now.
As long as this range holds, true altseason may remain on pause. The big move will come only when USDT.D breaks out or breaks down from this range.

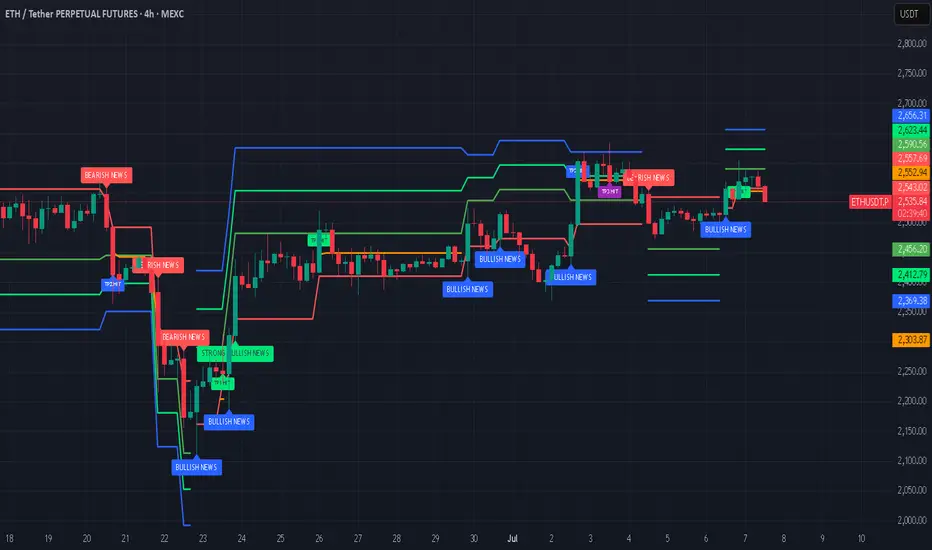
ETH - Should I go long?Ethereum (ETH) is currently positioned at a critical juncture, with multiple technical and fundamental indicators suggesting the potential for a significant move ahead.
Current Price and Momentum: As of the latest real-time data, ETH is trading at $2,549.97, having recently started a fresh increase above the $2,520 zone. The price is above both the $2,550 level and the 100-hourly Simple Moving Average, indicating short-term bullish momentum.
Key Resistance Levels: The immediate resistance is near $2,600, followed by $2,620 and a major barrier at $2,650. A decisive break above $2,650 could open the path toward $2,720 and potentially $2,800 in the near term.
Support Levels: On the downside, $2,520 is a key support zone. A sustained drop below this could trigger declines toward $2,500 or even $2,420, but as long as ETH holds above $2,520, the bullish structure remains intact.
On-Chain and Institutional Signals: Long-term holders have been accumulating ETH, and institutional inflows have surged, with over $750 million invested recently. This accumulation, alongside strong ETF inflows and rising staking activity, points to growing confidence and could act as a catalyst for a major price move.
Technical Patterns: ETH is consolidating above critical moving averages and within bullish chart formations (such as ascending triangles and coiling structures). These patterns often precede significant breakouts, especially when accompanied by increasing trading volumes and improving momentum indicators.
Market Sentiment: While short-term indicators show some cooling, the broader trend remains bullish. Analysts note that if ETH can break above the current resistance cluster, it could ignite a new wave of bullish momentum and set the stage for a broader breakout.
In summary: Ethereum is at a pivotal resistance zone. If it can break and hold above $2,600–$2,650, analysts expect a strong move higher, with targets at $2,800. Institutional inflows, strong on-chain accumulation, and bullish technical setups all support the case for a significant upside move in the coming weeks or months, provided key support levels are maintained.
Note that a possible correction of Bitcoin (which essentially will result in a drop of the entire crypto market) is possible in the next weeks.
#crypto #eth #btc #bitcoin #ethereum #analysis #trading #portfolio #long #algorithm #buysellsignals #tradingsignals #bullrun
TradeCityPro | WLD Builds Pressure Inside Long-Term Range👋 Welcome to TradeCity Pro!
In this analysis, I want to review the WLD coin for you. It’s one of the Privacy and Identity coins with a market cap of $1.5 billion, ranked 55 on CoinMarketCap.
⏳ 4-Hour Timeframe
In the 4-hour timeframe, a ranging box has formed for this coin between the 0.855 and 0.969 zones, and it’s been fluctuating within this range for several weeks.
📊 Volume is gradually decreasing within this box, which could indicate that a move is approaching.
⚡️ For now, we can say the volume slightly favors buyers, as the green candles have more volume than the red ones. Additionally, the size and strength of the green candles are greater, which increases the likelihood of the box breaking upward.
📈 If the price moves up toward the 0.969 zone with increased volume, we can enter a long position upon breaking 0.969.
✔️ Alternatively, if the price is supported at the 0.855 bottom, we could also open a long position—but it’s riskier, and in my opinion, not worth it. It’s better to wait for the main trigger to activate.
🔽 For a short position, if the price forms a lower high below 0.969 and then moves toward 0.855, we can open a short if 0.855 breaks. The next support zone would be 0.795.
📝 Final Thoughts
This analysis reflects our opinions and is not financial advice.
Share your thoughts in the comments, and don’t forget to share this analysis with your friends! ❤️

Bitcoin Bullish Continuation in Progress🔵 Bitcoin Weekly structure confirms higher highs & higher lows, reinforcing the bullish trend.
📈 As long as CRYPTO:BTCUSD holds above key support near $106K, the next leg could target $127K–$143K within the coming 2 months.

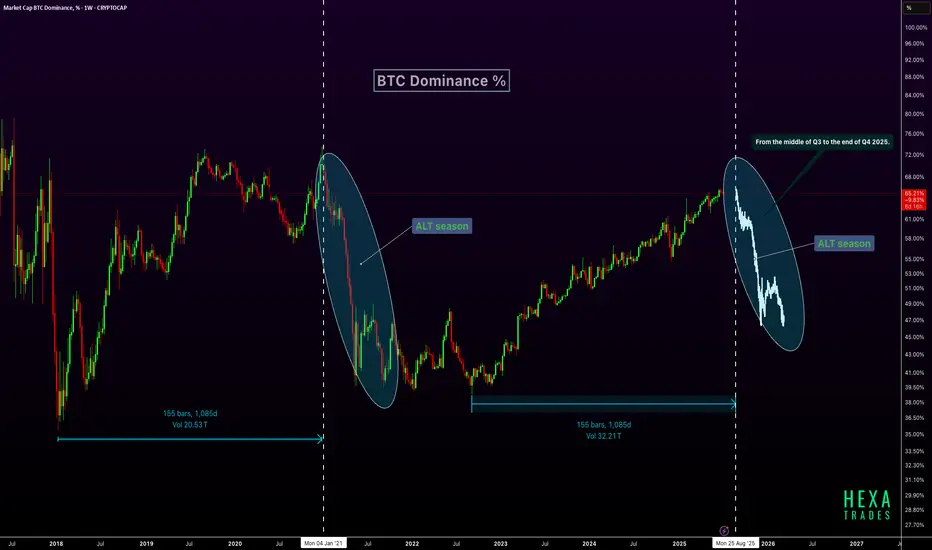
Altseason Ahead? BTC Dominance Cycle RepeatsBTC dominance is forming a pattern similar to the 2021 cycle, where dominance peaked after a long uptrend and then sharply declined, triggering a major altseason. Interestingly, that drop occurred after a 1,085-day rise, a time span we are once again approaching in 2025, projected to end around late August. If history repeats, BTC dominance could start declining from mid-Q3 2025, leading into a strong altcoin rally that may last through the end of Q4. This setup aligns with typical post-halving behavior, suggesting the final phase of the cycle could heavily favor altcoins.
CRYPTOCAP:BTC CRYPTOCAP:ETH CRYPTOCAP:XRP
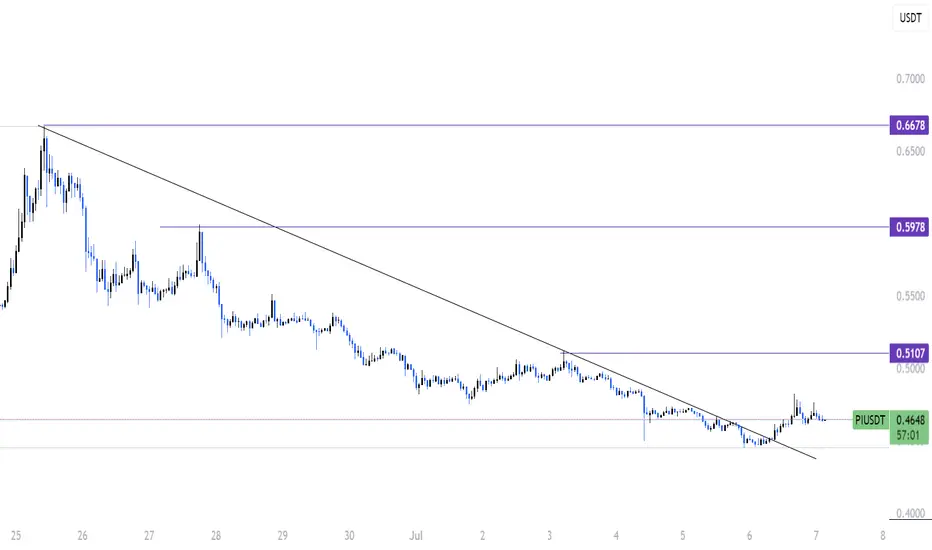
PI breakout from wedge and Trendline !!🚨 PI Breakout Update 🚨
Hey traders, hope you're all doing great!
Looks like PI just broke out of a strong trendline, and things are getting interesting.
We’ve seen solid support holding for a while, and now bulls are starting to wake up.
This move could be the start of something big if momentum continues.
Still early, but signs are pointing towards a possible bullish leg up.
Watch for a clean retest of the trendline — that could be your confirmation.
Volume is building nicely, and price action is starting to shift.
If you're tracking PI like I am, this is one to keep an eye on.
🔔 Follow for more updates and let's catch this move together!
ETH – Next Stop 3D 200MA?ETH on the 4H closed the week strong after holding support at the 0.5 Fib and 200-day MA.
If price holds here, it could attempt another push toward the 3D 200MA.
Let’s see how the week unfolds on the macro and political fronts.
Always take profits and manage risk.
Interaction is welcome.

ETH : BUY...Hello friends
Due to the entry of buyers and the breakdown of the trading range, we can buy in the direction of the trend and with capital and risk management within the specified limits and move to the specified targets.
*Trade safely with us*

CHZ LIMIT FOR BUY(FREE)Hello friends
Due to the price drop, we can buy on the drop within the specified limits and move with it to the specified targets, of course with capital and risk management.
*Trade safely with us*

SEI LIMIT FOR BUYHello friends
Due to the price drop, we can buy on the drop within the specified limits and move with it to the specified targets, of course with capital and risk management.
*Trade safely with us*

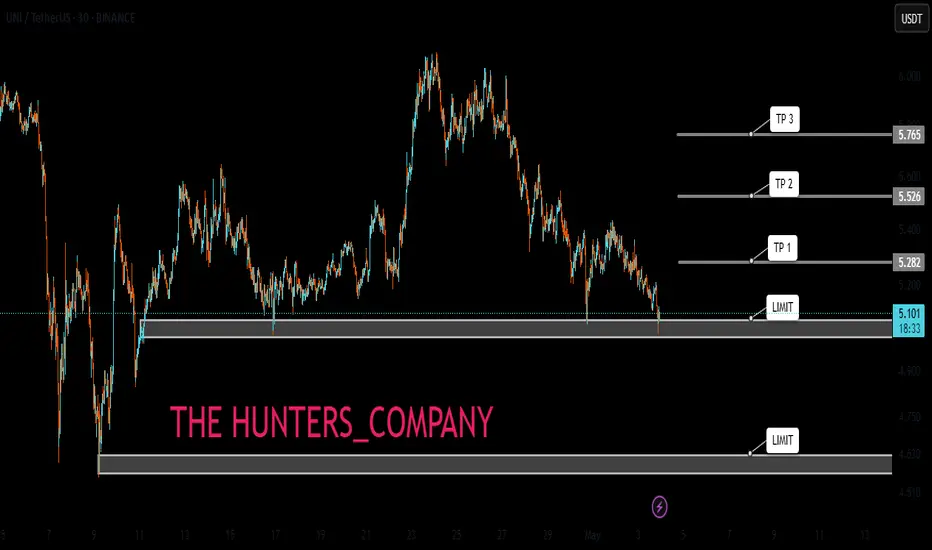
UNI:LIMIT FOR BUY(FREE)Hello friends
Due to the price drop, we can buy on the drop within the specified limits and move with it to the specified targets, of course with capital and risk management.
*Trade safely with us*
SUI SIGNAL...Hello friends
As you can see, buyers entered the price correction and a reversal pattern is being built...
Due to the buying pressure and the entry of buyers, we can buy within the specified ranges and move towards the set targets, of course with capital and risk management.
*Trade safely with us*

JTO : Price at a critical point: Falling or rising?Hello friends
Given the long-term range that this currency has made, the price has now reached the bottom of the range, which is very sensitive, and this currency also has a token release, which can be a warning.
In case of a drop, we have identified important supports for you, so that you can buy with risk and capital management.
*Trade safely with us*

MOVE : Where to buy ?Hello friends
Given the upcoming token release, the price is expected to continue to fall, so be careful.
In case of a fall, we have identified important support levels for you, where you can buy with capital and risk management.
*Trade safely with us*
