BTCBeen tinkering around with this count. Possibly an ending diagonal and we are now in the (3) intermediate wave position about to be finished with that wave in March or Feb
Cryptomarkets

BITCOIN PREDICTION - BTC GAME PLANI’d like to share my plan for BTC with you guys.
We’ve recently broken the bullish trendline that had been supporting the price for a while and maintaining the uptrend. This break occurred with strong momentum, which I consider a bearish signal.
However, there’s still a larger bullish daily trendline just below us. I expect a strong momentum push up from that level, so the current situation isn’t a major concern for me.
Here’s my outlook:
I anticipate a run on the equal lows just below the current price. This move should provide enough energy for the price to push up and retest the recently broken trendline.
That retest is likely to confirm the continuation of the bearish trend. If we fail to break above the trendline with momentum, I expect the price to fall below the December 5th wick and then get rejected.
This phase may create a ranging environment, potentially building momentum for altcoins.
Eventually, I anticipate testing the daily HTF bullish trendline, which should provide a strong rejection and begin the journey to new all-time highs.
This is my game plan based on my experience, and I’ll be monitoring the price closely to adapt if needed.
Key Notes:
I expect early January to bring strong bullish momentum across all crypto markets. For now, we’re in a choppy zone.
If BTC breaks back above the trendline we just lost, I’d expect the price to reach $99,500 and likely face rejection there.
Breaking above $100K would strongly signal a bullish trend. I’ll then watch closely for any rejection at the marked blue line and purple zone on the chart.
This is how I’m approaching the market. Manage your risk accordingly!

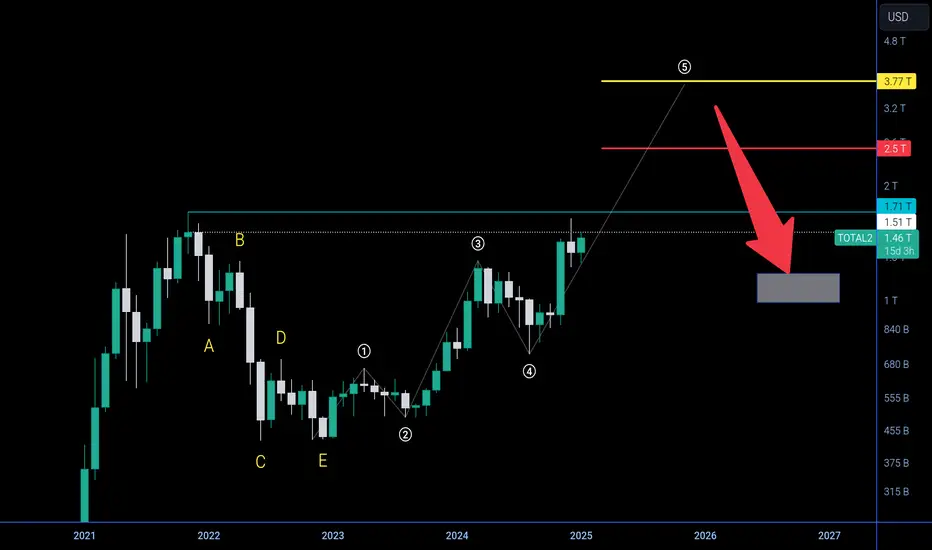
Total market cap 2 - macro analysis ( expect $BTCUSD ) Hi 👋🏻 it's me your " Raj_crypt0 " is back 🔙 🎩
CRYPTOCAP:TOTAL2 ( TOTALMAKETCAP2 ) crypto long run analysis ⏰ was here ..... ❣️
" It's important to close strong monthly above $1.71T " which makes bullish road clear "
🎯 ¹ - $2.5T ( 2.5 trilion dollars )
( When $2.5T was done before APRIL 2025 then , we aim for target 2 , if not it will turn as TOP 🔝 )
🎯 ² - $3.77T ( expecting potential TOP around 4 trillion dollar 💰 )
•
Note >>
don't think 🤔 all coins will complete " BULL RUN " 🔝 target's at index TOP 🎩
It depends on currency some complete " BULL RUN " at 1st target 🎯 some complete 💯 at 2nd target 🎯 INDEX ☝🏻 always show way to get exit and entry on entire portfolio 💰
( Yes 🙌🏻 i provided even " BEAR RUN " target 🎯 also but we can discuss later based on 🔝 )
Unpopular opinion; BTC at 100kShort and sweet; Btc is quite a bit oversold on the weekly rsi, and looks like it might be forming a bearish divergence. Price has hit the 1.618 reverse fib retracement. BTC hasn't traded above the red trend line, stretching back to the highs of 2017. Sad as it might be to say, we are at or very near the end of this run.

RENDER SWING LONG IDEA - RENDER COIN RENDER is one of the leading AI and DePIN projects in the crypto market. During the 2023-2024 altcoin bull cycle, this coin achieved a remarkable 10x return, so I recommend keeping a close watch on it.
Technical Analysis: The price recently hit the monthly demand and faced a rejection there during the August 5th dip. This rejection sparked an immediate bullish movement and shifted the weekly structure to bullish. The price also initially pulled back from a bearish trendline responsible for the downtrend since March 2024.
Recently, the price broke through this bearish trendline with strong momentum, highlighting the strength of the trend, and I’m interested in joining the trade after this breakout. My targets are set on the purple levels, and I expect potential upside in the coming months.
SL: $3.98
TP1: $6.80
TP2: $11.90
TP3: $13.80

"Bitcoin to $100K by 2024? Here’s Why $270K by 2030 Isn’t Far OfBitcoin is dancing around the $61K mark with intense volatility, but here’s where it gets exciting. I predict BTC will skyrocket to $100K by the end of 2024, riding the wave of bullish momentum from the upcoming halving event. Looking even further ahead? With institutional adoption ramping up, we could be staring at a jaw-dropping $270,593 per Bitcoin by 2030. This could be the start of something huge—what do you think? Let’s spark the conversation!

A Beginner's Guide for New TradersIntroduction to Cryptocurrency:
Cryptocurrency has become a major financial trend in recent years, attracting both experienced traders and newcomers alike. If you're just starting out, this guide will help you understand the basics of cryptocurrency and what it takes to start trading.
1. What is Cryptocurrency?
Cryptocurrency is a type of digital or virtual currency that uses cryptography for security. Unlike traditional currencies like the US dollar or Euro, cryptocurrencies operate on decentralized networks based on blockchain technology. This means that they are not controlled by any central authority, such as a government or bank.
The most well-known cryptocurrency is Bitcoin (BTC), but there are thousands of others, including Ethereum (ETH), Ripple (XRP), and Litecoin (LTC).
2. How Does Cryptocurrency Work?
Cryptocurrencies operate on blockchain technology, which is essentially a distributed ledger that records all transactions across a network of computers (nodes). These transactions are grouped into blocks and added to the blockchain, ensuring transparency and security. Since every transaction is verified by the network, there is no need for a middleman (like a bank), reducing transaction costs and increasing efficiency.
3. Common Types of Cryptocurrencies
Bitcoin (BTC): The first and most widely recognized cryptocurrency, often referred to as "digital gold."
Ethereum (ETH): Known for its smart contract functionality, Ethereum is a platform for building decentralized applications (dApps).
Stablecoins (USDT, USDC): Cryptocurrencies pegged to the value of traditional currencies like the US dollar, offering stability and reducing price volatility.
Altcoins: A broad term for any cryptocurrency other than Bitcoin. These include a wide range of coins like Litecoin (LTC), Ripple (XRP), and more niche coins such as Dogecoin (DOGE).
4. Why Trade Cryptocurrency?
High Volatility: Cryptocurrency prices can fluctuate dramatically, providing opportunities for traders to profit from price movements.
24/7 Market: Unlike traditional stock markets, cryptocurrency markets are open 24/7, allowing traders to trade at any time.
Global Accessibility: Cryptocurrencies are accessible to anyone with an internet connection, making it possible to trade from anywhere in the world.
5. How to Start Trading Cryptocurrency
To start trading cryptocurrencies, follow these steps:
Step 1: Choose a Cryptocurrency Exchange
A cryptocurrency exchange is an online platform where you can buy, sell, and trade cryptocurrencies. Some popular exchanges include:
Binance: One of the largest exchanges, offering a wide range of coins and trading pairs.
Coinbase: Known for its user-friendly interface, making it ideal for beginners.
Kraken: Offers a variety of coins and advanced trading tools.
Step 2: Create an Account
Once you've chosen an exchange, you'll need to sign up by providing your email and personal information. Most exchanges will require you to verify your identity before you can start trading.
Step 3: Deposit Funds
After creating your account, you can deposit funds into your exchange wallet. Most exchanges accept deposits via bank transfer, credit/debit cards, or other cryptocurrencies.
Step 4: Choose a Trading Pair
In cryptocurrency trading, you'll often be trading pairs, such as BTC/USDT (Bitcoin/US Dollar Tether). You'll be buying one currency while selling another. For example, if you believe Bitcoin will rise in value against the US dollar, you'd buy BTC/USDT.
Step 5: Place a Trade
There are two main types of trades:
Market Order: This is an order to buy or sell immediately at the current market price.
Limit Order: This is an order to buy or sell at a specific price. The trade will only execute when the price reaches your target.
6. Basic Trading Strategies
There are several strategies traders use to make profits in the cryptocurrency market. Here are a few basic ones:
HODLing: This refers to holding onto your cryptocurrency for a long period, regardless of market fluctuations, expecting it to rise in value over time.
Day Trading: Buying and selling within a single day, aiming to profit from small price movements.
Swing Trading: Holding onto an asset for several days or weeks, attempting to profit from short- to medium-term price movements.
Scalping: Making quick trades for small profits over a very short time period, often minutes or seconds.
7. Key Concepts for New Traders
Volatility: Cryptocurrency is known for its wild price swings. As a trader, you'll need to understand that prices can go up and down very quickly.
Liquidity: This refers to how easily an asset can be bought or sold without affecting the market price. High liquidity means you can trade larger amounts without causing significant price changes.
Market Capitalization (Market Cap): This is the total value of a cryptocurrency, calculated by multiplying the price by the total supply of coins. It gives a rough indication of the size and popularity of a coin.
8. Risks of Cryptocurrency Trading
Market Volatility: Prices can swing dramatically, leading to significant gains or losses.
Security Risks: Cryptocurrency exchanges and wallets are often targeted by hackers. Always use secure exchanges, enable two-factor authentication (2FA), and store your assets in a secure wallet (e.g., hardware wallet).
Regulatory Risks: Governments may impose regulations on cryptocurrency trading, which could affect the market.
9. Security and Wallets
When you're trading cryptocurrency, it's important to know how to secure your assets:
Exchange Wallets: These are provided by the exchange where you trade, but they can be vulnerable to hacks.
Software Wallets: Apps or programs where you store your cryptocurrency. They're more secure than exchange wallets but still vulnerable to online threats.
Hardware Wallets: Physical devices, such as Ledger or Trezor, that store your crypto offline, offering the highest level of security.
10. Tax Implications
In most countries, cryptocurrency profits are subject to taxes. Be sure to check your local tax laws and keep track of your trades for tax reporting purposes.
11. Start Small and Learn
If you're a beginner, it’s important to start small. Trade with an amount you're comfortable losing, as the cryptocurrency market can be unpredictable. As you gain more experience and understand how the market works, you can gradually increase your investments.
Conclusion
Cryptocurrency trading offers exciting opportunities, but it also comes with risks. Understanding the basics, choosing the right strategies, and being cautious are essential to becoming a successful trader. Keep learning, stay updated with market trends, and don’t rush into decisions without proper research.
#Crypto #Bitcoin #learn #Altseason #Bullrun2025

SAGA - Consolidation before price acceleration.# SAGA - Total3 - ETH/BTC
---------------------------------------------------------------------------------------------
SAGA is a cryptocurrency with a market cap of $160 million and a fully diluted market cap of $1.6 billion. It functions as a Layer 1 blockchain specifically designed for gaming. I included this coin this week because I see the potential for at least a 30% gain in the coming days or weeks. This coin is related to my publication from last week as I consider SAGA a SUI with a higher Beta. This means that SAGA is a coin that moves in relative tandem to SUI (discussed in my last publication) whilst being more volatile and sensitive to market movements.
**SAGA** - The price appears to be consolidating between a downward trendline (red) and an exponential trendline (green), forming a pattern of lower highs and higher lows. This suggests that the price is coiling up for a significant move.
If the price successfully breaks past the $1.90 level, there appears to be no further resistance until it reaches the W-pattern harmonic expansion at the 1.414 or 1.618 Fibonacci level. This corresponds to the corrective 0.618 or 0.786 Fibonacci retracement of the last impulsive wave down (see picture 1). This setup indicates a potential 30-60% price gain after surpassing the red downward trendline. (The strategy for entering the SAGA trade can be found at the end of this publication.)
**ETH/BTC** - The ETH/BTC pair is often considered a key indicator of the altcoin market's strength relative to Bitcoin. By analyzing ETH/BTC alongside TOTAL3 (the total crypto market cap excluding both BTC and ETH), we can look for confluence to determine if SAGA (and other altcoins) have the potential to move more rapidly in comparison to BTC.
On a macro scale, the ETH/BTC ratio appears to be forming a large triangular consolidation pattern. The upward trendline, which is expected to provide support, is positioned just below the 0.786 Fibonacci retracement level of the entire previous wave (see picture 1).
Zooming in (see picture 2), we can observe a hammer candle formed on high volume, which established the low of the current range (a bullish signal). At present, the price is holding at this range low and has filled the wick of the previously mentioned hammer candle. As long as the price does not break down from this range, it could quickly move towards the top of the range.
This suggests a higher likelihood of bullish price action for ETH and other altcoins, especially since it is rare for this ratio to increase while the prices of BTC and other cryptocurrencies decline.
**Total3** - TOTAL3 (the crypto market cap excluding BTC and ETH) is currently moving within a downward parallel channel, which can be a bullish indicator, much like BTC. The market cap bounced off the 0.886 Fibonacci level on August 5th, during a period of maximum fear, forming a hammer candle. Since then, it has also bounced from the 0.786 Fibonacci level, potentially creating a large W-pattern.
To support the idea that the altcoin market cap (excluding ETH) is gearing up for a bullish impulsive move, we can reference the "Three Waves to a Bottom" theory. This theory suggests that a market or stock typically undergoes three distinct downward waves before reaching a bottom. After the third wave, the price tends to stabilize and may reverse into an upward trend.
The movements in the Total3 market cap tend to suggest that more money will flow into the altcoins in the short to mid term. This should also benefit SAGA’s probabilities to have an acceleration in price.
**Trade Set-up**
In my opinion, I recommend 2 trade set-ups to enter in a SAGA long from the 14th of september onwards (Enter at White Arrow):
You wait for a breakout. Conservatively price should find resistance around 1.9$ and could retrace back to retest the trendline that has been serving as resistance since mid-Juli.
You wait for a breakout. If price does continue upwards, because crypto can move parabolically, even more when we consider the market cap of SAGA (=160M$) it is still probable that price will come down and retest the trendline that has been serving as resistance for 3months, the exponential trendline (green) that has been acting as support for even longer, or both as shown in the picture.
This is a repost from yesterday, hopefully the issue for the public post was the link at the foot of my previous publishment.
Have a nice weekend !
Zeddit


BNB UppdateSo it looks like we have a good setup for some friday Bleeding in the crypto market.
looking to short Bnb inside the imbalance.

VELOHonestly been reflecting on VELO a bit.
And if my CRYPTOCAP:TOTAL 3 analysis is correct and we get an XRP bull market to $5 plus soon then XLM will likely follow.
They trade 20-.30c different on any given trading day. Since VELO is on XLM block chain and if we get $2-$4 XLM $VELO can be right back at 2021 highs with a simple $7- SEED_TVCODER77_ETHBTCDATA:8B market cap. really doesn't seem unlikely to me.
Plus they are one of the few altcoins that are actually working on the Web 3 payment side in Asia with massive corporate and Gov connections.

Nine Spot ETFs Plunge ETH Prices. Will ETH Tank Further?The SEC approved the listing of nine spot ETH ETFs on 23/July. The launch of these ETFs was expected to drive capital flows with spot buying. But it didn’t. ETH prices plunged by 9% over the following two days. Crucially, the decline in the ETH/BTC ratio was a similar 9% as BTC remained resilient.
Following what appears to be a sell-the-news event, the outlook for ETH remains mixed as GETH outflows are more than offsetting inflows to the other ETFs.
The sharp price decline offers a buying opportunity. Take caution as the risk of further decline persists. Implied Volatility (IV) on puts increased while IV on call declined after spot ETF approvals.
ETH ETF APPROVAL ACCOMPANIED BY PRICE DECLINE
The SEC provided final approval for eight spot ETH ETFs to trade while also allowing the conversion of the ETHE trust to a spot ETF, making it nine spot ETH ETFs in total.
Source: Farside
ETH prices dropped by 1.3% on launch day clearly marking a "sell the news" event. ETH plunged nearly 9% over the next two days, returning to its 20/May levels. This earlier date in May marked the onset of rumors about the SEC's likely approval as covered previously .
Crucially, the ETH/BTC ratio also declined, highlighting the specific negative impact on ETH distinct from the broader crypto market.
OUTFLOWS FROM GRAYSCALE ETHEREUM TRUST DOMINATE NET ETF FLOWS
ETH prices were pressured down by massive net outflows led by fund movement out from Grayscale Ethereum Trust (ETHE) chiefly due to steep expense ratio. These outflows far outpaced the inflows to other ETFs.
Source: Farside
Grayscale offers a lower cost alternative in the mini ETH ETF (ETH), inflows into it are small and inadequate to stem the outflow from the much larger ETHE.
Launch of Spot BTC ETFs caused outflows from Grayscale Bitcoin Trust ETF (GBTC). Investors then switched over to lower cost ETFs. This time though, the net effect on ETH ETFs has been much more negative.
Crucially, outflows from GBTC continued for almost four months after spot ETF launch. ETHE outflows could also continue for a considerable period, dominating net flows in spot ETH ETFs for the foreseeable future.
CALL IV HAS DECLINED FOLLOWING ETF LAUNCH
IV skew for 25-delta options showed that calls were far more expensive than puts. This reversed sharply after the ETF launch on 24/July, making puts expensive relative to calls, signaling rising fears of pain for ETH prices in the near term.
Source: CME QuikVol
Though ATM IV has dipped somewhat following approval, it still remains elevated from last month.
Source: CME QuikVol
HYPOTHETICAL TRADE SETUP
ETH ETF launch has been a stark sell-the-news event. Prices have reversed gains. While spot buying may drive positive price action, recent flow analysis from ETH ETFs shows outflows from ETHE dominating.
Like GBTC, this trend could continue for many months, with inflows to other ETFs muted, the net effect may be higher selling pressure in the coming weeks.
Still, ETH prices have corrected sharply. It trades 12.5% higher from a major YTD support level and above the 200-day moving average. Consequently, ETH prices are unlikely to trend much lower from current levels. Breakout to the upside also remains unlikely in the near-term given the lack of major news flow.
A bullish put spread is an astute trade set up to harvest elevated put IVs amid a narrow trading range. A bullish put spread consists of a short put at a higher strike combined with a long put at a lower strike.
This position benefits from the net credit earned from the short put position net off the premium paid for the long put. Long put provides the crucial downside risk protection while also reducing the margin required.
The proposed hypothetical trade set up comprises of short 3100 put combined with a long 3000 put on CME Micro Ether Options expiring in August.
While the position offers a fixed upside and downside, it is crucial to note that the maximum loss for this position (USD -6.5) is higher than the maximum profit (USD 3.5). As such, the position would lose money in case the present downturn in ETH prices continues.
MARKET DATA
CME Real-time Market Data helps identify trading set-ups and express market views better. If you have futures in your trading portfolio, you can check out on CME Group data plans available that suit your trading needs www.tradingview.com
DISCLAIMER
This case study is for educational purposes only and does not constitute investment recommendations or advice. Nor are they used to promote any specific products, or services.
Trading or investment ideas cited here are for illustration only, as an integral part of a case study to demonstrate the fundamental concepts in risk management or trading under the market scenarios being discussed. Please read the FULL DISCLAIMER the link to which is provided in our profile description.

$FIDAUSDNot financial advice.
COINBASE:FIDAUSD
Weekly candle chart trying for the second time to break this downtrend.
time will tell.
Like and follow for more ideas.
Thanks.

ZRX - BuyA suitable position for #ZRX in the strong support range and the chance of price return with a fluctuation of about 10% from this area.

BTCUSD falls and starts recovery after geopolitical spike LONGBitcoin on a 30 minute chart fell with reports of the Israeli active retaliatory strikes in the
heart of Iran's military and industrial infrastructure in a unilateral action. Iraq has not launched
a responsive action as yet. On the chart, price had been stable and sideways in the 64000
range but fell to about 6000 and then recovered to nearly 62,000. I see this as an opportunity
to buy BTCUSD at a 3-4% discount going into the halfing period. I will add to a long position.
It end up being averaging down or in the alternative getting a solid base for the run up that
pundits say will soon come. My initial target to take profit on 10% of the position and raise the
stop loss, based on a Fibonacci level is 66800.

Bitcoin: Thoughts and Analysis Pattern – HL building?
Support – 63,860, 60,675
Resistance – 66,710
Hi, traders. Thanks for tuning in for today's update. Today, we are looking at BTC on its daily chart.
Today, we have broken down the current PA we are watching on BTCUSD.
Two things have presented themselves to us. Could we have a new HL forming after yesterday's fightback? Could this then set off a new leg higher to test the top of the range?
Or two, could this be a false point of support, and will we see sellers make a new move at testing lower-range support?
Good trading.

Can Bitcoin break resistance and head to 75K LONGBTCUSD is impending on its third attempt to break through the resistance zone of 69-70K,
having hit about 72K on March 13th. Buying volume relative to selling remains high. Both
the faster and slower RSI lines remain above 50. I amd holding my long position in BTCUSD
and watching to see if price can break resistance. If it can another leg higher could begin.
So, if the break occurs, I will add substantially to the position

LINK/USDT ⛓️ Hey hey! I'm scaling into some NASDAQ:LINK here and @ the next fib level also
Don't be afraid of the opportunity ✨️
See you on the other side of profits 📈

ALGOUSDT-4H candle-Dow TheoryALGOUSDT Implementing Dow Theory 4 hours candle analysis
#dowtheory #algousdt #cryptoanalysis

BELUSDT.PBELUSDT is bullish but it sweep PDH and closing below it. In 15minutes chart it sweeps high and break its recent low and it indicates structure shift, I will be target nearest target for achieving 1:2 risk to reward. Best of Luck, not a financial advice.

BTCUSDBitcoin is sceduled to be halved April 20th, 2024 which will continue to soar. For now, these levels provide the next bullish wave.

MARA fell on a huge earnings beat LONGMARA fell a few days ago while Bitcoin is staging another leg higher along with other coins.
On the 30-minute chart, MARA is in undervalued territory below the mean-anchored VWAP
and near to the bottom of the high volume area on the volume profile but above the POC line.
This seems to be an obvious long trade for me to take. I will set a stop loss of $1.00 below
market price and a target of $31 halfway between the mean VWAP and the first upper VWAP
the line above it. A call option trade striking $30.00 expiring in three months will be
considered. MARA fell from excellent earnings which apparently disappointed some
traders /investors. The discount sale is hard to resist given the current fundamentals in the
crypto markets.

MSTR oversold for a long tradeMSTR is now oversold but has a great earnings beat and the cryptomarkets surging to support
a bullish idea. The 15 minteu chart shows price sitting on support of the POC line of the
immediate volume profile. With confluence, it is above a fully horizontal lower VWAP line
that has no slope. Support and resistance horizontal zones are drawn in for reference purposes.
I will close my short position of the past day and switch sides here. The RSI indicator gives
reassurance as it has pivoted up from the bottom, especially the faster green line. Selling
volatility declared the bottom in the immediate term at the same time the relative volume
indicator printed a selling volume spiking black bar both immediately before the regular
market closed.
