State of Wisconsin Invests in Spot BTC ETFs
BTC, ETH jump after inflation eases: The Consumer Price Index jumped 0.3% in April, ending three consecutive months of elevated inflation readings and lifting hopes of a rate cut later this year. Bitcoin and ether prices rallied 7.6% and 5.3% Wednesday.
Roaring Kitty returns, sending meme coin soaring: Vince Gill, the meme stock leader who rose to fame in 2021 under the pseudonym “Roaring Kitty,” announced his return on Twitter/X on Monday. Shares of Gamestop and AMC soared the next two days before retreating. But one meme coin reaped the benefits.
US Senate overrules SEC: The US Senate voted 60-38 on Thursday to override an SEC rule that requires crypto custodians to treat customer assets as liabilities. But President Joe Biden is expected to veto the measure, and the US House has work to do to get the two-thirds majority needed to override the veto.
Wisconsin becomes BTC Bull: The State of Wisconsin Investment Board revealed in a filing Tuesday that it had amassed roughly $162 million worth of shares in spot BTC ETFs with BlackRock and Grayscale. It marked the first time a state pension fund publicly declared an ownership stake in spot BTC ETFs.
US Senators upset over crypto mixer treatment: US Senators Cynthia Lummis (R-Wyo.) and Ron Wyden (D-Ore.) have sent a letter to the US (DOJ) contesting a recent decision from FinCEN that said it would treat crypto mixers as money transmitters, opening up software developers to potential charges.
New Vanguard CEO not rushing into crypto ETFs: Vanguard named Salim Ramji as its new CEO on Tuesday, raising speculation that the former BlackRock executive would introduce a Vanguard spot BTC ETF after Ramji oversaw the launch of iShares Bitcoin Trust at BlackRock. However, Ramji cast doubt on launching a Vanguard spot BTC ETF in an interview with Barron’s.
🎮 Topic of the Week: What is a short squeeze? The GameStop saga
👉 Read more here
Cryptonews

Quick Bitcoin Update and Revealing Exclusive Research to allHello Traders,
Checkout the latest update on Bitcoin and ETH. Also in this video i have revealed our exclusive research on Bitcoin and ETH.

BTC upside potential for the next 24 hours and one week ☀️Hundreds of firms disclosed investments in the spot Bitcoin ETFs
With the first quarter earnings season coming to an end and the deadline for regulatory filings expiring, a slew of financial institutions have disclosed their equity and crypto holdings. Interest in the 11 exchange traded funds (ETFs) approved by the Securities and Exchange Commission (SEC) was high.
At least 317 firms have disclosed investments in BlackRock’s NASDAQ:IBIT ETF, and at least 502 firms have disclosed investments in AMEX:GBTC , Grayscale’s Bitcoin trust that was converted into an ETF, CryptoSlate reports citing Fintel data.
Bitcoin rallied to a three-week high above $66,000, Trading View’s Bitcoin chart shows. The sharp upturn triggered the liquidation short positions exceeding $100 million. The price of Bitcoin climbed 5.83 percent to $66,327 over the past 24 hours.
ATTMO forecasts bullish sun to shine over Bitcoin in the next 24 hours, indicating upside potential. This bullish trading mood is set to continue across the board over a one-week time horizon.
Follow us for more crypto news and weather reports!

Quick Bitcoin UpdateHello traders,
Checkout the latest update on Bitcoin. As expected rejected from resistance. Checkout the last video also

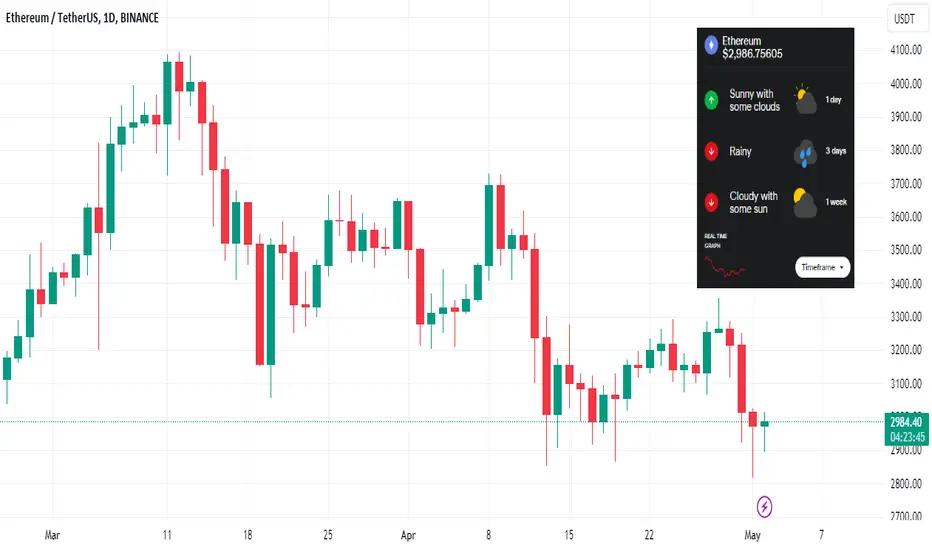
ETH to Drop Further 📉; Clouds ☁️ & Rain On the Horizon 🌧️SEC postpones yet another decision on a spot Ether ETF application 🙄
The Securities and Exchange Commission (SEC) has postponed its decision regarding the application of Invesco Galaxy’s spot ETH ETF to July 5.
The US regulator had already delayed its decision regarding Van Eck’s similar application to May 23 and that of Franklin Templeton’s to June 11. Few analysts expect an approval on these three dates.
The price of Ether dropped 3.37 percent to $2,947 over the past 24 hours. ATTMO forecasts clouds and rain for the next 24 hours and 7 days, signaling a likely downside for Ethereum.
Follow us for more crypto news and weather reports!


Triangle Pattern formed & Breakout, Next Kill 2 to 3 zerosIn SHIB/USTD, Triangle Pattern formed and Breakout. I have attached 3 images, before Breakout the Triangle Pattern and during the Breakout Triangle Pattern. Now SHIB in retracement phase, after completing the retracement, SHIB will continue its Up Trend and reach the "Previous High". Then SHIB will likely remove 2 to 3 Zeros. I have been continuously following SHIB for the last 3 years.

In Bitcoin Identified Harmonic Pattern and TargetIdentified Harmonic Pattern and target. If Breakout the Resistance Zone, it may reach the Harmonic Pattern Target or Simply "Respect" the top Trendline.

Quick Bitcoin Update - 5 May 2024Hello Traders,
This is quick update on itcoin , Ethereum and Alt Coins. Also suggested to keep an eye on new coins

BTC Upside Over the Next 24 Hrs ☀; Price to Drop Next Week ☁️The price of Bitcoin rallied 3.8 percent to $59,568 over the past 24 hours.
“#Bitcoin's market value has rebounded to $59.3K, and the percentage of the network's available supply in profit is at 84.4%. This CRYPTOCAP:BTC ratio is at its lowest level in 2 months. Lower levels generally justify more #bullish conditions,” the crypto intelligence firm Santiment said.
But not everyone is optimistic. Standard Chartered’s Head of Digital Assets Research, Geoffrey Kendrick, forecasts that the price of Bitcoin could drop to between $50,000 to $52,000, Bitcoin.com reports. The price of Bitcoin has ranged between $56,900 and $64,400 over the past week, Trading View’s Bitcoin chart shows.
Meanwhile research carried out by Fidelity Digital Assets shows that Bitcoin’s volatility is decreasing, even though the above trading ranges seem to contradict these findings.
A bullish sun shines over all crypto tokens covered by ATTMO in the next 24 hours, signaling upside potential. Over a one-week horizon, the trading forecast is mixed with Bitcoin, Ether, Litecoin, Avalanche and Binance Coin set to face bearish clouds, indicating downward pressure. Dogecoin, Cardano, Ripple’s XRP and Polygon should, however, continue to profit from the bullish sun.
Follow us for more crypto news and weather updates!

ETH Slightly Bullish 24-Hours ☀, Bearish ☁️ & Downside Next WeekIn the US, there were outflows from the spot Bitcoin exchange traded funds (ETFs) for the sixth consecutive day. “We have seen six consecutive days of outflows, and as the average entry price ($57,300) approaches the current spot price ($59,800), we will likely see more ETF unwinding. Since March 18, the ETFs have seen outflows on 58% of all trading days,” 10x Research said in its daily note.
“This will likely lower prices to our target levels and cause a -25% to -29% correction from the $73,000 top - hence our price target of $52,000/$55,000 during the last three weeks,” the crypto research company forecasts.
In Hong Kong, the first trading day of the spot Bitcoin and ETH ETFs approved proved to be a cold shower with only $12 million flowing into these new ETFs. Analysts had expected up to $300 million. The price of Ether fell 2.5 percent to $2,918 over the past 24 hours.
A slightly bullish sun shines over Ethereum and ATTMO signals a potential upside over the next 24 hours. Over a one-week horizon, bearish clouds are likely to sweep over most of the cryptoverse putting pressure on Ethereum, indicating a potential price drop.
Follow us for more crypto news and weather reports!
BTC Bearish 7-Day Forecast - Drop to $55K Imminent? The cryptocurrency trend was sharply negative over the past 48 hours, triggering liquidations exceeding $500 million over the past two days. The price of Bitcoin fell below $57,000, to a two-month low, as the Federal Reserve slashed hopes of rate cuts any time soon.
Inflation remains stuck at high levels, the Fed’s Chairman, Jerome Powell said, after keeping the US’ central bank’s benchmark rate unchanged at a 23-year high. An interest rate cut have is not likely to take place before September.
Analysts now await the release of the US April job figures tomorrow afternoon. The number of new jobs created is expected to have slowed down to 243,000 compared to March.
The price of Bitcoin lost 4.3 percent to $57,500 over the past 24 hours, to a level not seen since the end of February, Trading View’s Bitcoin chart shows.
🌤️ Mixed trading conditions lie ahead for the global crypto market in the next 24 hours, with bearish clouds lingering over Bitcoin, Cardano and Binance Coin, indicating further downside pressure. A bullish sun will, however, shine over Ether, Avalanche, Ripple’s XRP and many other altcoins covered by ATTMO.
🌥 Over a one-week horizon, bearish clouds are likely to sweep over most of the cryptoverse putting additional pressure on Bitcoin, Ether, Cardano… Dogecoin, Polkadot and Polygon are set to buck this negative trend as bullish sun is forecast to shine over them over the coming week.

Time to load up ETH longsETH/USDT has entered weekly fibs zone.
With HK ETHETF, asian insto's money might trigger a push on eth.
Locking in buy limits at 3032, all the way to 4092

BTC drops further in the next couple of days; rebound next weekThe cryptocurrency trend was mixed over the past 24 hours ahead of the Federal Reserve’s interest rate decision tomorrow. The benchmark interest rate is expected to be left unchanged at 5.25 percent; a 23-year high.
Investors will instead carefully analyze the wording about its future path. Some analysts expect three rate cuts later this year, while others forecast one or none as inflation concerns have reemerged in recent weeks. High interest rates do not support risky assets such as cryptocurrencies.
Meanwhile, the outflows from the largest spot Bitcoin exchange traded funds (ETFs) approved in the US continued for the fourth consecutive day. Last week, digital investment products (including the above-mentioned ETFs) saw outflows for a third consecutive week, the asset manager CoinShares reports. The majority of the outflows were recorded by the incumbent Grayscale ETF, GBTX, which was converted into an ETF in January.
The price of Bitcoin has dropped almost 10 percent over the past month, Trading View’s Bitcoin chart shows but rose 1.3 percent to $63,128 over the past 24 hours.
Bearish clouds linger over Bitcoin, Litecoin, Ripple’s XRP, Cardano, Avalanche and the other altcoins covered by ATTMO in the next 24 hours, signaling downside pressure. The sun will break through for Bitcoin not before the next week.
Follow us for more crypto news and weather reports!

ETH to 2,800 in the next 3 days ☁️, then rebound?May approvals of spot ETH ETFs in the US seem out of question. The meetings held between the asset managers that have filed spot Ether ETF applications and the Securities and Exchange Commission (SEC) have been one-sided and discouraging, CryptoSlate reports. This is in stark opposition to the meetings held ahead of the SEC’s approval of spot Bitcoin ETFs in January, when the regulator had provided significant feedback on the applications. The price of Ether dropped 3.4 percent to $3,208 over the past 24 hours.
☁️ Bearish clouds linger over the global crypto market, including Bitcoin and Ether, in the next 24 hours, indicating downward pressure. Over a one-week horizon, this low pressure will remain over Ripple’s XRP, Litecoin, Cardano, Binance Coin and Uniswap.
🌤️ Bullish trading conditions will, however, prevail over Bitcoin and Ether in the coming week, as the sun manages to break through the bearish clouds, ATTMO shows.
Follow us for more crypto news and weather reports!

BTC down for the next 3 days ☁️ upside potential only next week The price of Bitcoin fell 2.4 percent to $62,416 over the past 24 hours. Its price now trades 15 percent below its all-time high reached 1 ½ month ago, Trading View’s Bitcoin chart shows.
Plans by the Swiss cryptoverse to push for the addition of Bitcoins to the alpine country’s currency reserves seem shattered following comments made by the head of the Swiss National Bank. Thomas Jordan not only expressed skepticism during the SNB’s annual general meeting held last week, but also added that adding Bitcoin could raise the country’s CO2 emissions.
☁️ Bearish clouds linger over the global crypto market, including Bitcoin and Ether, in the next 24 hours, indicating downward pressure. Over a one-week horizon, this low pressure will remain over Ripple’s XRP, Litecoin, Cardano, Binance Coin and Uniswap.
🌤️ Bullish trading conditions will, however, prevail over Bitcoin and Ether in the coming week, as the sun manages to break through the bearish clouds, ATTMO shows.
Follow us for more crypto news and weather reports!

BTC Short-Term Bearish ☁️, Upside Potential Next Week ☀️Cryptocurrencies traded mixed over the past 24 hours, as investors are awaiting news that could give a clear direction to the cryptoverse following Bitcoin’s halving a week ago. Its price has since then risen 3.2 percent, Trading View’s Bitcoin chart shows.
Yesterday, the 71-day streak of consecutive inflows into BlackRock’s spot Bitcoin exchange traded fund (ETF) NASDAQ:IBIT ended. Its ETF has nevertheless managed to attract a staggering $17.7 billion in assets under management since its launch in January. The price of Bitcoin was unchanged at $64,345 over the past 24 hours.
ATTMO forecasts mixed trading conditions for the global crypto market in the next 24 hours, with Bitcoin, Litecoin, Cardano and Avalanche facing bearish clouds, signaling downward pressure. A bullish sun, however, shines over Ethereum, Ripple’s XRP and Polygon, indicating a potential upside.
Over a one-week horizon, this bullish sun will also shine over Bitcoin, Litecoin and Polkadot. Bearish clouds will linger over Binance Coin, Uniswap, Cardano and Avalanche.
Follow us for more crypto news and weather updates!

BTC ☀️ & Bullish Vibes On the Horizon. $70K Again? The cryptocurrency trend was mixed over the past 24 hours, as investors await the quarterly results of a series of tech giants later today and this week. The price of Bitcoin rose 0.6 percent to $66,490 over the past 24 hours. This is 10 percent below its all-time high, Trading View’s Bitcoin chart shows.
“I think we’re just getting started and bitcoin is going to have a great next 12 months,” Bitwise analyst, Ryan Rasmussen, is quoted as saying by Bitcoin.com. However, the regulatory risks should not be underestimated, he added.
A bullish sun shines over most of the global crypto market in the next 24 hours. Tropical trading conditions prevail over Bitcoin, which translates into a slight upside potential. Ripple’s XRP, Avalanche and Chainlink face bearish clouds, signaling downside risks.
Over a one-week horizon, the bullish sun should continue to shine over the cryptoverse, with the exception of Binance Coin and Uniswap, which all face bearish clouds.
Follow us for more crypto weather reports and crypto news!

ETH - ☀️ & Slightly Bullish for the Week AheadLast week, three issuers obtained approval to launch spot Bitcoin and Ether ETFs by Hong Kong’s Securities and Futures Commission (SFC). These new funds will start trading on April 30, according to various sources, including 10x Research.
The approval of the first spot ETH ETFs in the US next month does, however, seem unlikely.
“Eerily quiet on spot eth ETFs… Consensus is SEC will disapprove in May. Reason = lack of engagement w/ issuers. Logic says that’s correct, but also wonder if SEC learned lesson from clown show w/ spot btc ETFs. Either way, options are either A) approve or B) face lawsuit IMO,” said Nate Geraci, the co-founder of the ETF Institute.
The price of Ether fell 1.1 percent to $3,187 over the past 24 hours.
A bullish sun shines over most of the global crypto market in the next 24 hours. Mostly sunny trading conditions prevail over Ethereum, which translates into a slight upside potential. Ripple’s XRP, Avalanche and Chainlink face bearish clouds, signaling downside risks.
Over a one-week horizon, the bullish sun should continue to shine over the cryptoverse, with the exception of Binance Coin and Uniswap, which all face bearish clouds.
Follow this account for more crypto news and weather reports!


BTC - ☀️ & Bullish Potential For The Next Week A very strong sun shines over Bitcoin and Chainlink in the next 24 hours, indicating some upside potential lying ahead. Other altcoins, including Ether, Ripple’s XRP and Cardano will also profit from this bullish trend, while Litecoin and Uniswap face bearish clouds.
These sunny bullish trading conditions should prevail over the cryptoverse the coming week, as leading tech companies will announce their quarterly results. Avalanche, Binance Coin and Uniswap won’t profit from this bullish mood and face bearish clouds, which signal downside risks.
“A massive supply shock is coming. With the Bitcoin halving, miners can now only produce 450 BTC each day. The ETFs in the US have bought up around 3,214 BTC on average each day. This number could increase significantly when Hong Kong ETFs start trading,” the crypto profile Lark Davis said.
Analysts at leading banks disagree on whether the price of Bitcoin will continue up following Friday’s halving. Deutsche Bank expects prices to “stay high due to expectations of future spot ether (ETH) ETF approvals; future central bank rate cuts; and regulatory changes” but do “not expect them to increase significantly,” Bitcoin.com reports.
Follow us for more crypto news and weather reports!

BTC.D is an important aspect of the markets to watch right now.While BTC is making new lows today on this pullback - many alts including eth and solana are above their Saturday lows still.
Reason being- BTC.D rejected off the 57% level and is pulling back today, which has been allowing alts to hold stronger than BTC itself.
This could go two ways from here— now that BTC.D is at support, it either bounces and alts begin suffering once again, or it moves down to the 55% level and if lost, could provide some nice altcoin bounces in the next coming weeks if BTC can at the very least chop sideways
Bitcoin dominance is an indicator that has served me well over time as you all have seen, and i encourage you guys to check it out every once in a while.

ETH Faces Bearish ☁️ & 🌧️ In the Next 7 Days - CAUTION! Eight of the top 10 best performing ETFs last week were digital currency funds, largely led by Ethereum futures funds, eft.com writes in its daily note. The best performing fund was ProShares’ Ether Strategy ETF (EETH), which gained 12 percent. This ETF manages a total of roughly $63 million in assets.
EY, one of the four major accounting firms, has launched a contract management solution based on Ethereum’s blockchain, CryptoNews reports. “Deploying on a public blockchain is not only cheaper, but also much more scalable, helping enable many-to-many integrations on an open platform with no one company having an unfair advantage by controlling the network,” EY’s global blockchain leader, Paul Brody, is quoted as saying.
Mixed trading conditions lie ahead for the global crypto market in the next 24 hours, with bearish clouds linger over Ether, Avalanche and Uniswap, signaling downside risks. However, Bitcoin, Binance Coin, Cardano and Ripple’s XRP will be profiting from a bullish sun and upside potential.
Follow us for more crypto news and weather reports!
