1-Week Forecast: BTC, BNB, ADA ☀️ ETH, XRP ☁️? The sun keeps shining ☀️ on the global cryptosphere, promising a slightly bullish market with upside potential in the next 24 hours. However, Ripple’s XRP and Polygon’s Matic encounter some clouds ☁️, signaling a potential downside trend.
Looking ahead over the next week, the forecast is mixed with cloudy weather ☁️ for altcoins like Ether, Litecoin, XRP, and Matic. On the other hand, Bitcoin, Binance, and Cardano enjoy sunnier trading conditions ☀️, suggesting a continued upside potential.
Follow us for more crypto weather insights!
Cryptonews

BTC - Sunny Outlook ☀️; XRP, ETH, LTC - ☁️ Looming? The sun is back and shines on the global crypto market ☀️, signaling a slightly bullish market with upside potential in the next 24 hours. XRP, however, faces cloudier trading conditions ☁️, indicating a slightly bearish market with downside risk.
Over a one-week horizon, the conditions are mixed with continued sun over Bitcoin and Binance. Other altcoins such as Ether and Litecoin are likely to face less favorable trading conditions, according to ATTMO forecasts.
Follow us for more crypto weather reports!

☀️ Shines on the Market, But XRP Faces ☁️ OutlookThe sun is back and shines on the global crypto market ☀️, signaling a slightly bullish market with upside potential in the next 24 hours. XRP, however, faces cloudier trading conditions ☁️, indicating a slightly bearish market with downside risk.
Over a one-week horizon, the conditions are mixed with continued sun over Bitcoin and Binance. Other altcoins such as Ether and Litecoin are likely to face less favorable trading conditions, according to ATTMO forecasts.
Follow us for more crypto weather reports!

Comp Pig PUMP Coming Looks like BCH BINANCE:COMPUSDT
Comp Pig PUMP Coming Looks like BCH
Another attempt to break the range high here.

IRIS Looks Good with Falling Wedge IRIS Looks Good On Support area with Falling Wedge Keep eye on it
HOW TO IDENTIFY A FALLING WEDGE PATTERN
The falling wedge pattern is interpreted as both a bullish continuation and bullish reversal pattern which gives rise to some confusion in the identification of the pattern. Both scenarios contain different market conditions which must be taken into consideration.
The differentiating factor that separates the continuation and reversal pattern is the direction of the trend when the falling wedge appears. A falling wedge is a continuation pattern if it appears in an uptrend and is a reversal pattern when it appears in a downtrend.
Continuation or (Reversal) Pattern:
Identify an uptrend or (downtrend)
Link lower highs and lower lows using a trend line. The two lines will slope downwards and converge
Look for divergence between price and an oscillator like the RSI or stochastic indicator
Oversold signal can be confirmed by other technical tools like oscillators
Look for break above resistance for a long entry
Key points to remember:
Identification of the trend is crucial
Both continuation and reversal scenarios are inherently bullish
Both patterns present favourable risk to reward ratios as they generally precede big moves

BTCUSD Break-Out Retraction SignalWe expect #Bitcoin to take bullish turn after upcoming Inflation Rate announcement.
Our Probability Indicator observing completion of Bearish Reversal pattern on 1D Timeframe and indicates another leg into bullish pattern continuation.

XRP, BNB 🌧️ In the Next 24H! ETH, DOGE, LTC 1-Week Outlook ☁️? The sun will continue to shine over the global crypto market 🌞 , overall signaling a slightly bullish market with upside potential in the next 24 hours. Binance and XRP ☔️ buck this positive trend, with a downtrend likely.
Over a one-week horizon, the forecast is mixed with the positive trend continuing for Bitcoin. Other altcoins, such as Ethereum, Dogecoin, XRP, and Litecoin, may face cloudy days ☁️, indicating a bear market with a slight downward trend. 📉
Follow us for more crypto weather insights!

Is BNB Heading for a Downtrend? ☔️The sun will continue to shine over the global crypto market 🌞 , overall signaling a slightly bullish market with upside potential in the next 24 hours. Binance and XRP ☔️ buck this positive trend, with a downtrend likely.
Over a one-week horizon, the forecast is mixed with the positive trend continuing for Bitcoin. Other altcoins, such as Ether, Dogecoin, XRP, and Litecoin, may face cloudy days ☁️, indicating a bear market with a slight downward trend. 📉
Follow us for more crypto weather insights!

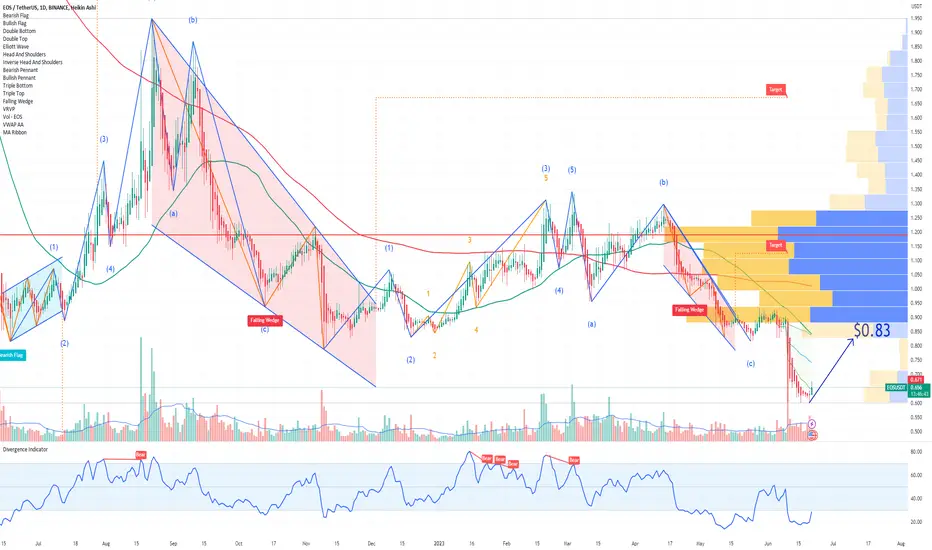
EOS Potential ReversalEOS cryptocurrency is currently displaying signs of a potential reversal. The price action suggests that the downward trend may be coming to an end, and a bullish turnaround could be in the cards.
Based on this analysis, my short-term price target for EOS is the $0.83 resistance level.
Looking forward to read your opinion about it.
BTC ☀️ Trading Conditions; XRP - 🌧️ Ahead? The crypto summer is here to stay, with sunny trading conditions ☀️ reigning, ATTMO’s short-term and one-week forecast shows. This signals that a slightly bullish market with upside potential is likely for Bitcoin and most cryptocurrencies. 📈✨
Ripple’s XRP, on the other hand, bucks this positive trend ☔️, with rainy trading conditions 🌧️ ahead. This translates to a bear market 🐻 with a downward trend. 📉
Follow us for more crypto weather reports!

☀️ Skies for Bitcoin & Binance, ☁ Outlook for Ether and AltsSunny weather with a few scattered clouds lies ahead for Bitcoin and Binance in the next 24 hours ☀️, painting a slightly bullish market outlook as investor interest in the crypto sphere remains strong.
However, Ether and many other altcoins face cloudy ☁ or even rainy conditions🌧️, signaling a bearish trend with downside risks.
📈 Over a one-week horizon, ATTMO predicts prevailing sunny trading conditions across most of the crypto market.
Follow us for more crypto weather reports!

Crypto Summer Thrives! 🌞 1-Week Forecast Unveiled! 🌧️/ 🌞 ? The crypto summer is in full swing with sunny skies ahead! 🌞 🚀 Sunny weather is ahead in the coming hours as well as over a one-week horizon.
Asset managers' ETF applications are fueling the demand for Bitcoin, paving the way for an exciting market outlook. We can anticipate additional players, such as Fidelity, filing their applications in the near future. 📈
These favorable conditions signal a slightly bullish market, presenting potential upside opportunities for the crypto sphere as a whole.
Follow ATTMO Times to stay ahead of the curve!

MicroStrategy Bitcoin PurchasesMicroStrategy Bitcoin Purchases on the CRYPTOCAP:BTC chart.
This chart includes the dates, amount, and average price, of Bitcoin purchases announced by Michael Saylor on Twitter and includes data from buybitcoinworldwide.com for purchases not announced by Michael Saylor.

Crypto Summer Sizzles On! 🌞 But What's the 1-Week Forecast?The crypto summer is in full swing with sunny skies ahead! 🌞 🚀 Sunny weather is ahead in the coming hours as well as over a one-week horizon.
Asset managers' ETF applications are fueling the demand for Bitcoin, paving the way for an exciting market outlook. We can anticipate additional players, such as Fidelity, filing their applications in the near future. 📈
These favorable conditions signal a slightly bullish market, presenting potential upside opportunities for the crypto sphere as a whole.
Follow ATTMO Times to stay ahead of the curve!
🐂☀️ Crypto Bull Run: Sunny Skies and Upside Potential! 🚀📈The bull market continues in the crypto universe 🐂📈, with sunny conditions ahead in the coming hours and over a one-week horizon. ☀️ An upside potential across the board is likely, according to ATTMO. 🚀
ETF applications fuel optimism, while low liquidity sparks exciting price fluctuations. 🌟 Stay tuned for EU inflation updates and follow us for more crypto weather reports and insights! 📊

ASTRA Protocol next generation of compliance for Web3ASTRA Protocol is positioning itself as the next generation of compliance, offering a decentralized Know Your Customer (KYC) platform tailored for the Web3 ecosystem. By bringing financial regulatory standards for over 150 countries and incorporating more than 300 sanctions and watchlists, ASTRA Protocol aims to bridge the gap between traditional compliance requirements and the cryptocurrency industry.
The introduction of such a platform has the potential to address a critical need within the crypto space by providing robust compliance measures while preserving the principle of anonymization. This unique approach may contribute to increased adoption and acceptance of cryptocurrencies by regulatory bodies and traditional financial institutions.
As the cryptocurrency industry continues to evolve, regulatory compliance becomes increasingly important. ASTRA Protocol's focus on incorporating global regulatory standards demonstrates its commitment to establishing a secure and compliant environment for users. By doing so, it could potentially facilitate the integration of cryptocurrencies into the mainstream financial system.
Former EU Commissioner for Trade, Phil Hogan, has taken on the role of Executive Advisor for ASTRA Protocol.
I`m bullish on ASTRA Protocol.
Looking forward to read your opinion about it!

Crypto Market Forecast: Slightly 🐂ish with Upside Potential 🌞Sunny conditions prevail in the global crypto market over the next 24 hours, as well as over a one-week horizon. ☀️
This translates into a slightly bullish market with upside potential. The various moves into the crypto sphere announced by traditional financial players over the past week are set to significantly boost demand for crypto assets and, ultimately, push up their prices. ☁️🌈
Stay up-to-date with the latest crypto weather forecast and market insights and follow us for more exciting updates! ⚡️📈🌐🔥💼

Bright Skies and Bullish Potential in the Next 24 Hours? 🌞📈A slightly bullish market with upside potential lies ahead for the global crypto market in the next 24 hours and over a one-week horizon, according to the sunny outlook of ATTMO. ☀️
The ongoing crypto rally continued at full speed as the market was boosted by the positive remarks made by the Chairman of the Federal Reserve on cryptocurrencies overnight. Cryptocurrencies are an asset class with staying power, Jerome Powell said. 💪
The filing of three separate applications for spot Bitcoin ETFs also drives the rally. 📈
Stay tuned for more crypto updates and insights in ATTMO Times! 📰

Bullish Trend Ahead with Positive Remarks and ETF Filing ☀️A slightly bullish market with upside potential lies ahead for the global crypto market in the next 24 hours and over a one-week horizon, according to the sunny outlook of ATTMO. ☀️
The ongoing crypto rally continued at full speed as the market was boosted by the positive remarks made by the Chairman of the Federal Reserve on cryptocurrencies overnight. Cryptocurrencies are an asset class with staying power, Jerome Powell said. 💪
The filing of three separate applications for spot Bitcoin ETFs also drives the rally. 📈
Stay tuned for more crypto updates and insights in ATTMO Times! 📰

At least 2x coming for $SYS/USDTAfter my successful analysis for $PEPE/USDT, I took some profits from that trade and now I am going to invest in $SYS/USDT for the following reasons:
1. on the 28th of June there is going to be a new product of SYSLABS called Rollux, after launching this product there will be a buzz in the community, which will make the price go higher.
2. There is a nice bullish divergence, which you can also see on the screenshot.
3. After the market spike lately, sys stays calm, which makes me think that after the market calms down a bit, then sys will be the one making people talk about it.
Well, I indicate in the chart TP/SL, I am sure sys will do at least 2x from this price.
DYOR and invest on your behalf.
Cheers.

Huge Spike for #PEPE/USDTA huge spike is unavoidable for #PEPE/USDT. Here are the reasons:
1. We are in a strong support zone.
2. We broke downward channel resistance.
3. Spotted 2 bull divergence.
4. Binance is stopping PEPE loans this week, which means people who got loans in PEPE, now they need to buy again and repay the loan, which will lead to buying pressure!
5. Overall Crypto market seems healthy and if BlackRock gets ETF, then the whole crypto will launch, and so will PEPE.
Last and not least, PEPE is trending for more than 2 months and price spike will bring more interest.
p.s. DYOR and invest based on your research.

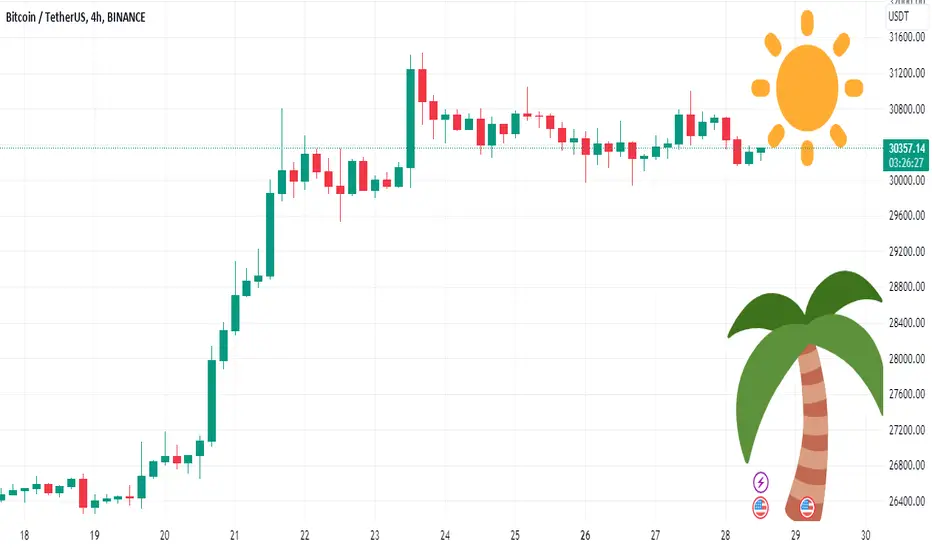
🌴🌡️ Tropical Heatwave: Is a Market Correction Looming? 🌧️Tropical conditions 🌴 lie ahead for the global crypto market over a one-day horizon, signaling a very bullish trend with an imminent market correction ahead. The crypto rally witnessed this week has been triggered by a series of announcements from major financial players, including the launch of a new crypto exchange for institutionals and the filing of several spot Bitcoin ETF applications to the US regulator. 💥
These recent developments show that financial institutions believe in the crypto assets, despite the US regulator's continuous crackdown on the US crypto market. Over a one-week horizon, sunny trading conditions prevail ☀️, indicating a slightly bullish market with upside potential for the cryptosphere. 📈💰
Stay ahead of the game and follow us to explore deeper insights in ATTMO Times! 📰✨

Sunny Forecast or Impending Correction? 🌴/☔ ?Tropical conditions 🌴 lie ahead for the global crypto market over a one-day horizon, signaling a very bullish trend with an imminent market correction ahead. The crypto rally witnessed this week has been triggered by a series of announcements from major financial players, including the launch of a new crypto exchange for institutionals and the filing of several spot Bitcoin ETF applications to the US regulator. 💥
These recent developments show that financial institutions believe in the crypto assets, despite the US regulator's continuous crackdown on the US crypto market. Over a one-week horizon, sunny trading conditions prevail ☀️, indicating a slightly bullish market with upside potential for the cryptosphere. 📈💰
Stay ahead of the game and follow us to explore deeper insights in ATTMO Times! 📰✨
