BTC Breakout or Breakdown: 83K to 87K or Bust to 73K?BTC’s standing at a fork in the road, and it’s itching to make a move! If it pushes past 83,121, we’re looking at a smooth jump to 84,600—like a quick win you can almost taste. Keep the good vibes going, and 87,000 might just be the big payoff. But hold up—if it stumbles below 81,300, things could get messy. The bears might crash the party, pulling us down to 80K, then 79,900. And if the slide keeps going? We’re talking 74,700, maybe even a rough landing between 73,600 and 73,000.
Kris/Mindbloome Exchange
Trade Smarter Live Better
Cryptonews

BTCUSDT - single supporting area , holds or not??#BTCUSDT - just reached at his current important supporting area that is around 83600
keep close that level,
overall market stay in range as per our last idea regarding #BTCUSDT.
so now below 83600 market can drop towards his old supporting areas.
good luck
trade wisely

Bitcoin Breakout Confirmed, Aiming for $160K
Chart Analysis:
Bitcoin has just confirmed a major breakout above a key resistance zone, signaling a strong bullish continuation. Let’s dive into the details:
1.Ascending Triangle Breakout:
BTCUSD had been consolidating within an ascending triangle pattern since late 2024, with the upper resistance around $80,000 and a rising support trendline (highlighted in yellow).
The breakout above $80,000 on strong volume confirms the bullish pattern, which is typically a precursor to significant upward moves.
2. Accumulation Zone:
Before the breakout, Bitcoin spent several months in an accumulation zone between $53,837 and $80,000. This phase allowed buyers to build positions, setting the foundation for the current rally.
3.Price Targets:
The measured move of the ascending triangle (height of the pattern) projects a target around $160,000. The height of the triangle is approximately $26,163 (from the base at $53,837 to the resistance at $80,000). Adding this to the breakout point ($80,000 + $26,163) gives a target of ~$106,163. However, considering Bitcoin’s historical tendency to overshoot during bull runs and the psychological significance of $160,000 (as noted on the chart), this level seems like a realistic target.
4. Support Levels:
The previous resistance at $80,000 now acts as strong support. If BTC pulls back, this level should hold to maintain the bullish structure.
Additional support lies around $70,000, aligning with the lower boundary of the recent consolidation range.
5. Momentum Indicators:
While the chart doesn’t display specific indicators like RSI or MACD, the sharp upward move suggests strong momentum. Traders should monitor for overbought conditions on RSI (above 70) as BTC approaches higher levels, which could indicate a potential pullback.
Trade Idea:
Entry: Current price around $84,599.61 (post-breakout confirmation).
Stop Loss: Below $78,000 (to account for minor pullbacks while staying above the breakout zone).
Take Profit: $160,000 (primary target based on the pattern projection and psychological level).
Risk/Reward Ratio: Approximately 1:12, making this a high-probability setup.
Key Levels to Watch:
Resistance: $100,000 (psychological), $120,000, $160,000 (target).
Support: $80,000 (new support), $70,000 (secondary support).
Market Context:
Bitcoin’s breakout aligns with a broader crypto market uptrend, potentially fueled by positive fundamentals such as institutional adoption, favorable regulatory developments, or macroeconomic factors like inflation concerns driving demand for BTC as a store of value. Ethereum’s recent breakout (as seen in similar charts) also supports the bullish sentiment across the crypto market.
Conclusion:
BTCUSD has broken out of a multi-month consolidation pattern, confirming a bullish trend with a target of $160,000. The $80,000 level should now act as strong support, and any pullbacks to this zone could offer additional buying opportunities. Stay cautious of overbought conditions as BTC approaches higher resistance levels. Let’s see how far this rally can go!

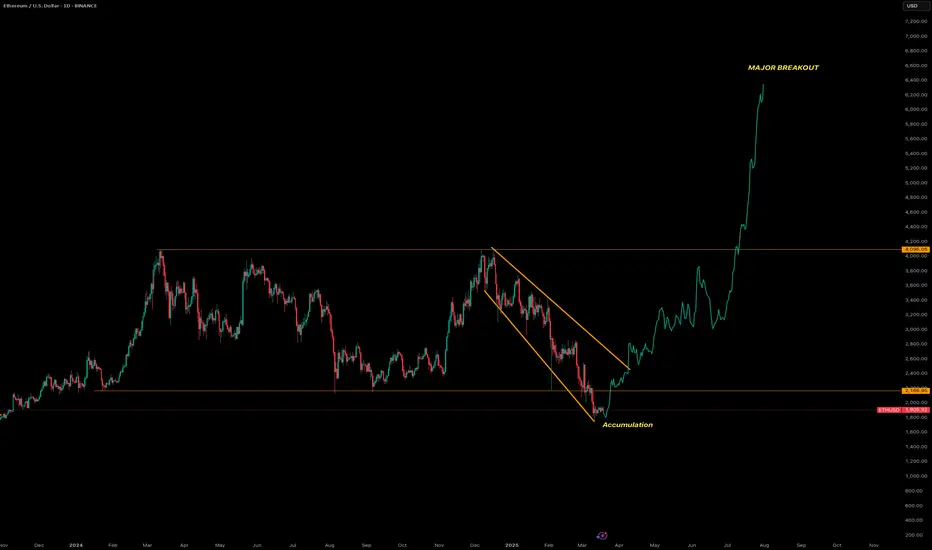
Ethereum Major Breakout Confirmed, Targeting $7800Ethereum has just confirmed a major breakout above a critical resistance zone, signaling a strong bullish continuation. Here's the detailed breakdown:
1.Ascending Triangle Breakout:
ETHUSD had been consolidating within an ascending triangle pattern since late 2024, with the upper resistance around $4000 and a rising support trendline (highlighted in yellow).
The breakout above $4000 on high volume confirms the bullish pattern, often a precursor to significant upward moves.
2. Accumulation Zone:
Prior to the breakout, ETH spent several months in an accumulation zone between $2000 and $4000. This phase allowed buyers to build positions, setting the stage for the current rally.
3. Price Targets:
The measured move of the ascending triangle (height of the pattern) projects a target around $7800. This is calculated by taking the height of the triangle (from the base at $2000 to the resistance at $4000, which is $2000) and adding it to the breakout point ($4000 + $2000 = $6000). However, considering the momentum and historical price action, the next psychological level at $7800 seems achievable.
4. Support Levels:
The previous resistance at $4000 now acts as strong support. If ETH pulls back, this level should hold to maintain the bullish structure.
Additional support lies around $3000, aligning with the 50-day moving average (not shown but inferred from typical setups).
5. Momentum Indicators:
While the chart doesn’t display specific indicators like RSI or MACD, the sharp upward move suggests strong momentum. Traders should watch for overbought conditions on RSI (above 70) as ETH approaches higher levels, which could signal a potential pullback.

Trading opportunity for Tensor TNSRUSDTBased on technical factors there is a Buy position in :
📊 TNSRUSDT
🔵 Buy Now
🪫Stop loss 0.1950
🔋Target 0.2500
📏 R/R 2
💸RISK : 1%
We hope it is profitable for you ❤️
Please support our activity with your likes👍 and comments📝

Trading opportunity for AVAILUSDTBased on technical factors there is a Buy position in :
📊 AVAILUSDT
🔵 Buy Now
🪫Stop loss 0.03700
🔋Target 0.04700
📏 R/R 2
💸RISK : 1%
We hope it is profitable for you ❤️
Please support our activity with your likes👍 and comments📝

CRAIUSDT - An interesting coin!CRAI token is a part of Cryptify AI project
Cryptify AI uses AI and blockchain to analyze influencer performance on social media, helping businesses make more accurate and transparent marketing decisions using the CRAI token.
A strong and interesting project with a unique idea.
On the chart, it has formed a descending channel, and the 0.236 resistance has been broken on the 3-day chart.
The price movement is expected as shown in the chart
Best regards Ceciliones🎯

Shiba Inu (SHIB) Shows First Major Bullish Signal Amid Market ReAfter weeks of downward pressure, Shiba Inu (SHIB) (traded on WhiteBIT) has recorded its first notable bullish retrace, hinting at a potential trend reversal. The asset is currently trading near $0.00001337 and has successfully broken above the 26-day EMA—a key technical level that often signals the start of broader upward momentum.
This breakout is significant, marking SHIB’s first major move above resistance since February’s downtrend. The token’s local support now sits at $0.0000122, and if bullish momentum continues, SHIB could target the next major resistance at the 50 EMA ($0.0000145). A further push above this level could solidify the reversal.
Additionally, the Relative Strength Index (RSI) at 50.75 suggests growing buying pressure. A move above the 55-60 zone would reinforce the bullish setup and potentially trigger further gains. With market liquidity also increasing, traders seem to be re-entering SHIB, setting the stage for possible continued upside.

Others looking for a strong reboundThe chart for OTHERS is showing promising signs of bullish strength, with a clear formation of a Cup and Handle pattern. This classic technical pattern often signals a potential breakout after a period of consolidation, indicating that the asset is likely to experience a significant upward movement.
Cup Formation: The initial downtrend, followed by a gradual recovery, is forming the left side of the "cup." The price movement is showing signs of stabilization and consolidation, which is typical for this pattern. The rounded bottom suggests a period of accumulation, with buyers gradually gaining control over the market.
Handle Formation: The handle is currently in development, which is characterized by a slight downward or sideways movement after the cup. This consolidation phase generally represents a final opportunity for accumulation before the asset breaks out to the upside.
Price Target: If the pattern follows typical behavior, we can expect a breakout near the upper resistance level formed by the rim of the cup. This breakout could potentially lead to significant price movements, particularly around October and November 2025 when the formation is expected to peak. This aligns with the typical timing for such formations, as the final breakout is often seen after the completion of the handle.
Volume: Watch for an increase in volume as the price breaks above the handle’s resistance level. Strong volume during the breakout would confirm the bullish momentum and could lead to sustained upward movement.
Key Levels to Watch:
Support: Around the bottom of the cup, where the price has stabilized. A break below this level could negate the bullish thesis.
Resistance: The peak formed by the rim of the cup, which, once broken, could trigger the breakout.
In conclusion, OTHERS appears to be in a strong position with the potential for significant upside if the cup and handle pattern completes as expected. Keep an eye on the upcoming months, especially October and November 2025, for the possible peak and breakout.

From Rejection to Explosion: PI Breaks FreeThe price of PI/USDT has been moving within a well-defined falling channel, consistently facing rejection from the upper trendline and finding support at the lower boundary. Notably, the price has bounced multiple times from the falling support line, indicating it as a significant dynamic zone.
Recently, the price broke out of this descending channel with strong momentum, suggesting a potential trend reversal. The breakout candle is accompanied by high volatility, signaling bullish strength.
Additionally, the previous support zone, which turned into resistance, has now been reclaimed. This flip adds further bullish confirmation.

BTC Showdown: Smash 84,700 for a Rocket Ride to 93KMorning, trading peeps! BTC’s at a crossroads – if we punch through 84,700, we’re looking at a sweet climb to 88K or even 93K. But if we slip below 83,500 and close there, brace yourselves for a dip to 76,300 or lower. Let’s see where this ride takes us today!
Kris/Mindbloome Exchange
Trade Smarter Live Better

Ethereum (ETH/USD) – Potential Breakout from Range Towards $2,50📊 Chart Insights:
ETH/USD is currently ranging near the $1,950 zone, following a consolidation phase.
A strong resistance zone is visible between $2,302 - $2,527, which has historically acted as a rejection point.
Support levels are established around $1,824 - $1,909, forming a strong base for price action.
A breakout above the current range could signal a bullish move toward the $2,302 resistance level, with a further target at $2,527.
📈 Trading Plan:
✅ Entry: Buy above $1,966 on confirmation of breakout.
🎯 Targets: $2,302 and $2,527 for profit-taking.
❌ Stop Loss: Below $1,909 to manage risk.
📉 Bearish Scenario: If ETH fails to hold $1,909, a retest of $1,824 is possible.
🔥 Ethereum could see a strong rally if momentum builds above resistance! Are you ready?

Ethereum’s Trendline Support Holds Strong! Time to Long?CRYPTOCAP:ETH is currently testing a key support trendline, which has historically provided strong buying interest. This level has acted as a critical zone for bullish rebounds in previous market cycles.
The 100 EMA (Exponential Moving Average) is positioned above the price, indicating potential resistance on any recovery attempts. If ETH maintains support at this trendline, it could trigger a bounce towards the ATH resistance zone around $4,400.
DYOR, NFA
Please hit the like button and leave a comment!

Ethereum (ETH/USD) - Potential Breakout from RangeEthereum (ETH/USD) - Potential Breakout from Range
Chart Overview:
The price of Ethereum (ETH/USD) has been consolidating within a range after breaking out of a long-term downtrend channel.
A strong support level is identified around $1,852, which has been holding the price steady.
A resistance zone near $2,076 is acting as a short-term barrier for upward movement.
Trading Idea:
If ETH successfully breaks above the range, it may trigger a bullish move towards $2,539 and potentially $2,854.
Entry Strategy: Wait for a confirmed breakout above $2,076 with strong volume.
Stop-Loss: Below $1,852 to minimize risk.
Market Sentiment:
ETH/USD is showing signs of accumulation, and a breakout could signal a new bullish trend.

Bitcoin (BTC/USD) – Bullish Breakout in Progress📈 Chart Pattern:
Bitcoin has been trading inside a descending channel for several weeks. Recently, BTC has broken out of the channel’s upper boundary, indicating a potential shift in momentum.
🔹 Key Levels:
Support: $80,043.75 (Critical stop-loss level)
Resistance: $87,500 (Short-term)
Target: $92,944.17 (Upside projection)
📊 Trading Plan:
BTC might retest the breakout zone before continuing the upward move.
A confirmed higher low formation could signal strong bullish momentum.
If BTC remains above $85,500, further upside toward $92,944.17 is possible.
⚠️ Risk Management:
If BTC drops below $80,043.75, the bullish setup could become invalid.
Traders should wait for confirmation before entering long positions.
💡 Conclusion:
This breakout could lead to a strong uptrend, but traders should watch for a successful retest before making a move. 🚀🔍

XRP/USD Skyrockets to the MoonXRP/USD Breakout Alert! After consolidating below key resistance around $2.107, XRP has surged to $7.25, hitting a target gain of 7.25x! The price has broken through multiple resistance levels, showing strong bullish momentum. Are we heading for new all-time highs? Let’s discuss!

Ethereum will make a major Breakoutanalysis the chart
Let’s analyze the provided Ethereum (ETH/USD) chart on a daily timeframe from TradingView, focusing on the key technical elements and trends:
1. Overall Trend
The chart displays a significant bullish trend for Ethereum, with the price rising from around $2,200 in early 2024 to approximately $4,000 as of the latest data point (March 18, 2025).
The upward movement is marked by a sharp breakout, indicating a strong shift in momentum from consolidation to a rapid ascent.
2. Price Levels and Targets
Current Price: Approximately $4,000, with a previous support/resistance zone around $2,200.
The chart highlights a major breakout above the descending triangle pattern, suggesting potential for further upside, though no specific price target is explicitly labeled beyond the current level.
3. Technical Patterns
Descending Triangle: The chart features a descending triangle pattern, typically considered a bearish continuation pattern. However, the recent price action has broken out upward through the upper resistance line (around $2,200-$2,500), invalidating the bearish outlook and turning it into a bullish reversal signal.
Accumulation Phase: A clear accumulation zone is marked near the lower boundary of the triangle (around $2,200), where the price consolidated before the breakout. This suggests strong buying interest built up at this level, supporting the subsequent rally.
4. Support and Resistance
Support: The $2,200 level, which acted as the lower boundary of the triangle, now serves as a potential support zone if the price pulls back. This level could be retested as new support following the breakout.
Resistance: The next resistance is not explicitly marked, but the rapid upward move suggests the price may face selling pressure around previous highs (e.g., $4,500-$5,000) or psychological levels like $5,000, based on Ethereum’s historical behavior.
5. Volume and Momentum
Volume data isn’t shown, but the steep upward slope post-breakout indicates significant buying pressure and momentum. A breakout with high volume would further confirm the strength of this move.
6. Timeframe and Projection
The chart spans from late 2023 to mid-2025, with the major breakout occurring around early 2025. The sharp rise suggests this bullish momentum could continue in the short to medium term, potentially pushing Ethereum toward new all-time highs (above $4,800, its previous peak).
7. Key Observations
The upward breakout from the descending triangle is a powerful bullish signal, often indicating a reversal of prior bearish pressure and the start of a new uptrend.
The accumulation phase near $2,200 reflects a period where buyers absorbed selling pressure, setting the stage for the breakout.
Potential risks include a pullback to retest the broken resistance (now support) at $2,200-$2,500, or overextension if the rally lacks consolidation. Monitoring for overbought conditions (e.g., via RSI or other indicators) could be prudent.
Ethereum wooing toward 2022 lowsEthereum's momentum has been underwhelming to say the least. WIth network upgrades and future developments not showing a whole lot of pizzaz, Ethereum looks as it is heading toward 2022 lows near the $1,200 level. Is it a buy from there?

Bitcoin's epic journey to $160K1. Overall Trend
The chart shows a long-term bullish trend for Bitcoin, with the price rising significantly from around $50,000 in early 2023 to approximately $123,130 as of the latest data point (March 18, 2025).
The upward movement is characterized by a series of higher highs and higher lows, indicating strong bullish momentum.
2. Price Levels and Targets
The chart highlights a projected target of $160,000, labeled as "Reaching at 160K." This suggests the analyst anticipates a potential breakout or continuation of the current uptrend to this level.
Current price: Approximately $123,130, with previous support/resistance zones marked at $77,917 and $56,707. These levels likely represent significant historical support where accumulation occurred.
3. Technical Patterns
Ascending Triangle: The chart features an ascending triangle pattern, a bullish continuation pattern. The upper resistance line slopes downward slightly, while the lower support line slopes upward, converging toward a breakout point. The recent price action appears to have broken above this triangle, supporting the bullish outlook.
Accumulation Phases: Two distinct accumulation zones are marked:
The first accumulation phase is around the $56,707 - $77,917 range, where the price consolidated before the initial breakout.
The second accumulation phase is near the $100,000 - $120,000 range, followed by a sharp upward move toward the current price and the projected $160,000 target.
4. Support and Resistance
Support: The lower boundary of the ascending triangle and the accumulation zones (e.g., $77,917 and $56,707) act as potential support levels if the price pulls back.
Resistance: The next major resistance is implied at $160,000, where the price may face selling pressure or consolidation before potentially moving higher.
5. Volume and Momentum
While volume data isn’t explicitly shown, the sharp upward move after the breakout from the triangle suggests increasing buying pressure and momentum, typical of a strong bullish trend.
6. Timeframe and Projection
The chart spans from early 2023 to mid-2025, with the $160,000 target likely projected to be reached by mid-2025, aligning with the current trajectory and historical bullish cycles.

Bullish Divergence Spotted! Is ONDO Ready to Pump?The price of ONDO/USDT is currently trading within a broader sideways range, respecting both the upper resistance and lower support levels. The falling resistance trendline has been acting as a strong barrier, rejecting the price multiple times.
However, a bullish RSI divergence is forming at the lower support zone, signaling a potential reversal or bounce.
If the price holds above the support, a breakout above the trendline could trigger an upward move towards the upper resistance zone. On the downside, losing support could lead to further weakness.

TON Main trend 16 03 2025Logo of rhymes. Gann fan for understanding the logic of trend development and dynamic levels of support and resistance.
Time frame 1 week, for full orientation in the trend and potential targets. Key price reversal zones on which the trend development depends are shown with arrows. Conservative and adequate targets in the medium and long term. Everything above, as for me, should not worry you much, but this is purely my opinion, nothing more.
🟡 Pay attention how clearly the percentages of large triangles and time reversal zones are worked out according to the algorithm. Someone who is far from trading says that TA does not work on cryptocurrency.
TA is a banal logic, an exchange algorithm (you need to be tied to something), real supply/demand (market participants) and manipulative supply/demand, that is, large market participants (exchanges, funds, creators).
In the development of the trend, there is a fractal behavior of the price in the trend at the moment. Perhaps this logic will continue. The secondary, downward trend formed a wedge-shaped formation, as before.
1 day time frame
🟣 Currently locally an aggressive buyback is taking place (probably, as an excuse for the price movement, some positive news was released) from the dynamic support of the fan (on the 5-minute time frame, after the impulse-buyback, a bullish triangle was formed in consolidation, and now its goals are being realized). If after a rollback on the senior time frame (1 day, 1 week) this zone is preserved - a reversal of the secondary trend. At the moment, the price is moving within the wedge canvas, locally there is a complete absorption of the bearish candle on the weekly time frame.
🔴 Also, if there is a test of this reversal zone (less likely) , then the price can consolidate according to the logic of the descending wedge. Price consolidation, especially not overcoming the dynamic former fan support on a repeated retest — a decline to begin with to the median (red dotted line) of the range. On the chart you will see an "illogical" head and shoulders. This is an extremely unlikely scenario, but I will describe it just in case, so that you take this into account in your money management (not risk management).

Bitcoin will reach $221,000The chart explicitly labels a "Breakout" point around December 15, 2024, where the price moves above the $80,000 resistance level of the ascending triangle. This breakout is a significant technical event, suggesting strong buying pressure and a continuation of the uptrend. Following the breakout, the chart notes a "Retracement" phase, where the price pulls back to test the breakout level (now acting as support at approximately $80,000). This behavior is common in technical analysis, as prices often retest previous resistance levels after a breakout to confirm support.
As of March 14, 2025, the current price of $80,228.30 is just above the $80,000 level, suggesting the price may be in the early stages of this retracement or has recently stabilized after testing the support. This positioning indicates potential buying opportunities for traders looking for entry points near this level, with expectations of further upward movement.
Projected Price Target: $221,000
One of the most notable annotations on the chart is the "TG $221,000" label, which stands for "Target Price" of $221,000. This target is projected based on the breakout from the ascending triangle, likely calculated by taking the height of the triangle (the difference between the resistance at $80,000 and the lowest support at $55,000, which is $25,000) and adding it to the breakout level ($80,000 + $25,000 = $105,000). However, the chart's projection to $221,000 suggests a more aggressive target, possibly involving a multiple of the height (e.g., 3x the height, $80,000 + $75,000 = $155,000, still not reaching $221,000) or a Fibonacci extension beyond standard calculations.
Given the significant gap between the current price ($80,228.30) and the target ($221,000), this projection is an unexpected detail, implying a potential multi-fold increase in Bitcoin's value. It aligns with the chart's bullish patterns but involves considerable uncertainty, as market conditions, macroeconomic factors, and adoption rates could influence actual price movements.
Additional Technical Observations
Beyond the ascending channel and triangle, the chart includes several other technical elements:
Support and Resistance Levels: The $80,000 level, initially a resistance during the triangle, becomes a key support level post-breakout. The lower trendline of the ascending channel also acts as dynamic support throughout the uptrend, providing a floor for price corrections.
Volume Indicator (Implied): While not explicitly shown, breakouts like the one labeled are often accompanied by increased volume, which would confirm the strength of the move. Without a visible volume histogram, this remains an inference.
Fibonacci Retracement (Potential): The retracement after the breakout could be analyzed using Fibonacci levels (e.g., 38.2%, 50%, 61.8%) to identify key support zones, though these are not drawn on the chart.
Momentum and Moving Averages (Implied): Although not visible, momentum indicators like RSI or MACD could provide additional insights. For instance, a strong breakout might correlate with overbought RSI, while the retracement could indicate a return to neutral levels. Moving averages (e.g., 50-day, 200-day) might have supported the uptrend earlier, with the price potentially approaching these for support during retracements.
Implications for Traders
The analysis suggests Bitcoin is in a robust bullish trend, supported by the ascending channel, triangle breakout, and projected target. Traders may consider the following strategies:
Buy on Pullbacks: Look for buying opportunities near the $80,000 support level, especially if volume and other indicators confirm buying pressure.
Target Setting: Use the projected target of $221,000 as a long-term goal, but be mindful of market volatility and external factors that could affect price.
Risk Management: Given the significant gap to the target, set stop-loss levels below key support (e.g., below $80,000) to manage risk.

Uniswap will reach 150$Technical Analysis of Uniswap Chart
Overall Trend and Structure:
The chart shows a multi-phase trend: an initial upward move in mid-2024, a consolidation phase with lower highs and lower lows forming a descending pattern, and a sharp bullish breakout in early 2025 (around March 2025).
The recent steep upward movement suggests strong buying pressure, potentially indicating a breakout from a corrective pattern (e.g., descending triangle or wedge).
Key Trendlines and Levels:
Descending Trendline: The orange descending trendline connects the lower highs during the consolidation phase, acting as resistance. The price breaking above this trendline in early 2025 is a bullish signal, suggesting the end of the corrective phase.
Horizontal Support/Resistance: The orange horizontal line near the middle of the chart likely served as support during consolidation (possibly around $10–$12 on an adjusted scale). The breakout above this level reinforces bullish momentum.
Recent Surge: The vertical orange line on the right indicates a rapid price increase, potentially pushing UNI from the $10–$12 range to $15–$20 (adjusted from the $16,000,000 mark on the y-axis, assuming a $0–$30 scale).
Candlestick Patterns and Momentum:
The candlesticks show volatility, with green candles dominating the recent surge, indicating strong bullish momentum. Red candles during consolidation suggest profit-taking or selling pressure that has now been overcome.
The steepness of the rise suggests high volume or a catalyst (e.g., news, DeFi adoption, or Ethereum ecosystem developments), though volume data isn’t visible.
Potential Technical Patterns:
The chart resembles a descending triangle or wedge breakout. A descending triangle typically signals a bearish continuation, but an upward breakout (as seen here) can indicate a reversal to a bullish trend, especially if supported by volume.
The breakout above the trendline suggests a potential target measured by the height of the triangle base (e.g., if the base is $5 wide, add $5 to the breakout point, targeting $20–$25).
Support and Resistance Levels:
Support: The broken trendline and horizontal line (now support) around $10–$12 are critical. A pullback to retest this level would be a common post-breakout behavior.
Resistance: The next resistance might be at the recent high (e.g., $20) or a psychological level like $25, based on historical UNI peaks (e.g., its all-time high of $44.97 in May 2021).
Overbought conditions could emerge if the rally continues unchecked, warranting caution.
Market Context and Sentiment:
Uniswap, as a leading DeFi protocol, benefits from Ethereum’s ecosystem growth, protocol upgrades (e.g., Uniswap v4 or Unichain), and increasing DeFi adoption. The recent surge might reflect such developments in early 2025.
Web-based price predictions for March 2025 vary widely: averages range from $6.30 to $12.69, with highs up to $13.58–$25.75, suggesting the chart’s surge aligns with an optimistic scenario. Posts on X indicate mixed sentiment, with some noting bearish pressure earlier in March (-30% reported) but others highlighting bullish potential if demand zones hold.
The chart’s bullish breakout contrasts with some bearish technical indicators (e.g., RSI oversold at 34.69 noted on X), suggesting a possible short-term correction after the rapid rise.
Interpretation and Outlook
Bullish Case: The breakout above the descending trendline and horizontal support signals a strong bullish reversal. If momentum continues, UNI could target $20–$25 in the near term, supported by DeFi growth and market sentiment. A retest of $10–$12 as support would confirm the breakout’s validity.
