Beyond BTC - Why Coinbase (COIN) is a Long-Term Buy?As a trader, I'm always watching the markets, but building long-term wealth is also key. That's why I'm digging into assets like Coinbase (COIN) . While my day job is trading, Coinbase has definitely caught my eye as something portfolio-worthy for the long haul. We might have missed the IPO buzz back in 2021, but looking at where Coinbase is headed, I think we're still early in a massive growth story.
Don't let short-term crypto ups and downs distract you. Coinbase is playing a long game, and here's why it's a smart long-term investment -
CEO Brian Armstrong's Big Vision (and Big Numbers):
Already a Financial Giant: Think of Coinbase as a bank or brokerage – it's already HUGE. It's as big as the 21st largest US bank by assets ($0.42 trillion!) or the 8th largest brokerage. This size matters.
Going Global: Coinbase isn't just focused on the US. They're expanding worldwide to grab new users and markets.
Becoming Your All-in-One Financial Hub: Forget old-school banks. Coinbase wants to be your single crypto-powered financial account for everything – payments, investing, and more. This is where finance is heading.
Token Powerhouse: Crypto is about more than just Bitcoin. Coinbase wants to list every token, becoming the go-to place for the entire crypto universe.
Blending Crypto Worlds: Coinbase is smart – they're linking up with new decentralized crypto systems (DeFi) to give you the best of both worlds, easy to use but with more options.
Working with Regulators: Coinbase is playing it smart, working with governments to make crypto safe and trusted for everyone long-term.
Massive Crypto Payments: People are using crypto to pay – big time. $30 TRILLION in stablecoin payments happened last year alone. Coinbase is ready to cash in on this payment revolution.
Why This Matters for Long-Term Investors:
Crypto is Exploding: Everyone knows crypto is going to get bigger. Coinbase is in the perfect spot to ride this massive wave.
Big Money is Coming: Big institutions like banks are starting to invest in crypto. Coinbase is built for them – safe, secure, and ready for big players.
Coinbase is the Brand You Trust: Coinbase is the big name in crypto. People know and trust them, which is gold in a new market.
Bottom Line: Coinbase isn't just a trend; it's building the future of finance. Yes, crypto is bumpy, but for the long haul, Coinbase is positioned to be a winner.
Now let's get technical and have a look at what the charts are saying -
Uptrend is Clear: Forget short-term noise – this chart shows Coinbase has been on a solid climb since late 2023. There's a strong bullish structural break which indicates the trend has shifted up after a short bearish run.
$350 is the Line in the Sand: Think of $350 as the ceiling right now. The price hit it, and we saw some selling. Gotta break above $350 to really see the bulls charging again.
$225-$250 is the Safety Net: On the flip side, $225-$250 is like solid ground. As long as we stay above that, the bull run is still in play.
Just Taking a Breather: Right now, the chart says "consolidation." Think of it as Coinbase catching its breath after a big run. This pause can be a good thing – building up energy for the next push up.
RSI is Neutral for Now: The RSI thing is the 50% level. Not screaming "buy" or "sell," just saying "wait and see." After showing us bearish divergence we are likely to see oversold conditions within the current range - if that does happen it would be a good time to strike.
What to Watch For (Trader Style):
Breakout Above $350 = Green Light: If COIN blasts through $350 with some volume, that's the signal to jump in long. Think higher targets.
Stuck Between $250 and $350 = Range Trade Time: If it stays in this range, you can play the range – buy low, sell high within the range. But be ready for a break either way.
Drop Below $250 = Caution Flag: If we crack below $250, that's a warning sign. Might be time to get a bit more defensive.
Final Notes:
Coinbase looks good long-term, but we're in a "show me" moment right now. Watch those key levels – $350 and $250. Patience is key, but the chart is set up for a potential bullish move if we get the right trigger. If you're looking to invest for the long-haul, now would be a good time to add some shares to your portfolio.
Important Disclaimer:
Please remember, I am not a financial advisor. My analysis here is based on my personal research and is intended for informational and educational purposes only. Before making any investment decisions, it is essential to consult with a qualified financial professional who can provide advice tailored to your individual circumstances.
Investing in financial markets, especially in assets like cryptocurrencies and related stocks, carries significant risk. There are no guaranteed returns, and it's crucial to understand that investing is not gambling. Strategic investing involves thorough research, careful timing, and a clear understanding of your own risk tolerance and investment amounts. Always conduct your own independent research and due diligence before investing in any asset.
NASDAQ:COIN COINBASE:CBETHUSD COINBASE:CBETHETH COINBASE:CBETHUSDC OANDA:NAS100USD
Cryptonews

Crypto Crash: Is Forex and Gold Next?!The current market crash in crypto is likely due to a combination of factors, including:
1. Regulatory Pressure – Governments and financial regulators worldwide are tightening control over digital assets, leading to uncertainty and panic selling.
2. Macroeconomic Conditions – Rising interest rates, inflation concerns, and a stronger U.S. dollar often lead investors to pull out of risky assets like crypto.
3. Institutional Sell-Offs – Large holders (whales) and institutional investors may be liquidating positions, further driving prices down.
4. Market Sentiment & Liquidations – Fear-driven selling and cascading liquidations in leveraged positions exacerbate price drops.
Should We Worry About Forex and Gold?
Forex markets and gold are affected by macroeconomic conditions, but not always in the same way as crypto.
• Forex (XAU/USD & USD pairs): A strong dollar usually puts pressure on XAU/USD, but gold also benefits from risk aversion. If crypto weakness is tied to broader economic fears, gold might see increased demand as a safe haven.
• USD Strength: If the crypto crash is part of a broader risk-off sentiment, the U.S. dollar could strengthen, impacting major forex pairs.
Final Thoughts
Crypto’s crash doesn’t necessarily mean forex or gold will follow suit. However, if this is part of a bigger shift in risk appetite, we might see volatility across all markets. Watch economic data, Fed decisions, and global risk sentiment closely.

Bitcoin Game Plan - BTC PREDICTIONHello folks, it's time to update the BTC game plan.
My previous Bitcoin game plan worked precisely. The timing and price levels were 100% accurate, and as expected, we saw a new all-time high (ATH). I hope you managed to make some profits!
I’ve attached the previous BTC game plan below—feel free to give it a look.
New Game Plan:
Bitcoin has set a new ATH, but it seems we’ve encountered significant selling pressure at that level, and we couldn’t close above it. This indicates Bitcoin doesn’t yet have enough liquidity to expand higher.
From this perspective, I expect the price to retrace slightly, grab some liquidity from the buy side, and then continue its upward journey.
Scenario 1:
Price grabs the lows below and hits the purple line (Range High) before bouncing to a new high. (Less likely)
Scenario 2: (Marked on the chart)
Price grabs the lows completely and retraces to the blue bullish trendline, bouncing from there. We might even create a deviation below the blue line, trapping bears who aggressively short after a trendline break, and bounce from the green zone marked just below the blue line. (This is my preferred scenario.)
Scenario 3:
Price retraces further to grab all the way down to the lows and bounces from the black trendline we previously broke.
I’m sharing all three potential scenarios for clarity.
Also, with a pro-crypto president currently in office, any significant bullish news could send Bitcoin skyrocketing. Keep this in mind.
I remain overall bullish on Bitcoin. I firmly believe we haven’t seen the top yet. Despite the panic and sell-off from some gurus on X and TradingView who claim we’ve topped, I personally think we’re not even close to the peak.

The Future of Blockchain: A New Era of TokenizationGreetings, fellow enthusiasts!
I believe we are on the brink of a transformative era for blockchain technology. Here's my vision for how the future will unfold:
The New Era of Tokenization: We are entering a period where almost every financial asset will be tokenized. Imagine stocks, gold, silver, and various commodities all represented as digital tokens on the blockchain. This shift is already gaining momentum, with big banks and influential players like Larry Fink from BlackRock advocating for the tokenization of everything.
The Impact on Digital Assets: As we move towards this future, traditional financial assets will transition into digital tokens. This will, in my opinion, lead to digital assets without real-world counterparts, such as MARKETSCOM:BITCOIN , becoming "virtually" (pun intended) useless. Why? Because the tangible value of assets like tokenized TVC:GOLD or stocks will overshadow the speculative nature of purely digital assets.
The Role of Big Banks and Institutions: With the backing of major financial institutions, the adoption of tokenization will accelerate. This will bring about a more secure, transparent, and efficient financial system, bridging the gap between traditional and digital finance.
The Future: This is probably the end of the road for MARKETSCOM:BITCOIN and existing cryptocurrencies as we know them. Say hello to a new era of Cryptography that will be as mainstream as it can get.
In summary, the future of blockchain lies in the tokenization of real-world assets, driven by the support of big banks and key industry leaders. This new era will redefine the landscape of digital assets, making those without tangible counterparts less relevant or even completely irrelevant.
I look forward to hearing your thoughts and engaging in a lively discussion!
INDEX:BTCUSD NASDAQ:MSTR NASDAQ:COIN NASDAQ:MARA INDEX:ETHUSD CRYPTO:XRPUSD TVC:GOLD TVC:SILVER BINANCE:BTCUSDT COINBASE:BTCUSDT

SUI is Setting Up for a Massive Rally!SUI is currently in a retracement phase, but the BUY ZONE around $2.59 is where the real opportunity lies! 📈 This area aligns perfectly with strong support levels, making it an ideal accumulation zone before the next explosive move.
Once SUI bounces from this level, we could see a parabolic move toward $7.76+, representing a massive upside potential! 💰 The structure suggests a strong uptrend continuation, with bullish momentum ready to take over.
👀 Smart money is watching—are you? Don't miss out on this breakout! 🚀🔥
#SUI #Crypto #Bullish #Altcoins

BTC Dominance Breakdown = Altseason Incoming?BTC dominance (BTC.D) has broken down from key support, signaling a potential altseason ahead.
The breakdown below the 54.11% – 54.85% support zone suggests capital rotation from Bitcoin into altcoins, which could trigger major moves across the altcoin market.
If you find our work helpful, please like, comment, and follow us for more market insights—all in one place! Stay updated on Forex, Commodities, Crypto, and Global Indices with expert analysis.

Ethereum in the Golden Zone: Bounce or Breakdown?Ethereum (ETH/USDT) Weekly Analysis:
Trendline Support:
The price has repeatedly found strong support along the upward-sloping trendline, maintaining a bullish market structure.
Key Zones:
Support Zone: The critical support lies between $2,200 and $2,400, aligning with the golden Fibonacci retracement zone (0.618 - 0.786), making it a significant area for potential accumulation.
Resistance Zone : The major resistance lies between $3,900 and $4,100, where the price has previously faced selling pressure.
Outlook:
Bullish Scenario: A bounce from the support zone and trendline could lead to a retest of the resistance at $3,900–$4,100.
Bearish Scenario: A break below the trendline and $2,200 could signal a deeper correction.
Please do Like, comment and follow for more insights.

ICP breakout expected as positive cashflow is achievedInternet Computer Protocol is a unique project, that allows investors to accurately assess fundamentals. 2024 has been an amazing year for the project:
ICP has been recognised as being the fastest blockchain in terms of max recorded transactions per second, outperforming Solana by more than 3 times (Cryptogics November 2024).
In terms of compute, ICP is frequently burning more than 1 trillion 'cycles' per second, approximately 200x the 5B cycles/s it routinely burned a year ago.
It is also reported to be the cheapest for transactions and data storage, by one or more orders of magnitude, depending on the blockchain it is compared with (Token Terminal December 2024). More than 4Tb of data is stored on ICP, more than 3.3x the data stored on Ethereum and potentially more data than is held on-chain by all other crypto projects combined.
ICP is attracting developers at breakneck speed (3rd preferred blockchain for new developers), with fees collected up 40x year-on-year (Token Terminal December 2024).
These metrics are impressive, but despite the heavy-hitting results booked to date, ICP is still ranked 39th with a market cap of (just) US$4.1B in the CoinGecko list of crypto projects, well below projects with no or little utility. This has led to some insiders referring to ICP as 'crypto's most undervalued project'.
This month (January 2025), ICP will achieve 'positive cashflow', defined here as the point at which revenue from compute (ICP burned) exceeds the cost of the network (ICP minted to reward node providers). Refer to my post on Nuance for more detail (nuance.xyz).
Apart from this critical milestone, the tokenomics of ICP are such that effective deflation is affected by the value of the ICP token. I built a model described in another Nuance post (nuance.xyz) that estimates deflation (defined as a decrease in the ICP circulating supply) to be achieved in 2028, but at the current depressed ICP price below US$10, effective deflation will be achieved before this Christmas!!
In the context of the above, I expect ICP to increase significantly in value this year and given the chart provided here, my expectation is that the price of ICP will flip on a dime this week with the news of ICP achieving positive cashflow ('operational profit'). My view is that 10x is achievable in 2025.
I do not provide financial advice. The above expresses my personal view and may be way off the mark. Please do your own research but feel free to comment.

Trump Coin: Bearish Signals and Double Bottom AheadAs of January 25, 2025, Bitcoin (BTC) is trading at approximately $102,378, exhibiting bearish tendencies. This downturn is influencing altcoins, including Trump Coin (TRUMP), which is currently priced around $27.14.
Technical Analysis of Trump Coin (TRUMP):
Head and Shoulders Pattern: On higher timeframes, TRUMP has formed a head and shoulders pattern, a classic bearish indicator suggesting potential downward movement in the mid-term.
Double Bottom Support Level: The anticipated decline may lead TRUMP to revisit its previous double bottom support around the $5 mark.
Short-Term Bullish Spike: Before reaching the $8.80 support level, a brief bullish surge towards $12.544 is expected, possibly offering short-selling opportunities.
Supporting News and Market Sentiment:
Recent developments have contributed to the bearish outlook:
Regulatory Concerns: President Donald Trump's executive order to establish a task force for proposing new cryptocurrency regulations has introduced uncertainty, leading to market declines.
Meme Coin Volatility: The launch of TRUMP and MELANIA meme coins saw initial surges followed by significant crashes, highlighting the speculative nature of these assets and raising concerns about their impact on the broader crypto market.
Given these factors, traders should exercise caution. Monitoring key support and resistance levels, along with staying informed about regulatory developments, is crucial for making informed decisions regarding TRUMP and the broader cryptocurrency market.

XRP’s Next Move: Can It Reach $6.50?Good morning, trading family!
XRP is at a key point right now. If it drops below $2.84, we could see it fall to the $2.70–$2.60 range before bouncing back. On the flip side, if it pushes up from $3.30, we might see it climb to $3.80—and from there, $6.50 could be in sight.
It’s going to be an exciting move either way, so stay sharp!
If this resonates, feel free to comment, like, or share. Let’s trade smarter and live better!
Kris/Mindbloome Exchange
Trade What You See

INJ at Critical Confluence Zone – Bullish Breakout Ahead?Injective Protocol (INJ) is trading at a key confluence zone, supported by the resistance-turned-support area and a rising trendline. A breakout above the red resistance line could spark a strong bullish rally.
As long as the price holds above the support, the trend remains bullish.

ONYX ????ATH soon ??
Soon Onyx coin is going to test the ATH, as you see on the drwaings there is a symetri, coments bellow u are welcomed next week is really importamt , id gone be finished the 5D chart???

$XLM/USDT Analysis$XLM/USDT Analysis
#XLM is consolidating within a symmetrical triangle pattern on the 6-hour chart.
The price is nearing the breakout point, and a decisive move is expected soon.
If the price breaks above resistance, it could initiate a strong uptrend. Conversely, a breakdown of the support below may lead to further downside
Waiting for confirmation of the breakout with volume before entering a position is recommended.
Entry: CMP
Target: $0.6000 - $0.7000
SL: $0.3941
DYOR, NFA

AIXBT by Virtuals | Coinbase & Binance AIXBT is like the Sherlock Holmes of the crypto world
an AI agent designed to give token holders a strategic edge in the ever changing crypto circus. Using some next-level tech, it deciphers market trends and dishes out insights like your personal crypto psychic. It pulls in data from everywhere, ensuring you're not left out of the loop when making decisions in the chaotic crypto jungle.
Right now, AIXBT by Virtuals is hanging at $0.79, taking a bit of a nosedive with a -8.61% drop in the last 24 hours. But hey, it’s crypto, it could be up next time you blink!
The lowest price paid for AIXBT is $0.023, which was recorded on Nov 19, 2024 (about 2 months). Comparatively, the current price is 3,240% higher than the alltime low price!, it's got a circulating supply of 855.61 million tokens, and a max supply of 1 billion, so it’s got plenty of tokens to spread around.
In the past 24 hours, AIXBT’s trading volume has been a hefty $448 million, and it’s on 39 exchanges, with Binance being the party host. Its market cap is sitting at $682.36 million, claiming a modest 0.02% of the whole crypto market share.
Oh, and just when you thought things couldn’t get spicier, After Binance, Coinbase International has decided to list AIXBT, PNUT, and VET altcoins. Coinbase is diving deep into the futures market, aiming to steal some of the thunder from the big crypto exchanges.
Now, let’s talk whales. AIXBT hit a new ATH recently, and it’s mostly thanks to some big fish in the sea. “0x001,” aka the whale with deep pockets, scooped up 3.8 million AIXBT tokens (worth $2.7 million) just before the price shot up by 30%. This made them the proud owner of 8.31 million tokens, or 0.83% of the entire supply, with an average price of $ 0.62. Over the past four days, they’ve dropped about $5 million on AIXBT, and now they’re chilling with a 30% unrealized profit
long story short, Big whales, big moves, and AIXBT is riding high… for now,
why pullback? btc pumpin so memes dumpin and some whales sell the nws
wait you are new in crypto world ? Now’s the time to invest in your most valuable asset, knowledge. Crypto trading isn’t just for tech geeks anymore, it’s a skill everyone can learn. Start today, and watch your expertise and portfolio grow

KOG CRYPTO - BTCQuick look at BTC as it seems to be top of the headlines at the moment. We had the level of 103k on this which is now completed.
We now have support at the 104.3 region and obviously bullish above. I would however like to see that higher level and Red box may be give us a RIP if targeted!
It will be interesting to see how this plays.
As always, trade safe.
KOG

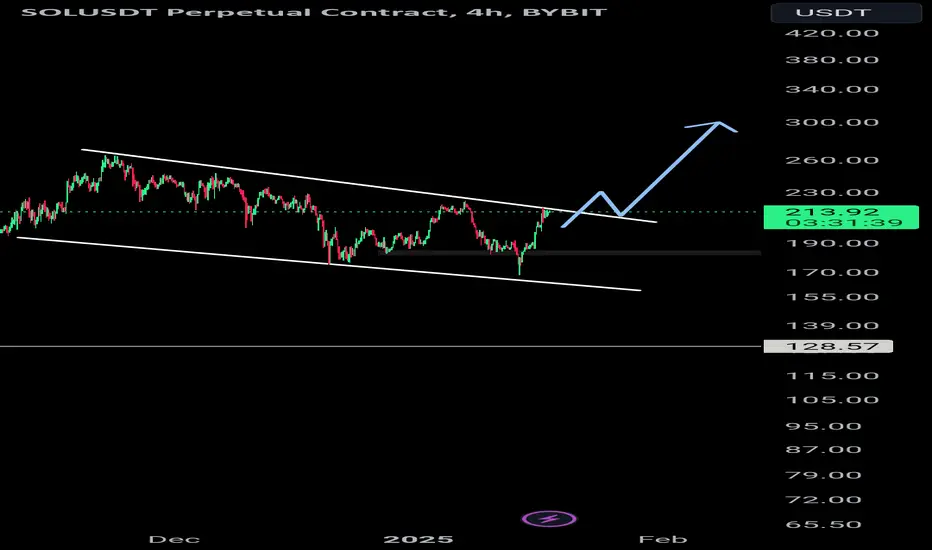
Solana's Crossroads: Break 265 for $400+ or Plunge to 159?Morning Trading Family
If Solana goes above 265, expect it to climb to $400 or more. If it falls below 321, watch for drops to 198, 184, or even 159
Kris/Mindbloome Exchange
Trade What You See

Trump Coin's Wild Ride: Breaking Fibonacci to $115 or Busting toGood morning trading family! Here are the key levels to watch for $TRUMP:
Resistance to Break: Keep an eye on the 38.2% Fibonacci level. If $TRUMP breaks above this, watch for:
$89 - First significant target if the break is confirmed.
$104 - Another potential milestone.
$115 - The highest optimistic target if momentum continues.
Support to Hold: If $TRUMP fails to break above the 46 range, watch for a potential drop to:
$25 - A critical support level where the price might find a floor or continue to decline.
These levels will guide whether $TRUMP climbs the stairs or slides down. Last minute: If you found this analysis valuable, boost it with a like, share, or send me a DM if you need help.
Kris/Mindbloome Exchange
Trade What You See

ChainLink | LINK , TRUMP & Grayscale LINK pumped 500% since our last signal so Its time to Celebrate the New Year with Crypto
Chainlink isn’t just mooning on price it’s taking the crown in the real world assets (RWA) sector. LINK is leading the pack in development activity, leaving Ethereum based Synthetix (SNX) and the privacy savvy Dusk Foundation (DUSK) playing catch up
Price Up, GitHub Busy, and a New Year’s Party to Crash
The numbers? Chainlink flexed nearly 394 GitHub events in the past 30 days, compared to Synthetix's 176.6 and Dusk's 34.7. Meanwhile, Polymesh (POLYX) and Maker (MKR) aren’t far behind, clocking in at 25.9 and 21.7, respectively
Chainlink’s onchain momentum and fundamentals are bullish as well, growing active addresses and an all time high futures open interest of $770.27M are just tip of the iceberg. Grayscale announced that it has opened Grayscale LINK Trust to qualified investors, a fund that enables investors to gain exposure to XRP in the form of securities. As of December 12, Grayscale LINK Trust had a net asset value of $111.91 per share and $30,468,812 in assets under management
Chainlink's LINK token is experiencing a notable increase in price and market activity, fueled by a strategic investment from World Liberty Financial (WLFI), a project backed by Donald Trump’s family. WLFI recently expanded its holdings by purchasing an additional $1 million worth of LINK, raising its total investment in the token to $2 million.
LINK is trading at $29.4 (+1.5% over 24 hours), while its all time high of $52.82 (May 2021) is still 44% away. But hey, it's already the life of the crypto party, with a $1.1B daily trading volume and active trading on 99 exchanges, led by Binance. Market cap? A cool $18.6B
it’s a good time to toast to LINK’s rise🍾

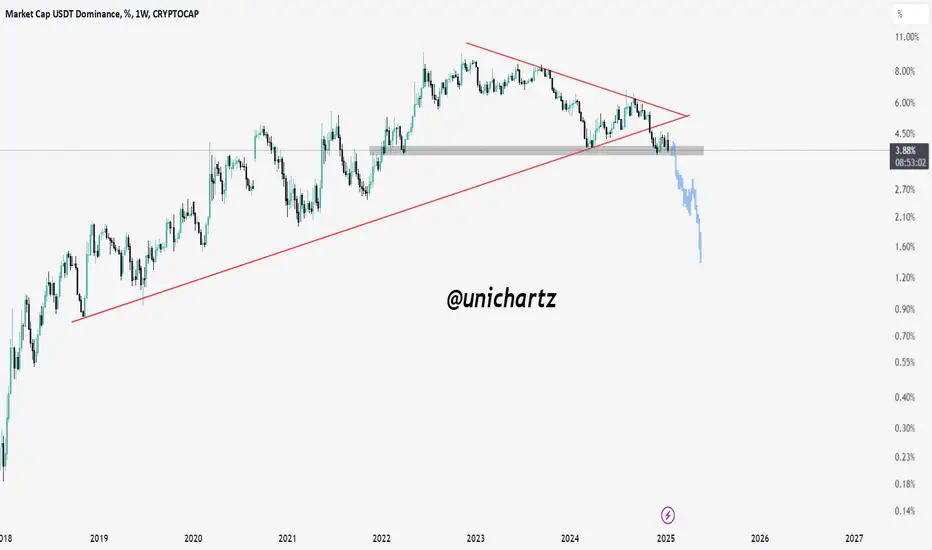
USDT.D Retests Breakdown: Is a Strong Altcoin Rally Ahead?USDT Dominance (USDT.D) has broken below its rising trendline and is trading at a key support zone after a successful retest of the breakdown. A break below this support could trigger a sharp decline, signaling capital rotation into altcoins.
This setup aligns with the potential for a strong altcoin season and an active trading period ahead.
SOL & Memes | Is Solana season here ?From Weekend Hero to Market King
Sol szn is here ? YESS, We are 70% up since our last analysis and recent data strongly suggests we might be entering the early days of SOL mania, Here’s why
1.SOL Outperformed BTC and ETH This Weekend: Solana delivered significantly better returns compared to Bitcoin and Ethereum over the weekend. don't let me compare it with Eth cuz it will break Eth holders Soul
2.Market Cap Milestone: Solana's total market capitalization hit an all time high earlier today, now making up 3.53% of the entire cryptocurrency market with a valuation of $114.3 billion.
3.Dominating Daily Net Inflows: As of now, SOL tops the leaderboard for daily net inflows.
4.Revenue Growth: Last week, Solana’s Real Economic Value (the revenue it generates) doubled its previous all-time high.
5.Meme coins often choose the Solana blockchain for a variety of reasons, primarily due to its unique technical advantages and its growing ecosystem. Here’s why: Low Transaction Costs, High Throughput and Scalability, Fast Transaction Speed, Strong Community and Ecosystem,Developer-Friendly Environment, Early Mover Advantage...
6.Weekend Trading Volumes: Between Saturday and Sunday night, SOL trading volumes surpassed those of all major altcoins.
All of this recent movement is huge for two specific groups of people:
-My wife, who has been worried sick since I told her I invested 100% of my life savings in Solana!
-Our followers, who got worded up on SOL around this time last year and load the dip at 20$
But will these trends hold, especially after ETH and BTC ETFs wrap up their first trading day of the week? Probably not but it’s worth noting how impressive this is, given Ethereum’s market cap is 3.3x larger than Solana’s, and Bitcoin’s is a staggering 16x bigger!
As you can see Sol ready for correction and pullback then it gets ready for Sol Mania

Bitcoin's Bullish Surge: Is a New All-Time High Imminent?BTC/USDT has successfully broken out of a descending triangle, reclaiming momentum and trading above a key resistance level, which has now turned into strong support.
Supported by the ascending trendline, Bitcoin is showing a bullish trajectory and appears poised to test the all-time high (ATH) zone.

Bitcoin 240000$ This Bitcoin (BTC/USD) chart uses the Fibonacci extension tool to project possible future price levels. The key observations are:
1. Current Price and Breakout: BTC is trading at $105,019, having surged significantly beyond previous resistance levels.
2. Fibonacci Levels: The price has surpassed the 0.618 Fibonacci extension level at $99,745, a crucial bullish signal.
3. Next Targets: The next Fibonacci extensions are at:
$151,950 (1.618 level)
$204,154 (2.618 level)
$236,416 (3.618 level), nearing $240,000

SOL on the edge ETF Decision & Strategic Reserve News to TriggerTechnical Analysis
1. Descending Channel
The price has been consolidating within the descending channel since November, consistently bouncing off the upper and lower boundaries.
A breakout above the channel would signify a bullish reversal and a possible surge toward higher resistance levels, such as $220 and $240.
2. Current Momentum
The price is near the upper boundary of the channel at $204. A successful breakout accompanied by strong volume would confirm a bullish move.
3. Targets After Breakout
Immediate target $220 (previous support turned resistance).
Extended target $240-$280, depending on momentum and news impact.
News/Event Driven Catalysts:
1. Solana ETF Decision
The U.S. SEC decision on a Solana ETF within the next 8 days is a crucial factor. If approved, this would open the doors for institutional investment in Solana, significantly increasing demand and price.
Historically, ETF approvals for assets have led to sharp price rallies, often breaking technical resistances.
2. Trump’s Strategic Reserve Plans
The announcement that the U.S. President-elect is considering cryptocurrencies like Solana for a national reserve creates a bullish sentiment. If implemented, this could position Solana as a strategic asset in the crypto space, attracting major investors and long-term holders.
3. Market Sentiment:
Positive news about an altcoin reserve and Solana’s inclusion could further amplify its status as a leading blockchain in the market, pushing prices higher.
Potential Scenarios
1. Bullish Scenario (Breakout)
If the SEC approves the Solana ETF and positive sentiment continues, the price is likely to break above the channel.
Key levels to watch post-breakout: $220 (immediate resistance), $240, and $280.
2. Bearish Scenario (Rejection)
If the ETF is rejected or market sentiment turns negative, the price might face rejection at the upper boundary of the channel.
Downside levels to watch: $180 (support within the channel) and $165 (channel bottom).
This chart and the accompanying news strongly indicate that Solana is at a pivotal moment. Traders should monitor the channel breakout closely and pay attention to ETF-related news and market reactions. With the potential approval of the ETF and increasing institutional interest, Solana could experience a significant rally, making it a key asset to watch in the short term.