CRYPTO TOTAL MCwith Elliott impulse waves we can see that we are at the final 5th wave, and this wave will be very huge.
I expect we will reach a total market cap between (8.17T to 12T)
after that there will be a huge beer market.
Good Luck Guys.
Cryptopattern

Ocean/Usdt IdeaOcean forming inverse head and shoulders, just broke falling wedge leaving a breaker block behind, im looking at entry on retest on neck/trendline or retrace to breaker. This is NFA.

SUSHI 1W bullish if breaks resistanceSUSHI testing resistance on the weekly timeframe. Breaking out of resistance trendline will be bullish. Targets : 1, 1.645.

NEAR testing ALPHA indicatorHi friends, I'm testing a slightly modified script on my indicator, we'll see what it brings or if it will require more data to trade, I'll leave SL to you or the pyramid, it's definitely got somewhere to go, it's about how the market will be. So far everything looks according to my summer scenario. However, I enjoy trying Long positions in this difficult period.

Btc price divided by inflationI have seen that is a nice trend analysis, before my chart blocked , I found the dip with this trend , and we see triangles from macroperspective , I am waiting for price action comes to inside of triangle

Ethereum longEthereum has formed "Double bottom" pattern. Bullish movement to resistance level at 4120 is expected to happen.

Bullflag -The Bullish patternThe Flag pattern is one of the best-known continuation pattern in trading which happen after an uptrend.On-chart you can see a good pump and after a minor consolidation zone.This consolidation zone is important to calm down slowly indicators and calm volume,after this step we can see a growth of volume and a breakout
What is the target of a bullflag?
The first target of confirmed can be derived from measured move tehnique.The first target of bullflag is the vertical distance between the lower and the uper point of flag
The second target is the size of the FLAGPOLE(measure the flagpole size and you will put this size at the breaking point from the bullflag
It s important to book some profit also after the first target(size of flag).
If the flag during too much will fail.Keep your eyes on it all time and have a stop-loss
Have fun and good luck!

BTC giving bearish signals1. Forming a rising wedge - if it occurs in a downtrend then it acts as a continuation pattern and in an uptrend its a reversal pattern.
2. Bearish divergence on RSI and MACD
Waiting for the confirmation if it breaks below the rising wedge, target of a dip is shown in the chart.


GRTUSDT ‘The graph’ long speculationRecently announced parachain with dot, more fundamental news pointing to this coin being undervalued perhaps, saw a break, retest now it looks like we are seeing rejection and we are just waiting for the consolidation. Prob in the W form previously mentioned (all these coins seem to like it). TA pointing good (although we don’t even have a 100 day moving average this is how new this coin is lol). Mid term levels noted. This is another long term coin that I will look to take partials along the way. If you wish to know any of my longer term levels on Grt or any other questions don’t hesitate to dm. This is not financial advice. Happy trading!
Ngs

BTCUSD In-Profit!If You Follow My Signal A Couple Of Days Ago, You Are In Profit Right Now.
With Entry Of: 10.5K
Stop Loss Can Now Be Moved Up To 11K
Our Previous Resistance (Yellow Line), Now Acting As A Support
--> NEXT TARGET: $12,450 (Which Was Also The Previous Resistance We Got Rejected On)
*If You Have No Position (Jumping In Right Now Is Risky (R/R Isn't As Good)
LET ME KNOW WHAT YOU THINK! 🧐
💡 IF YOU LIKE MY IDEA, PLEASE HELP AND SUPPORT MY CHANNEL BY
HITTING THE THUMBS UP, LEAVING A COMMENT AND FOLLOWING 💯
*You are Welcome to Request Chart Analysis at Anytime! Simply Comment Down Below or DM Me :)
````````````````````````````````````
⚠ DISCLAIMER:
Trading Involves High Risk! I Share My Trading Positions And Ideas With You For FREE
BUT Please Be Responsible For All Your Actions.
This Chart is Used for Educational Purposes Only And NOT A Recommendation to Buy or Sell the Asset.

CRYPTO MARKETCAP TO 450B !! FRACTALS FROM SPRING 2019 PLAYING OUT
We Are Seeing The Same Pattern Bouncing Back On Support/Resistance Of An Up-Trending Channel.
TARGET: 450B MCAP
*Need To Break Above 363B (Current Resistance)
*Volume Indicates Stronger Buying, Most Likely From Institutional Investors
LET ME KNOW WHAT YOU THINK! 🧐
💡 IF YOU LIKE MY IDEA, PLEASE HELP AND SUPPORT MY CHANNEL BY
HITTING THE THUMBS UP, LEAVING A COMMENT AND FOLLOWING 💯
*You are Welcome to Request Chart Analysis at Anytime! Simply Comment Down Below or DM Me :)
````````````````````````````````````
⚠ DISCLAIMER:
Trading Involves High Risk! I Share My Trading Positions And Ideas With You For FREE
BUT Please Be Responsible For All Your Actions.
This Chart is Used for Educational Purposes Only And NOT A Recommendation to Buy or Sell the Asset.

KA-BOOM! AUTO-MATICI circled a fractal which was present prior to the October 2019 pump...which preceded the November 2019 mega pump. Prior the the October 2019 pump we got a dip in the Advanced Decline Line (ADL); which the vertical gray lines represent that point in time graphically. I believe we are currently in a similar period now. With the top trend line perpetually converging down on the current price range... this seems like an easy one.
THIS IS NOT FINANCIAL ADVISE. CRYPTO IS HIGHLY VOLITILE.

DASH 60 May [Big Flat till September`20] Flat on a DASH, don`t miss it.
On a middle of May we will get 60. After that price will go to 80...
It show us some fractal and Dash pattern (orange triangle)
To the end of Summer we can wait any growth
So, will see

TNT/BTC LONG - How fractals will help you increase your RHey everyone!
Due to the fact that we have a finite amount of capital, trade selection becomes key.
What trade should we enter if we're following 5 setups that comply with our trading strategy?
All five with the same size? - but doesn't each setup have it's own timeframe and Risk-Reward-Ratio?
That's where it starts getting more tricky. The beast that we are confronting here is the idea of opportunity cost - capital allocation into any endeavor carries such a cost because there is a risk of our analysis being less than optimal.
And that's alright (if you don't punish yourself too harshly on the randomness of trading).
That's why I decided to share this setup on TNT/BTC with the intent of demonstrating this fact. As you can see, the setup is currently active from the biggest price structure and pending to trigger a fractal on a shorter timeframe.
This is great news, fractal patterns generally occur when our assessment of the main trend is correct, however let's go back to the main point here: having missed the main entry, the setup can still give us opportunities to ride the wave until the initial take profit, such as in this case.
But note, we are entering the market at a later stage, which leaves us less time in the market and with a greater Risk-Reward-Ratio if we take the entry and stop loss of the fractal setup (which is a setup by itself with take profit at 1040 sats) while taking the take profit level of the main setup.
In this instance, this approach adds 2R to your capital whilst diminishing the time you are in the market!
Marvelous and worthy to keep in mind for next time.
Take care,
Vlad The Crypto Trader

The Seahorse PatternI never say never but it would completely throw my medium-term projections out the door.
Not that I'll be whinging. :)
My Secret Chart
_______________________
There's only one person you need to follow when it comes to crypto.

Bitcoin mirror pattern - SHORT short term, LONG mid/long termThe mid-term accumulation pattern repeats itself twice and confirms bullish on the third try breaking out and consolidating on the prior resistance. NVT currently in high territory indicating a short term pullback is very likely.
Some additional assumptions :
- btc to reach $8'500 by dec 2019
- btc to reach $18'500 or ATH by dec 2020
- btc to reach $180'000 - $280'000 by mar 2022-2023
- accumulation zone expected to bounce between a 33%-50% range from mean of q1 2019. ~$4'230 low and q2 2019 expected at ~$5'230 => avg: $4'800
- Using ~40% consolidation zone average, we apply 20%-(wicks)25% possibility to both the upside and downside
- 1/5th capital left remaining to add low-mid leveraged positions if there's a final capitulation to the lower $2'000 range which looks very unlikely (<1/5).
In conclusion:
Anywhere near the $4'000 level is a decent long entry zone (short/mid/long-term) and $5'800 a decent short entry zone (short-term)
Please feel to share your thoughts/charts feedback on this chart.
COINBASE:BTCUSD

FUEL BTC SELL FASTFUELBTC is situated into an ascending channel which probably will breakdown becouse we have a STOCH bearish cross confirmed and also we will hit the haard ichimoku resistance.
If you have FUEL, sell it.
1st support 338
2nd support 307
3th support 268
Sell it and wait for re-entry.
Have FUN

STRATIS BTC BREAKOUTStratis agains BTC is situated into a BULLFLAG IN 1D TIMEFRAME so we have chance to see a great breakout.This setup is easy,volume it s still good for this breakout
STOPLOSS AT 2388 sats.
You have the targets above.still easy breakout setup.
ENJOY

BTC ETH When MOON?
You can see here a crypto market cycle.First all time we had accumulation which means low volume and not much movement in coin(exactly what you can see now in the market) and after we will see again huge pumps
Accumulation between 13 november 2015-25 dec 2015 after huge pump which means 947.90% potentialy GAINS
Accumulation between 9 dec 2016-3 feb 2017 and after huge pump which means 1162.02% potentialy gains. After this huge pumps we needed a huge retrace which was the falling wedge. After broked out this falling wedge and re-tested it (which is a reversal pattern) the price continued to going up untill 0.786 fib resistance which means 0.1236 sats per coin
Now,in my opinion we are into accumulation zone BUT it s very important to understand if BITCOIN will breaking down all altcoins will going down and ETH will touch probably they GLOBAL SUPPORT LINE which means 0.00186-0.00188 sats
LONG TERM TARGET(Late 2019):0.618 fib resistance which is 0.0974
-0.786 resistance which is 0.1236 sats

XZC HUGE PUUMPXZC Now formed a HUGE bullish divergence in big timeframes 1D,1W,1MONTH it s really really bullish ,now is in accumulation phase and we are waiting for a huge pump
First huge resistance is at 0.00304 satoshi 0.236 fibonaci which is our first target, second is 0.382 fibonaci which is 0.00466 satoshi
December 10 HARDFORK(check oficial source from their twitter)
At the moment we are below ichimoku resistance but after 17 november resistance from ichimoku will dissapear so after we can grow easy.

SC COIN of the month?Siacoin is now into a hard uptrend becouse in 31 oct have a hardfork and also you can count in eliot waves and ichimoku which is strong indicators in T.A.
Eliot waves has has a target of 150-155 sats which is the monthly resistence.
We are above ichimoku cloud which is a very powerul bullish sign,but if btc made a flashcrash we can drop to 80-88 sats but this will be a very good oportunity to BUY how much sc you can
MACD is bearish and we can drop a little bit more
Stoch has also room to drop a little that s the reason why i told you to watch these supports
RSI bullish divergence
Now at the moment we have mixed signals ,also bearish and bullish but you can count on BTC and a powerful SC event which is the hardfork
BTC cboe futures will expire in 16 october and after the market will turn bullish at CME futures which is expires in 26 oct
In 26 october also we are waiting for 9 ETF decisions which will bring in the market bullish sentiment and a lot of hype
In few days also have to appear the exchanges which will support this fork
SC can be the coin of the month

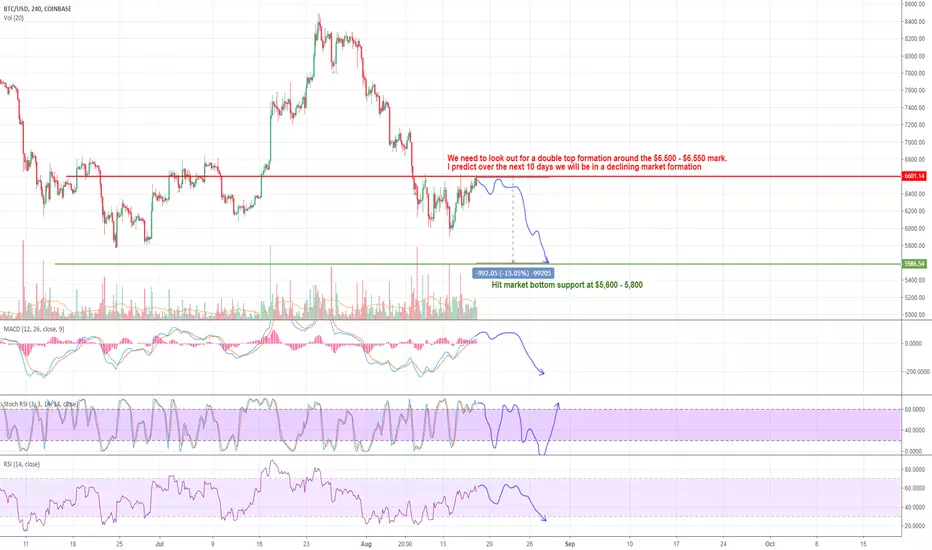
Bitcoin $5,500 range in the next 10 days? Hi TradingView Family,
I am going to let this chart sit here and do the talking. I do not think we are in the clear yet for a positive range north of $6,500. i think the next "true" run will be after this movement. Every time we hit the $5,800 number we have always tested and bounced north but each time the positive rebound waves get smaller from Feb, April, until now. Ultimately we are forming a large cup and handle and are pretty much forming the middle of the larger cup.
We can delve into market news and psychology, but i think i have gone into good enough detail via my telegram vlog updates.
The blue lines are the rough guestimate path of BTC over the next 10 days on all indicators MACD, STOCH & RSI and price points. I will give you guys more updates throughout the week. Hope you all have a great weekend!
Happy Hunting Reg!