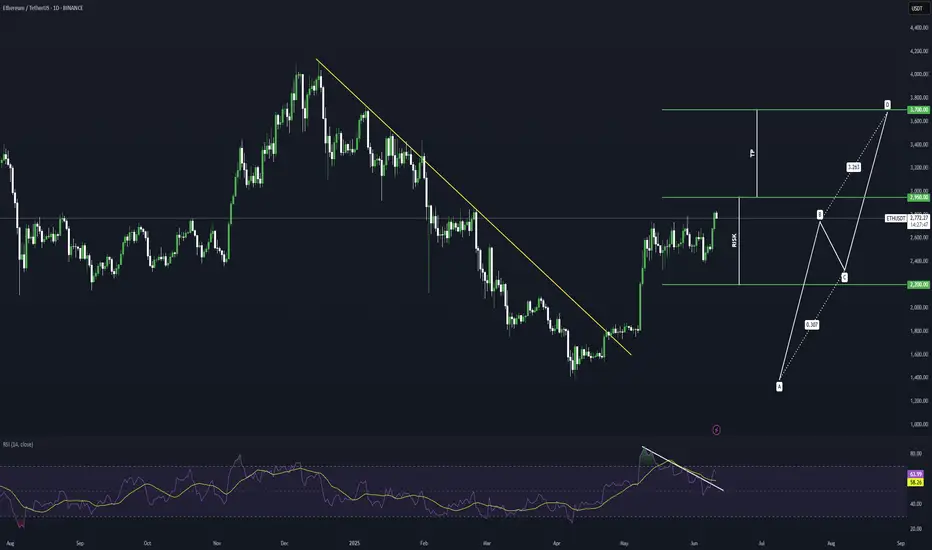
ETHEREUM Potential Bullish BreakoutEthereum price seems to exhibit signs of overall potential Bullish momentum if the price action forms a prominent Higher High with multiple confluences through key Fibonacci and Support levels which presents us with a potential long opportunity.
Trade Plan:
Entry : 2950
Stop Loss : 2200
TP 1 : 3700
Cryptoprogress
XRP Weekly-Monthly Analysis / Retracement Levels for BuyTHEN - NOW@ XRP Weekly-Monthly Analysis / Retracement Levels for Buy (...and we keep going)
Weekly - Monthly trend: Bearish
Chart Pattern: Head & Shoulders (H&S) - Bearish Continuation Pattern
Bearish Candlesticks signals:
HANGING MAN (Bearish, Single Candlestick pattern) / Weekly Timeframe / 09 DEC 2024
BEARISH ENGULFING (Bearish, Double Candlestick pattern)/ weekly Timeframe / 27 JAN 2025
TWEEZER TOP (Bearish, Double Candlestick pattern) / 1 Day timeframe / 20 FEB 2025
FALLING THREE METHODS (Bearish, five-fold Candlestick pattern) / 1 Day timeframe / 07 MAR 2025
BEARISH ENGULFING (Bearish, Double Candlestick pattern)/ weekly Timeframe / 24 MARCH 2025
Retracement Fib Price Levels:
0.00% (3.4000)
23.60% (2.6879)
38.20% (2.2474)
50.00% (1.8914)
61.80% (1.5353)
78.60% (1.0284)
100.00% (0.3827)
Good prices for buy (the lower the better):
61.80% (1.5353) – Golden Zone / Golden Pocket
78.60% (1.0284) – Entry Zone
Between 78.60% (1.0284) and 100.00% (0.3827) is the Risk Zone, which we have the Neckline of the ‘’ Quadruple Bottom Pattern ‘’ at the price range ‘’ 0.6291 – 0.7850 ‘’

BITCOIN 50 & 100 SMA Patterns since 2014 -UPDATE - ATH in Q4 ?This is a long post but please read it all, there are some Major things to take note of.
The Main item in this post is the day counts between 50 SMA ( RED ) and 100 SMA ( BLUE ) and the days between Cross overs of these.
The upper day counts on the chart, count from ATH to when 50 crosses below the 100.
Then from that point to when the 50 Crosses back Above the 100
And then, in Grey, the number of days from Cross over to ATH
From 2014 ATH to 50 dropping Below = 504 days
When the 50 returned Above the 100 = 406 days
And from that point to the 2017 ATH = 560 days
From 2017 ATH to 50 dropping Below = 448 days
When the 50 returned Above the 100 = 284 days
And from that point to the 2021 ATH = 686 days ( I am using the Nov 2921 ATH as it was the higher price )
From 2021 ATH to 50 dropping Below = 308 days
When the 50 returned Above the 100 = 441 days
And from that point to the 2025 ATH = The average of the 2 previous is 623 days and takes us to a possible ATH in August, though I feel this is too soon.
If we Look at the day count from ATH to 50 dropping below 100
From 2014 ATH to 50 dropping Below = 504 days
From 2017 ATH to 50 dropping Below = 448 days
From 2021 ATH to 50 dropping Below = 308 days
Could this point towards around 200 days after ATH in 2025?
( This reduction in day count is most likely due ti rapid Profit taking. )
What is interesting is how, on Both the 2014 - 2017 and 2017 - 2021 ATH it was approx 1005 days between the 50 rising above the 100 to when ot fell back below after an ATH. This is Despite a variation in the days count between SMA cross overs.
Using this day count and projecting forward, maybe we can expect the 50 to drop back below the 100 in August 2026, next year
Using the day count from ATH to when 50 Drops below, that was mentioned above, that is around 200 days after ATH and using that August date just mentioned, We are projecting a Cycle ATH in Feb 2026 !
This is NOT a realistic date if we are to remain in the patterns of ATH in late Q4, that we have had every previous cycle.
As I pointed out in a post yesterday, the traditional patterns of Bitcoin HAVE to change this year.
And to many extents, they already have begun.
Take a Look at the angle of ascent of the 50 and 100 SMA's since 2014. Each cycle has seen a reduction of Steepness of Rise.... A slowing down on trajectory and this is most likely caused by the increase of price of a Bitcoin.
The more expensive it gets, the heavier it is to move PA higher.
So far this cycle, PA has landed on the 50 SMA twice and we are SO Close to doing that again.
This has NEVER happened before.
In 2021, we did it once and bounced to the Nov 2021 ATH, so far this cycle, we have done that twice.
This ARE CHANGING and for this to continue, we do need to see PA Bounce again off the 50, when the Bulls are ready.
The ATH in Q4 is open to question as a result. It may happen anytime from Late Q3 to Late Q1 2026
And we are only going to find out when it happens.
But be aware f things changing.
Because they are and so using History may become unusable....a bit like Price discoveryIt will become Trend discovery
Enjoy

Keep it simple - set and forget !!1. Accumulate when prices are between 78,000 and 85,000.
2. Sell a portion when prices hit 120,000 to 130,000 - probably this cycle top.
3. Start accumulating again when prices drop to 57,000 to 67,000 for the next cycle.
4. Set price alerts and let it go – don’t worry about checking constantly!
This way, you can stick to the plan without stressing over every price change.
There’s no such thing as getting rich overnight for the average person. Achieving great things takes time and effort. Success is a journey, not a shortcut!!!
NFA

USDT going under water.Check USDC reports backed by black rock. If you are holding USDT please please convert them into USDC. Check my bio to know more.

Xai / Usdt BINANCE:XAIUSDT
** NASDAQ:XAI 110 Days Range Breakout Expected!** 🚀
This is **typically a good asset to hold on SPOT** during the coming days! 📈
**Pump Potential**: **+35% - 50%** 📈
**Main Resistances**:
- **$0.2600**
- **$0.3050**
- **$0.3600**
- **$0.3950**
The **weekly view** looks strong, indicating positive movement ahead! 🌟
**See you in a few days!** 🚀
**Tell others** 📣
*This is not financial advice.* 🙅♂️📊

Market (Sectors) Performance OutlookSince November 6th, we’ve witnessed a seismic shift in the market landscape, with crypto breaking through and outperforming the broader market. 📈
The sectors leading the charge against the S&P 500 are XLY, XLE, XLF, XLC, and XLK. Notably, the MAG 7 have also been outpacing the market since November 7th. 💪
Smart money seems to be flowing into crypto, contributing to the sell-off in the S&P 500.
From a macroeconomic perspective, XLK and XLC have been market leaders for the past few months. However, it might be time to pivot towards the Energy sector, especially after a stellar earnings season where major E&P companies smashed their earnings estimates. ⚡️
Stay tuned and ready to capitalize on these dynamic market movements! 📊💼

The Macro Picture Few Are Watching: Bitcoin Dominance in the FinAs we approach what could be the final leg of this bull market, Bitcoin Dominance ( CRYPTOCAP:BTC.D ) is set to become a critical indicator. Historically, a peak in BTC dominance has often preceded liquidity spillovers into the broader crypto market, igniting a wave of speculative fervor across altcoins. This time, as BTC dominance nears pivotal levels, we may be entering a similar phase, marked by heightened volatility and shifting market dynamics.
The chart suggests that BTC dominance could soon experience a reversal, signaling the start of widespread capital rotation within the crypto space. Observing BTC dominance during this period will provide early clues about market sentiment, helping investors to time entry and exit points with precision.
I’ll be closely monitoring this metric and will provide timely updates as we approach potential inflection points. This shift could begin within the next 1-6 weeks.

XRPUSD finally made a preparation of ROCKET to the MOONBINANCE:XRPUSDT Currently price consolidating after the long time BOS zone
Now we waiting the finally move of small drop about last LEG
LAST leg would be bring to us more BUYERS it means BULL RUN incoming very soon
Last couple months price ranged area 0.4-0.6$
I am so excited XRP price action chart looks clean for me
I HOPE WE WILL GO TO THE MOON SOON WITH XRP

TONCOIN - A Possible "Cup and Handle" PatternIt is almost at the half of the handle, but we need to wait a little bit more to be sure. If it happens, it is possible to break the $3 resistance, as well as reaching the next milestone, $4..
Also see my previous TONCOIN idea that made nearly 100% profit in short time.

BTCUSD / BTCUSDT / BTCUSDT.PSell side curve. Hope this works today let's see what will happen. Let me know if you see anyhow different

NEAR Impending Correction!!It is prudent to exercise caution and abstain from initiating any trades until the asset transitions into the "POI" zone, which aligns with our downward targets.
Liquidity has been withdrawn from the range approximately between 6.17 and 6.20. We are nearing a significant "FVG" point, poised for trading opportunities.
Upon entering the favorable zone where decisive actions can be made (POI), we will transition to lower time frames ("LTF") to identify shorting setups, ensuring confirmation before execution.

RNDR could breakout!!!!RNDR is at the supply zone if this will is flipped then its next target is $4.9625
Entry: closing of 4 hours above the supply zone
TP: 4.9625
SL: 4.119 if 4 4-hour candle closes below the demand zone which is currently a supply zone.

APT Structure Turns To Bearish!!!APT changed its structure from bullish to bearish after making a double top with divergence and breaking HL, Now it will hopefully retest the current resistance for making new LH and go towards the target.
Entry: Cmp and 9.82
Tp: 8.39
Sl: 10.43

The cup and handle formation XRPUSDTHow Did the Cup and Handle Pattern Form?
The cup and handle formation appears when there has been an upward movement pattern. This is a bullish upward continued pattern.
The trend is confirmed as cup and handle formation only when the stock price surpasses the resistance level and shows an upward movement. Only then can a trader get a confirmation that the higher price stock movement is going to sustain.
When a stock begins to move upwards and shows a bullish pattern, traders continue to invest in the stock’s growth and positive trend. As the stock breaches high levels, investors who came in at the beginning of the uptrend start booking profits. At this level, the upward trend halts, and the price falls with selling pressure. At this stage, the cup formation curves downwards in a bowl shape. As traders and investors continue to book profits, the cup moves lower, indicating a temporary downward cup.
At these levels, savvy investors, traders, and institutions begin to pump funds into the stock at attractive levels due to the fundamentals of the stock or value buying. At these low price levels, buying comes in, and with buying pressure, the cup curvature starts moving up to reach the resistance line. At this stage, an entire curved bowl-shaped cup is seen.
The handle emerging here is interesting to note and indicates human psychology. The trader who had invested at the peak of the resistance line before the stock dipped is eager to take his capital back as the stock moves up. Moment stock touches the resistance level, and this trader sells. Also, the traders who started buying at the bottom of the cup look at the resistance point as a safety level to book profits. There is selling pressure at resistance levels, and the upward cup shape is halted.
The volume of stocks also identifies the cup and handle at the beginning of formation at the end of the cup curve. The volume of shares is low at the end of cup formation as the selling is not heavy here. The investors who bought at the previous resistance level their capital and sell. Short-term traders without a fundamental view sell at the seeming peak of the stock.
The institutions and experienced investors hold on to the stock bout at cup bottom. The selling volumes are low and don’t push the stock price down. The buying also continues, and if large volumes of buying hold, the stock breaks the resistance level, and upward trends emerge, making a handle pattern.

$Bitcoin - Its all in the charts.As can be seen, BTC is moving in a curve. This curve seems to have found bottom around 16k for this cycle and is right now hugging the bottom trend line.
-Given this curve, will we see 16k again?
-Looking at the historicals, most likely not. But IF the price action breaks the bottom trendline then that will be a first and after that anything can happen.
If everything goes according to plan, and by plan I mean according to history, we should see a cycle top around next year second half, latest by start of 2025 but we may not need that much time.
-What will be the catalyst for a new cycle top?
-No idea. I make my decisions only looking at the chart and not news.
-Can I be wrong?
-Maybe, maybe not.
Only thing we as investors can do, is to DCA our position and wait.

AVAXUSDT Technical AnalysisTo all you cryptocurrency enthusiasts: We'll be keeping an eye on AVAXUSDT in the 10, 9, 22, and 7 zones for bullish momentum. Smart investment

$SYS/USDT Bullish signThere is news expected for 28th of June, I think there will be quite much fomo for it, also chart could find its bottom. Me personally expecting LSE:SYS price to go up tp $0.5, but as a short term target I would put $0.20. If you are going to use this suggestion, make sure you use Stop Loss too!

id - can increase#if you like the idea, please "Like" it. This is the best "Thanks!" for the author 😊 P.S. Always do your own analysis before a trade. Put a stop loss. Fix profits in installments. Withdraw profits in fiat and please yourself and your friends.

$PEPE bullish signsHere is the technical analysis for FWB:PEPE , I think resistance will be broken in upcoming days/hours, and when it is done it is a clear signal to another resistance which is the .19$ zone. Trade under your research and risk!

Bullish Hidden Divergence $PEPEI found out Bullish Hidden Divergence for $PEPE.
It is also in the support zone. If support doesn`t break, then huge parabolic prices are coming!
Just wait for what happens with the support zone, I suggest using Stop Loss!
Seems in my previous analysis I missed where should wave B ended, but now it seems to be finished mostly, because of these points:
1. Bullish hidden divergence
2. Support zone.
I think it is ready to start wave C.
Disclaimer: Use stop loss and trade with your own risks.

LTCUSDT 15M TF,HAVE A LOOKMEXC:LTCUSDT.P
Currently testing 15M TF Resistance zone i have shared my trading set up in the pic.

Keep an eye on $EDU/USDTTarget mentioned
Noted: Not a financial advisor.
It's always recommended to carefully consider all the factors and conduct thorough research before making any investment decisions. I suggest seeking advice from a licensed financial advisor.
