Trading opportunity for ENAUSDTBased on technical factors there is a Sell position in :
📊 ENAUSDT
🔴 Sell Now
🪫Stop loss 1.31
🔋Target 1 0.89
🔋Target 2 0.75
🔋Target 3 0.62
💸RISK : 1%
We hope it is profitable for you ❤️
Please support our activity with your likes👍 and comments📝
Cryptos

BTCUSDTBTC price is still in a strong uptrend. Now the price may have a short-term correction. So if the price cannot break through the 107895 level, it is expected that the price will go down. Consider selling the red zone.
🔥Trading futures, forex, CFDs and stocks carries a risk of loss.
Please consider carefully whether such trading is suitable for you.
>>GooD Luck 😊
❤️ Like and subscribe to never miss a new idea!

ETHBTC Is Sitting At Strong Monthly SupportETHBTC cross pair has been trading bearish for the last two years or so due to Bitcoin dominance, but now that Bitcoin dominance is slowing down and ALTcoin dominance kicking in, seems like we are in the ALTseason and ETHBTC pair may see a recovery soon.
ETHBTC chart can be actually still trading in a correction within uptrend. It’s right now sitting at interesting and strong support area when looking at the monthly chart. We have strong monthly trendline and impulsive five waves up, followed by a three-wave A-B-C correction into an important 67,8% Fibo retracement, which is a bullish pattern from technical and Elliott wave perspective. We are actually already in the ALTseason and if ETHBTC pair is really about to bounce and starts recovering soon, then ALTseason may resume and Ethereum can be one of the strongest.

ETHUSDT - the last chance!nothing changed in ETH still bullish , stick with our plan 👇
weekly chart displays successful breakout , retest of massive symmetrical triangle..
price projection shown in chart ..
best regards Ceciliones🎯

Trading opportunity for PRCLUSDTBased on technical factors there is a Buy position in :
📊 PRCLUSDT
🔵 Buy Now
🪫Stop loss 0.4820
🔋Target 1 0.7100
🔋Target 2 0.8550
🔋Target 3 1.1000
💸RISK : 1%
We hope it is profitable for you ❤️
Please support our activity with your likes👍 and comments📝

BTCUSDTBTC price is still in a strong uptrend. Now the price may have a short-term correction. So if the price cannot break through the 106503 level, it is expected that the price will go down. Consider selling the red zone.
🔥Trading futures, forex, CFDs and stocks carries a risk of loss.
Please consider carefully whether such trading is suitable for you.
>>GooD Luck 😊
❤️ Like and subscribe to never miss a new idea!


BinanceRetesting recent breakout. If binance stays above the breakout level, other big tokens will follow

Trading opportunity for DOGEUSDTBased on technical factors there is a Sell position in :
📊 DOGEUSDT
🔴 Sell Now
🪫Stop loss 0.49100
🔋Target 1 0.28550
🔋Target 2 0.23550
🔋Target 3 0.16910
💸RISK : 1%
We hope it is profitable for you ❤️
Please support our activity with your likes👍 and comments📝

Trading opportunity for PENDLEUSDTBased on technical factors there is a Sell position in :
📊 PENDLEUSDT
🔴 Sell Now
🪫Stop loss 6.890
🔋Target 1 4.778
🔋Target 2 4.100
🔋Target 3 3.510
💸RISK : 1%
We hope it is profitable for you ❤️
Please support our activity with your likes👍 and comments📝

Bitcoin Is About To Enter 100K Area SoonBitcoin with ticker BTCUSD is coming and moving nicely higher as expected, after Donald Trump won US elections, so coin remains in a strong bullish five-wave impulse on a daily chart with room even up to 130k-150k area. Price came nicely higher, out of a recent wave 4 consolidation into wave 5 of an extended wave (3) close to 100k area in the 4-hour chart. Now that BTC is slowing down, seems like it's making a higher degree correction in wave (4) before the uptrend for wave (5) of 3 towards 100k area resumes. It's ideally forming a bullish triangle pattern in wave (4), but alternatively be also aware of a deeper correction, which can still retest 90k-85k support zone.

HBAR LONG SET UPTitle: BUY HBAR
Asset: Crypto
Symbol: HBAR/USD
Time Frame: 4hr
Platform: Coinbase
Entry Price 1: $0.27500
Entry Price 2: $0.23500
Stop Loss: $0.19500
Take Profit 1: $0.33500
Take Profit 2: $0.37500
Take Profit 3: $0.42500
Status: ACTIVE

BTC/USD LONG SET UP BITCOINTitle: BTC/USD BUY (BITCOIN)
Asset: Crypto
Symbol: BTC/USD
Order Type: Buy Limit
Time Frame: 1D
Platform: Coinbase or MT4
Entry Price 1: $95,500
Entry Price 2: $90,500
Stop Loss: $85,500
Take Profit 1: $100,500
Take Profit 2: $105,500
Take Profit 3: $115,500
Status: ACTIVE

Floki (FLOKI) - Trade Update!Hey team! Let’s talk about my latest trade on Floki:
- Market Strength: Despite the overall bearishness in the crypto market, Floki has shown incredible strength, standing out from the crowd.
- Trade Breakdown:
- I went long on Friday , following the setup from our WiseOwl Indicator. The indicator locked in an 8.48% gain on the first position and immediately re-entered.
- For this trade, I used my own risk management strategy—I held the first position and reloaded on the second entry.
- Current Position: My position is now sitting at +16.73% , and I’m in a great spot. I’m expecting more bullishness in the short term , so staying patient and letting the market do its thing.
⚡️ Sticking to the plan and adapting risk management can really pay off—let’s see where this goes!

DOGS/USDT - Bullish Channel in H4 ChartThe DOGS/USDT pair on the H4 timeframe presents a potential Buying opportunity due to a recent formation of well-defined Bullish Channel pattern. This suggests a shift in momentum towards the Upside in the coming Days.
Key Points:
Buy Entry: Consider entering a Long position around the current price of 0.0007321, positioned close to bottom of channel level. This offers an entry point near the perceived shift in momentum.
Target Levels:
1st Support – 0.0008984
2nd Support – 0.0009749
Your likes and comments are incredibly motivating and will encourage me to share more analysis with you.
Best Regards, KABHI FOREX TRADING
Thank you.

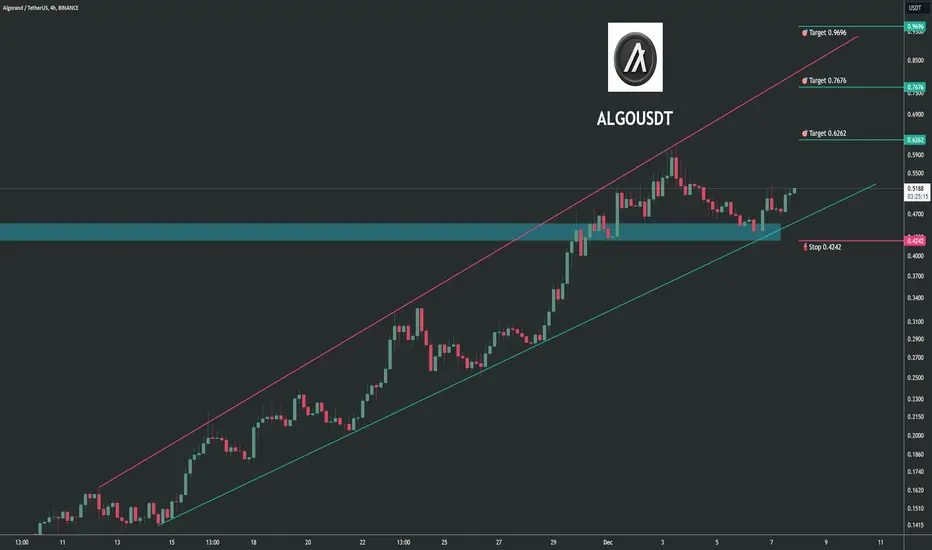
Trading opportunity for ALGOUSDTBased on technical factors there is a Buy position in :
📊 ALGOUSDT
🔵 Buy Now
🪫Stop loss 0.4242
🔋Target 1 0.6262
🔋Target 2 0.7676
🔋Target 3 0.9696
💸RISK : 1%
We hope it is profitable for you ❤️
Please support our activity with your likes👍 and comments📝
XRP Long to new all time highxrp/usd long trade
buy now
Tp 1 $2.68
Tp 2 $2.84
Tp 3 $3.10
TARGET 4 ATH

HBAR LONG SET UPHBAR LONG SET UP, RETEST OF RECENT HIGH
buy at $0.27
take profit 1 - $0.35
take profit 2 - $0.40

BTCUSDTBTC is still in an uptrend at the price zone of 103046-104814. If the price cannot break through the 104814 level, it is expected that in the short term, there is a chance that the price will go down. Consider selling the red zone.
🔥Trading futures, forex, CFDs and stocks carries a risk of loss.
Please consider carefully whether such trading is suitable for you.
>>GooD Luck 😊
❤️ Like and subscribe to never miss a new idea!

Bullish XRP - XRP/BTC Chart - 1 Month Time FrameThere are 2 chart patterns coinciding on the XRP/BTC chart for the monthly time frame.
Pattern #1:
Falling Wedge pattern with a target of 0.00010612
Target = 398% Increase
Pattern #2:
Double Bottom pattern with target of 0.00007199
Target = 269% Increase
Note: This is very reliable trade since it's the monthly TF, but it could also take very long to play out. Expect XRP to catch up to Bitcoin in the coming weeks or months!

CRONOS DAILY BREAKDOWN Wed.Dec.4.2024Like and Comments would be appreciated :D Not Financial Advice, Just my outlook/opinion

Celestia ($TIA) goes wild82% retrace. Accumulation. Breakout.
Send TIA back to its previous highs with haste.

From $2k Resistance to $10k Momentum: My ETH/USD Strategy RevealIn this video, I dive deep into ETH/USD price action and chart analysis as we revisit predictions from months ago. Watch how the market has followed my call nearly to the dollar, with a touch at the $2k zone and resistance near the previous ATH. With 170% returns still on the table, I'll share my thoughts on the bullish momentum and how it aligns with previous cycles. Could ETH/USD truly shoot toward $10k? Join me to uncover the strategies and insights behind this swing trading setup, and see how to capitalize on the current market momentum.
