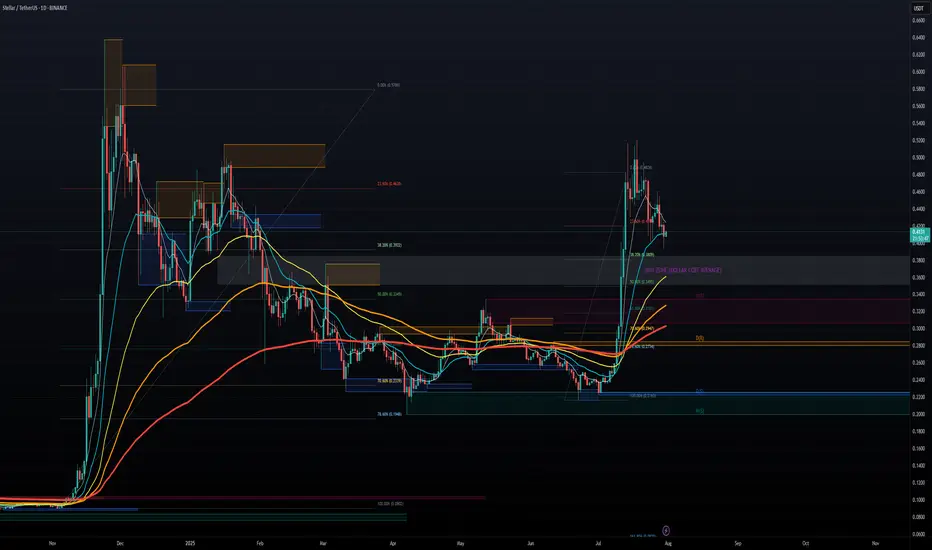
STELLAR LUMENS - DOLLAR COST AVERAGE FOR LONG TERM GAINSSTELLAR LUMENS (XLM) has taken off late 2024 from under .10 cents and now trading at .40 cents for a 400% Gain in 6 months so far, and there is much more upside to come potentially. It hit all time highs around .50 cents and now the token seems to want to test those highs in the near term 2025, we can easily see XLM approach $1.00 towards 2026 for a 100% gain and even higher longer term. Overall, XLM moves with XRP and we all know XRP is a blue chip project, it has all the funds and institutional backing, and so does XLM.
Both projects share a common creator in Jed McCaleb, however they have different focuses. Ripple, and its native token XRP, was initially designed to facilitate cross-border payments for financial institutions. Stellar, on the other hand, focuses on financial inclusion and aims to provide accessible financial services for individuals, including remittances and access to banking services.
CAN WE SAY BULLISH?! TO THE MOON!!!
Cryptos
Bitcoin Weekly Recap & Gameplan | 27.07.2025📈 Market Context:
Bitcoin maintained its bullish momentum, driven by continued institutional demand and a supportive U.S. policy backdrop.
Last week’s gameplan played out well — solid profits were captured (see linked chart below).
🧾 Weekly Recap:
• Price made a bullish retracement into the Weekly FVG (purple line) exactly as projected in last week's post.
• From here, I expect continuation toward new all-time highs.
📌 Technical Outlook:
→ First, I expect a short retracement and a 4H swing liquidity grab at 117,828$.
→ Then, a strong continuation move toward ATH targets.
🎯 Setup Trigger:
Watch for:
✅ 4H liquidity sweep
✅ 15M–30M bullish break of structure (BOS)
This is the confirmation zone for potential long setups.
📋 Trade Management:
• Stoploss: Below confirmation swing low
• Targets:
– 120,938$
– 123,400$
💬 Like, follow, and drop a comment if this outlook helped — and stay tuned for more setups each week!

Bitcoin Decision Time Closing - Pump to $150K, or $100K Retest?Here we see a clear trendline that bitcoin must hold. A breakdown could lead to a retest of the 100-110K levels. If we can hold this trendline until August 15th, the odds of a bullish continuation will increase.

BTCUSD 4HOUR TIME FRAME ANALYSISOverall Structure & Trend
Over the past several 4-hour candles, BTCUSD has carved out a series of higher lows around 116,500–117,000 and higher highs around 120,000–120,500, defining a gentle up-sloping channel.
The current price (118,758) sits just above the middle of that channel, suggesting there’s still room toward the upper trendline before meeting heavy supply.
Key Support & Entry Zone
Primary support lies at 117,200–117,500 (the former swing high from three bars ago), which also aligns with the 50% retracement of the move up from 114,500 to 120,500. That zone offers confluence for the 118,758 entry.
A secondary buffer sits at 116,849 (your stop-loss), just below the channel’s lower boundary—if price breaches here, the bullish structure would be invalidated.

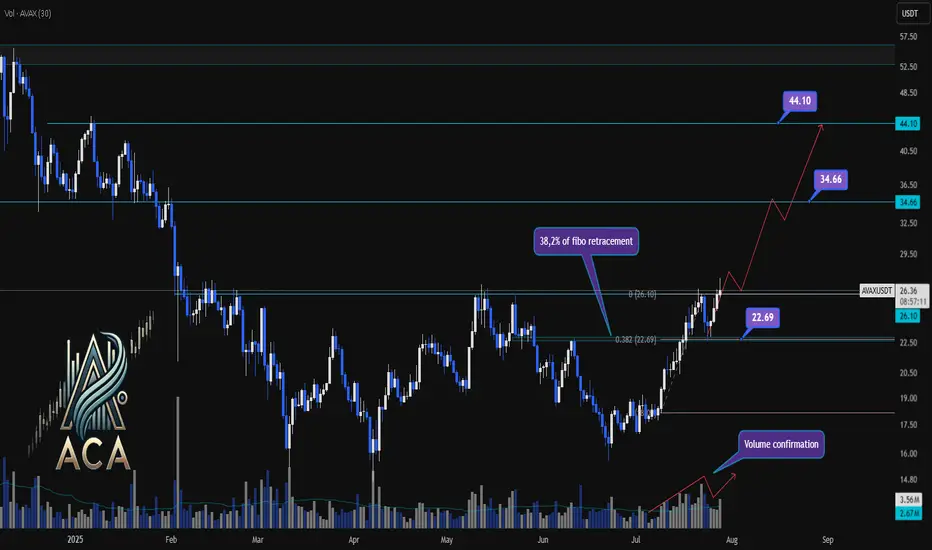
AVAXUSDT Trend Analysis | Will Volume Confirm the Next Big Move?AVAXUSDT Trend Analysis | Will Volume Confirm the Next Big Move?
🔍 Let’s break down the AVAX/USDT setup, examining its technical structure and mapping out key opportunities as it gears up for a decisive move.
⏳ Daily Overview
AVAXUSDT has been exhibiting a bullish structure, recently reacting to the 0.382 Fibonacci retracement level (around 22.69USDT) where price paused for a correction. This correction was technically healthy, as it occurred with declining volume, while upward impulses were marked by notable volume surges—signaling strong bullish participation and confirming accumulation phases.
🔺 Bullish Scenario:
The next area to watch is the resistance at 26.10USDT, which has acted as a major barrier in recent trading sessions. A decisive daily close above this level—preferably supported by a clear uptick in volume—would confirm breakout momentum and set the stage for further advances.
Upon confirmation, the chart points to medium- and long-term targets at 34.66USDT and eventually 44.10USDT. These levels are derived from key Fibonacci extensions and historic price reactions, offering logical take-profit zones for trend-following strategies.
📊 Key Highlights:
- 0.382 Fibonacci level (22.69USDT) acted as a reaction zone and healthy correction point.
- Volume profile validates trend: increased buying volume during upswings, decreased volume on dips.
- 26.10USDT is the next crucial resistance for confirmation.
- Breakout (with volume) opens path to 34.66USDT and 44.10USDT targets.
- Failure to clear 26.10USDT could result in consolidation or another retest lower.
🚨 Conclusion:
All eyes are on the 26.10USDT resistance. Wait for a clear daily close and volume confirmation before considering entries. A breakout above this level could propel AVAXUSDT towards higher Fibonacci targets, while a rejection may prompt another retest of prior supports or consolidation.
Stay sharp and plan your trades with discipline!
XAUUSD 4HOUR TIME FRAME ANALYSISOn the 4-hour chart, XAUUSD has recently pulled back into a well‐defined demand zone just above 3 330, offering a low-risk entry around 3 338. Here’s how the setup looks:
Trend Context
• Over the past week, gold has carved out a gentle up-slope, tracing higher highs and higher lows from 3 300 up toward 3 395.
• Price dipped back to test the rising 50-period moving average.
Key Levels
• Entry (3 338): Aligns with the confluence of the 50-period MA and a horizontal support zone (3 330–3 340), where buyers staged a rally earlier in the week.
• Stop-Loss (3 307): Placed just beneath the swing low at 3 315 and below the trendline connecting the last two higher lows—giving room for noise while protecting against a deeper reversal.
Momentum & Oscillators
• RSI (14): Currently around 45, rising from the 40 region. This suggests bearish exhaustion is waning and room remains before overbought conditions.

TON/USDT - Bullish Channel in H4 (27.07.2025)The TON/USDT pair on the H4 timeframe presents a Potential Buying Opportunity due to a recent Formation of a Bullish Channel Pattern. This suggests a shift in momentum towards the upside and a higher likelihood of further advances in the coming Days.
Possible Long Trade:
Entry: Consider Entering A Long Position around Trendline Of The Pattern.
Target Levels:
1st Resistance – 3.770
2nd Resistance – 3.989
🎁 Please hit the like button and
🎁 Leave a comment to support for My Post !
Your likes and comments are incredibly motivating and will encourage me to share more analysis with you.
Best Regards, KABHI_TA_TRADING
Thank you.

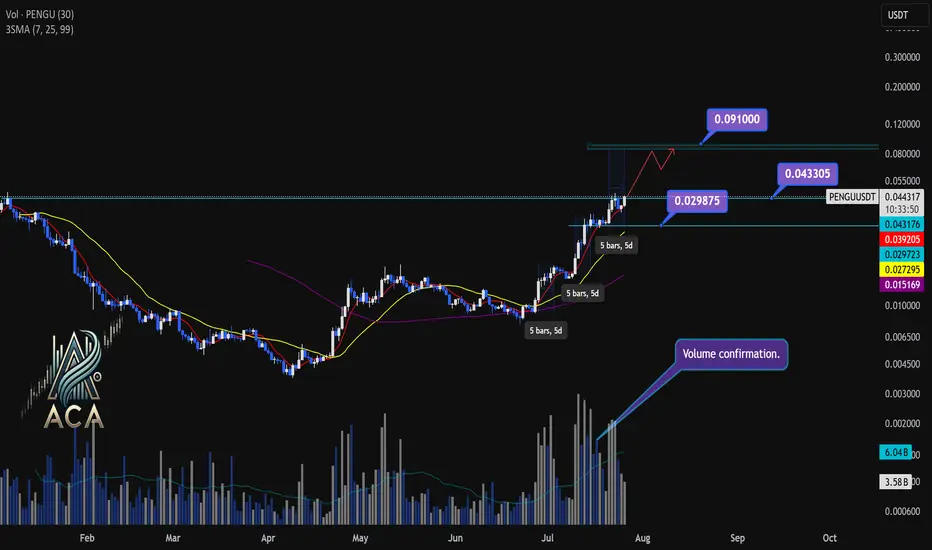
PENGUUSDT Daily Chart Analysis | Powerful Uptrend in PlayPENGUUSDT Daily Chart Analysis | Powerful Uptrend in Play
🔍 Let’s dissect the current PENGU/USDT daily chart, highlighting the unmistakable bullish structure and mapping potential targets as this trend matures.
⏳ Daily Overview
PENGUUSDT is riding a strong upward trend, with all three daily SMAs (7, 25, and 99) lined up in bullish sequence—clear confirmation of momentum. Recent rallies are also supported by textbook volume behavior: volume consistently surges during price climbs and tapers off during minor corrections, reflecting the classic signature of a robust uptrend.
🔺 Bullish Setup and Price Targets:
The next major upside target sits at $0.0910, almost 85% above the current level. For bulls, a daily candle closing above $0.043305 with convincing volume should act as a confirmation for fresh highs—though, as it’s Saturday, even moderate volume could suffice for a valid breakout.
📊 Key Highlights:
- All SMAs (7, 25, 99) confirming the uptrend on daily timeframe.
- Volume spikes on upward moves, fades on corrections—classic bullish confirmation.
- Historical trend velocity: Each time a new high (HH) is set, it’s preceded by around 5 days of advance; first leg was +83%, second +124%, the next (projected) is +160%, aligning with the $0.0910 target.
- Corrections: After each rally, pullbacks have measured about 15% and 20%. Should the first target be reached, expect a correction up to 25%—a healthy reset for further continuation.
🚨 Conclusion:
With all signals aligned—moving averages, volume dynamics, and historic price structure—the path remains bullish. A decisive close above $0.043305, especially with solid volume, could be the catalyst for the next major leg higher. As always, monitor for typical correction ranges post-breakout in line with the prior trend.
BTCUSD Key Supply Zone Rejection – Bearish Target Mapped BTCUSD Key Supply Zone Rejection – Bearish Target Mapped (Educational Breakdown)
⸻
🧠 Technical Analysis (1H Chart):
• Range Structure: BTCUSD is currently trading within a well-defined consolidation range between the Resistance Zone ($119,850–$120,591) and the Support Zone ($116,937).
• Volume Profile (VRVP): Volume is noticeably thick near the mid-range, suggesting accumulation/distribution behavior. Price is struggling to break above the value area high near $120K.
• Resistance Rejection: After testing the upper supply zone, price failed to sustain bullish momentum and is showing signs of exhaustion – a possible sign of institutional selling.
• Target Zone: If price rejects this resistance again, a strong move toward the target level of $117,260 is expected. This aligns with:
• Mid-range liquidity sweep
• Low-volume node (LVN) below current price
• Fair Value Gap fill near $117,200–$116,900
⸻
🧩 Key Concepts Highlighted:
• Support & Resistance Mapping
• Volume Profile Readings
• Institutional Order Flow Bias
• Target Projection using Smart Money Concepts
⸻
⚠ Educational Insight:
This setup is a perfect example of how to combine Volume Profile + Price Action to identify liquidity traps and smart entries. Always wait for confirmation near key zones — not every level breaks!
⸻
✅ Trade Plan (Not Financial Advice):
• Watch for bearish engulfing/rejection wick at resistance
• Short entry below $119,000 with SL above $120,600
• Target: $117,260 / Final TP: $116,937 zone

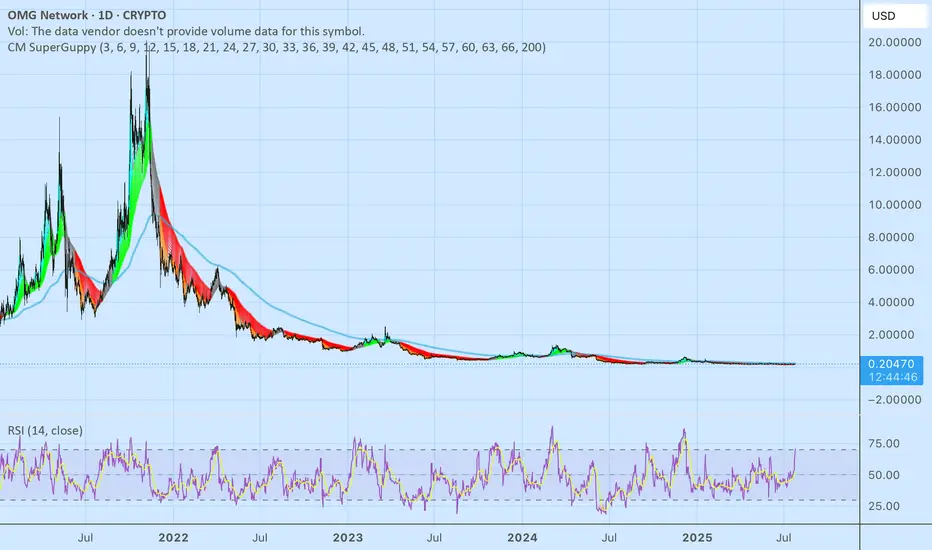
NC HAMMER CRYPTO find meLooking at omg we see that it is practically dead, however we have seen this before it does a major pump when it gets over the 200EMA like we have seen with XCN… a little goes a long way with this one. ATH roughly $20 currently at $0.20, you do the math on risk vs reward.
BTC correction august/septemberBTC has reached overbought territory, there is also bearisch divergence. It also didnt go above 123k anymore. i expect a correction in august/september.
dont chase FOMO, be prepared. Nothing goes in a straight line. there are always corrections.
CRYPTO:BTCUSD BINANCE:BTCUSD CME:BTC1! BINANCE:BTCUSDU2025

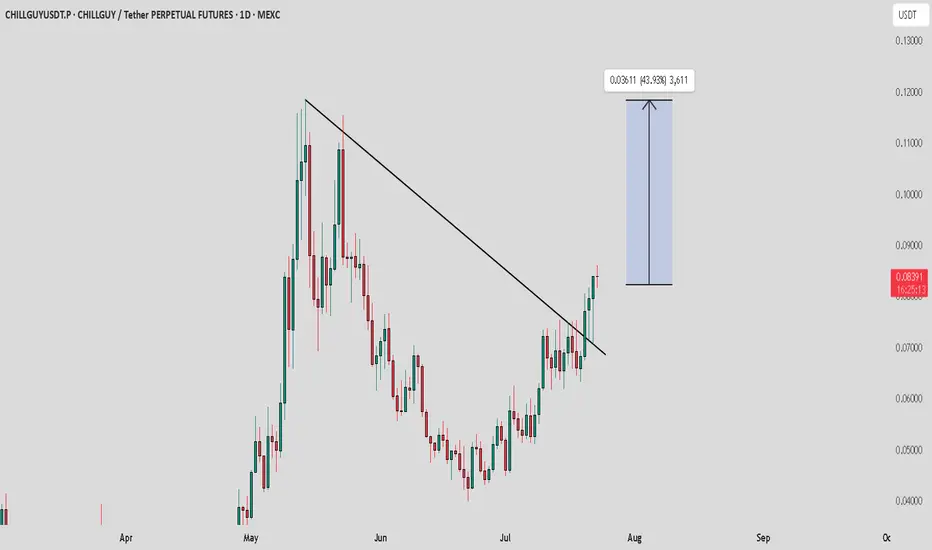
CHILLGUY / USDT : Trend shift and Retest confirmedChillGuy/USDT - Trend Shift & Retest
ChillGuy/USDT has fully shifted its trend, and after a successful retest, we expect a strong pump towards $0.10 - $0.12 soon.
Bullish Scenario:
Successful retest confirms the trend shift, leading to a potential move towards $0.10 - $0.12.
Pro Tip:
Keep a close watch for any signs of weakness or reversal before entering.
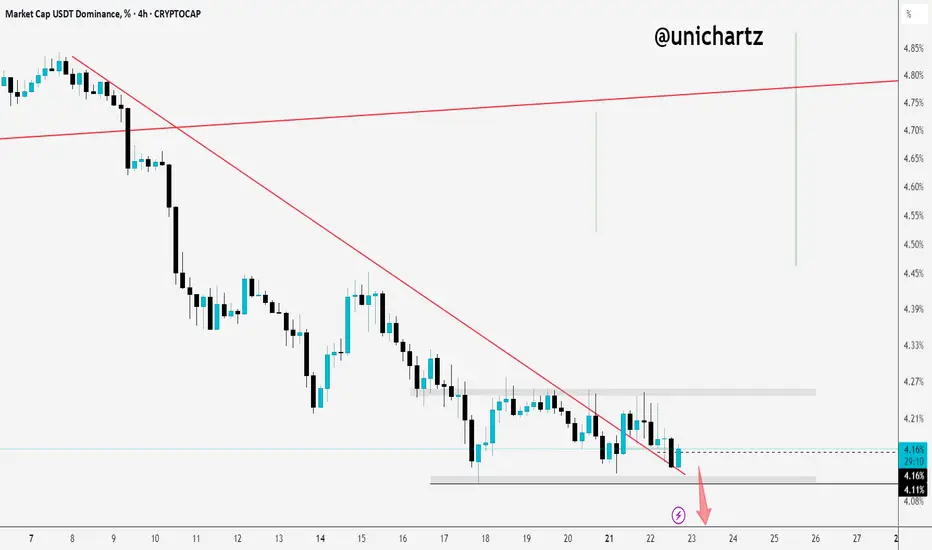
Tether Dominance Testing Support Zone – Big Move Coming?USDT.D is moving sideways right now.
If it breaks down below this range, it could fuel another leg up for altcoins.
Keep a close eye, the next move could shift the market.
Investing in Cryptocurrencies in the current environmentDear Investors,
The cryptocurrency market has experienced significant activity over the past week, with major cryptocurrencies such as Bitcoin and Ethereum reaching all-time highs. However, many alternative coins (altcoins) have yet to follow suit, presenting potential opportunities for strategic investors. This divergence is partly attributed to recent developments in U.S. regulatory efforts, particularly discussions around stablecoin legislation. The signed regulatory framework (Genius act) for stablecoins is viewed as a positive step for the broader crypto industry, as it could foster greater institutional adoption and market stability. Notably, President Trump’s administration has signaled a crypto-friendly stance, which has bolstered market sentiment and contributed to the bullish momentum.
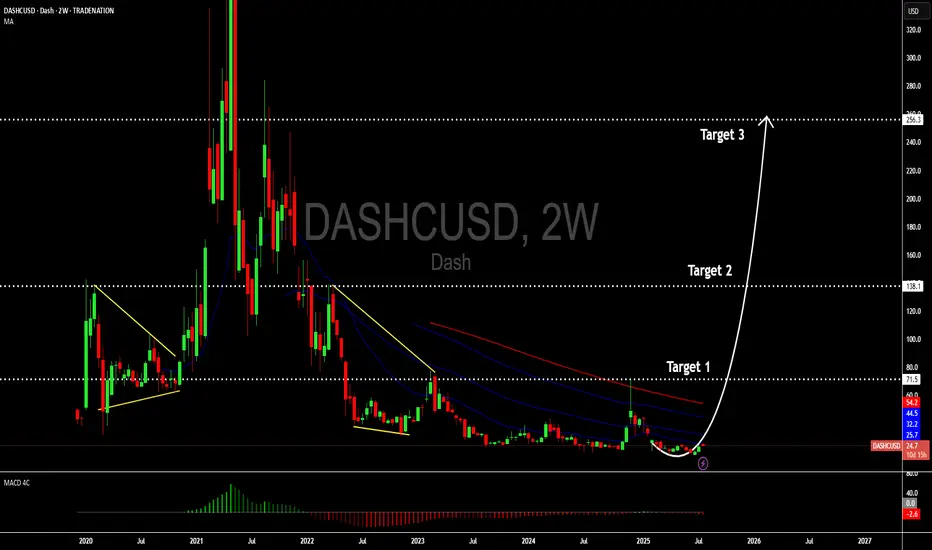
While the surge in top-tier cryptocurrencies is exciting, we caution investors against succumbing to FOMO (Fear of Missing Out) by chasing assets that have already seen significant price increases. Instead, consider reallocating capital toward undervalued altcoins with strong fundamentals, such as Dashcoin, which may offer attractive risk-reward profiles in the current market cycle.
Disclosure: I am part of Trade Nation's Influencer program and receive a monthly fee for using their TradingView charts in my analysis.
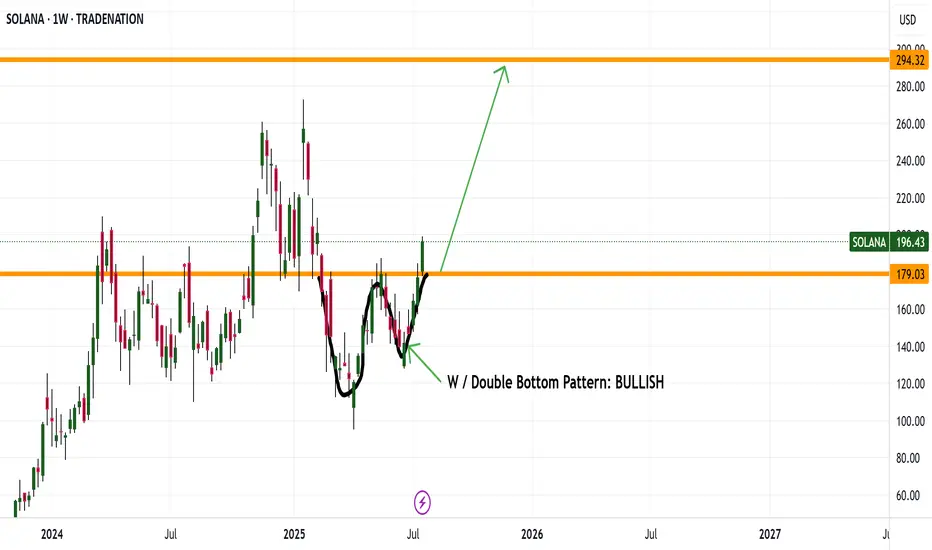
SOLANA DRIVING UP TO 294 Good evening everyone
It looks like SOL made a nice W pattern and now breaking its weekly high is driving up to 294
Enjoy happy trading this bull run
Kris/ Mindbloome Exchange
Trader Smarter Live Better
Major Coins and Crypto Stocks Pump — Thank Landmark GENIUS BillBitcoin BITSTAMP:BTCUSD making ATHs? Old news. But Coinbase NASDAQ:COIN and Robinhood NASDAQ:HOOD hitting those record-high notes? And XRP BITSTAMP:XRPUSD dangerously close to eclipsing its own peak, while Ethereum keeps chugging along toward $4,000? Now we’re talking.
In a market-friendly twist, President Trump signed the GENIUS Act into law on Friday — a sweeping legislative win for crypto. Short for Guiding and Establishing National Innovation for US Stablecoins, the GENIUS Act marks the first major federal framework for digital assets and, more importantly for traders, triggered a firestorm of price action across the space.
Flanked by crypto executives, Republican lawmakers, and a few NFT bros in suits, Trump called the stablecoin-focused bill “perhaps the greatest revolution in financial technology since the birth of the internet.” Bold claim. But judging by what the market’s doing — he might actually be onto something.
The bill, passed 308 to 122 in the House, lays the groundwork for US banks to issue their own stablecoins and create a regulatory moat that finally separates innovation from legal whack-a-mole.
But wait, that’s not all. The House also passed the CLARITY Act and the Anti-CBDC Surveillance State Act. The first one will help determine if cryptos will be considered securities and the second one bans the Federal Reserve from issuing its own coin.
🚀 Crypto Market Cap Hits $4 Trillion
As the bill cleared Congress and Trump picked up the pen, the entire crypto market cap exploded past $4 trillion for the first time in history with the orange coin holding more than 60% of the market .
It wasn’t just Bitcoin BITSTAMP:BTCUSD making noise (although it did quietly retest $120,000 boasting a $2.4 trillion valuation, or more than that of Google parent Alphabet NASDAQ:GOOGL ).
The real momentum was coming from the stocks and altcoins — especially those with exposure to the suddenly green-lit US regulatory scene.
📈 Coinbase: To the Moon and Beyond
Let’s talk about Coinbase, ticker symbol NASDAQ:COIN , and now also, apparently, ticker symbol 🚀.
Shares surged over 8% on Friday to hit a new record session high of $445, giving the US-based exchange a market cap of over $100 billion. Not bad for a company that spent most of 2022 playing dodgeball with the SEC.
The GENIUS Act (and its siblings) cleared a path for institutional crypto adoption — and no one stands to gain more than Coinbase. It’s the go-to exchange for institutional custody and compliance. And now, with banks dipping their toes into stablecoin waters, guess who gets to facilitate those flows? Exactly.
Coinbase has now rallied over 63% year-to-date, putting it back into market darling territory — and giving early bulls a solid reason to post their PnLs again.
📊 Robinhood: Meme Stock No More?
Wait, what’s that clamor? It’s the “HOOD to $100” crowd dusting off their 2021 hats.
Robinhood NASDAQ:HOOD also saw a serious lift from the legislative push — hitting an all-time session high of $113 on Friday. The shares are up 180% in 2025 alone.
While most remember Robinhood for its meme stock legacy, the app has quietly built a towering crypto trading platform in the US. And now, with Congress cracking open the stablecoin lane and clearing legal fog, it’s suddenly a real contender in the digital asset arms race.
Add to that Trump’s pledge to dismantle crypto-hostile policies from the previous administration (many of which affected Robinhood’s crypto operations), and it’s no wonder the stock is flying.
💰 Stablecoins: Boring Coins Are Now Big Biz
You’d be forgiven for snoozing through most stablecoin headlines. After all, they don’t moonshot or do anything but sit idle.
But make no mistake — this is where the real money’s watching. JPMorgan CEO Jamie Dimon, not known for casual crypto endorsements, said last week his bank will now be “involved in both JPMorgan deposit coin and stablecoins.”
That’s a seismic shift. For years, traditional banks sat on the sidelines while Circle CRYPTOCAP:USDC and Tether CRYPTOCAP:USDT built billion-dollar stablecoin empires. Now, thanks to the GENIUS Act, the door is open for regulated banks to issue digital dollars backed by FDIC-level trust — and potentially eat into the DeFi-native players’ lunch.
Boring’s about to get very profitable.
💥 XRP: Return of the Ripple?
You know it’s a bull market when XRP BITSTAMP:XRPUSD shows up uninvited and still gets the VIP booth.
The one-time courtroom drama token surged over 60% in the past two weeks, hitting $3.50 and inching dangerously close to its all-time high. Ripple’s comeback arc may finally be getting its payoff.
With legal pressure fading and Congress setting new guardrails for digital assets, XRP’s regulatory risks just got a lot less scary. Plus, institutions looking for faster cross-border rails may find XRP’s network a bit more attractive when Washington’s no longer breathing down its neck.
🐂 Ethereum: Quietly Eyeing $4,000
Ethereum BITSTAMP:ETHUSD might not be making headlines like Bitcoin or XRP, but don't let the quiet confidence fool you.
ETH has been rising steadily, gaining almost 50% in the last two weeks, and Monday morning was trading just shy of $3,800. With regulatory uncertainty waning, and the market treating Ether more like an investment than a utility token, it’s slowly reclaiming its 2025 highs.
Factor in the growing number of ETH-based ETFs , tokenized real-world assets (hello, Treasury bills onchain), and the boom in stablecoins running on Ethereum rails… and you’ve got a slow-burn bull case building brick by brick.
🦅 Washington, WAGMI?
So, what’s the takeaway?
For the first time, Congress passed crypto legislation that didn’t come with a hidden poison pill. The GENIUS Act, along with the CLARITY Act, have made more legislative progress in a week than years of courtroom wrangling and ETF lobbying combined.
Trump, with his pro-crypto stance and deep industry ties (after all, he did launch his own coin not too long ago), just turned crypto into a political weapon — and a market darling. Is 2025 shaping up to be the year Washington went full Web3?
Let’s hear it from you : Drop your thoughts in the comments and let’s spin up the discussion.

The Crypto Era- Just updated an old chart!
- If you want to know where we stand, it's clearly outlined on the chart.
Some older Analyses :
- HODL strong!
Happy Tr4Ding !

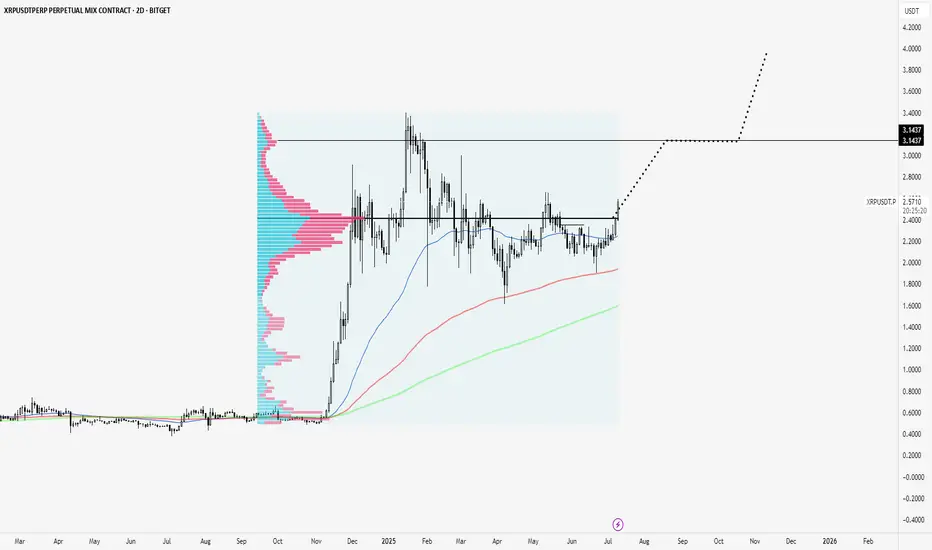
XRP clears Point of Control to test highs.XRP is breaking out of a consolidation zone and above a volume point of control that has been massive since its November rally onward.
Looks like next node is to $3.14
Super strong coin.
Ripple testimony in banking committee yesterday was bullish. Ripple partnering with BNY Melon yesterday was bullish. Ripple leading regulation standards with their XRP case is bullish. Ripple winning the status of XRP as one of a kind is bullish. Ripple getting a bank charter and fed master account is bullish.
Not much is close to XRP fundamentally.
Major Move Ahead for ADA – Breakout or Breakdown?
🔍 ADA/USDT Analysis – Dual Scenario Setup (BUY & SELL)
Currently, ADA is ranging between major supply and demand zones. Two clear scenarios are in play depending on how price reacts to key levels:
📈 Bullish Scenario (Long):
Entry: On breakout and confirmation above $0.6027
Target: $0.869 (major resistance zone)
Stop Loss: Below $0.523
Trigger: Break of descending trendline and solid structure above $0.6027
📉 Bearish Scenario (Short):
Entry: Around $0.5120 (rejection from supply zone)
Target: $0.315 (strong demand zone)
Stop Loss: Above $0.6027
Trigger: Failed breakout and rejection from $0.5120 level, with confirmation below it
📌 Based on the descending channel structure, this might have been the final leg of the downtrend, and a reversal to the upside could be underway. However, for confirmation, we prefer to wait for stronger price action signals before fully committing.
🛑 Always use risk management. Market remains bearish until proven otherwise.

Wings of Opportunity: LINK’s Harmonic Setup Unfolding🦋 Title: A Butterfly on the Edge – But Only with Confirmation
On the 2H timeframe, a Bullish Butterfly Harmonic Pattern is unfolding. The wave structure (X → A → B → C → D) aligns closely with harmonic principles, and point D lies above X, within the 1.27 to 1.618 Fibonacci extension of XA — reinforcing the pattern’s validity.
📌 No entry has been triggered yet.
We are currently waiting for price to break and hold above the key resistance at 13.60 to confirm the bullish scenario.
🔹 Bullish Scenario (our primary and preferred outlook):
Given the strong reaction around the 12.74 demand zone and the harmonic structure completion, we are primarily focused on a long opportunity, if and only if confirmation is achieved above 13.60.
📥 Entry Zone: 13.05 – 13.65
🎯 Target 1: 17.94
🎯 Target 2: 18.76
🛑 Stop-Loss: Below 12.74 (structural invalidation)
🔻 Alternative Bearish Scenario:
If price fails to break 13.60 and instead loses the 12.74 support, the bullish setup becomes invalid, and the market could enter a deeper correction phase.
Potential downside targets in that case:
📉 11.80
📉 10.90 – 10.30 (if bearish momentum continues)
📊 Risk Management Notes:
Position sizing should not exceed 1% of total capital
Avoid early entries before confirmation
Prefer partial entries after breakout and retest
Stick to the invalidation level strictly
📈 While both scenarios are on the table, we are currently favoring the bullish setup, as long as price action supports it. Discipline and patience are key — confirmation first, trade second.

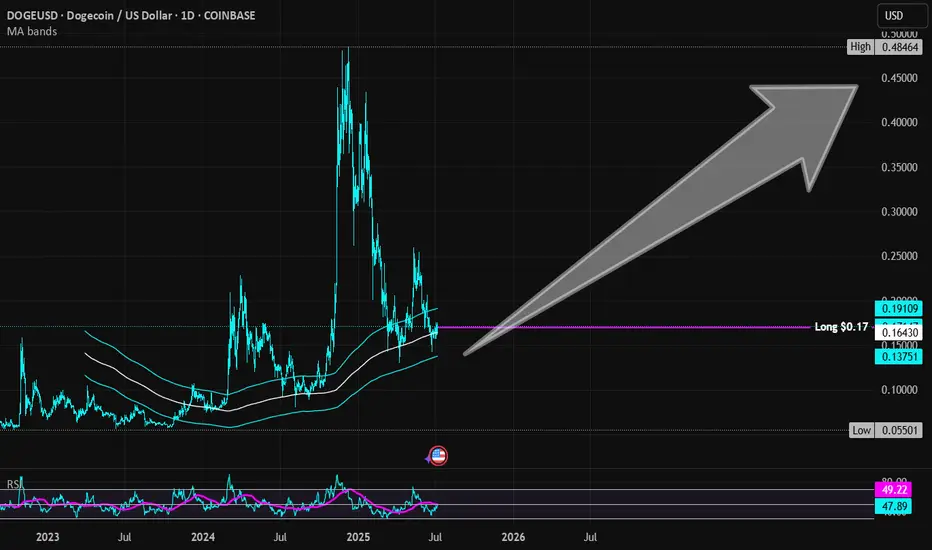
Dogecoin | DOGE | Long at $0.17Currently within my historical simple moving average area and consolidating. I suspect a move up is imminent, but 100% speculation. Crypto "bros" know more than I do.
Targets into 2028:
$0.25 (+47.1%)
$0.45 (+164.7%)
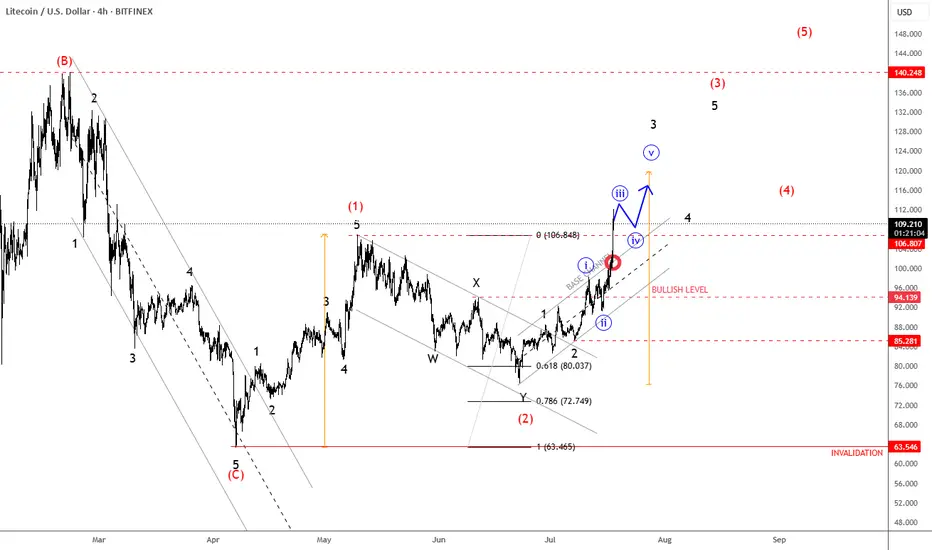
Litecoin Continues Its Bullish Cycle As ExpectedLitecoin Continues Its Bullish Cycle As Expected, which can send the price even higher from technical point of view and by Elliott wave theory.
We talked about Litecoin back on May 30, when we spotted a bullish setup formation with waves (1) and (2) that can extend the rally within wave (3) of a five-wave bullish impulse.
As you can see today on July 18, Litecoin with ticker LTCUSD is now breaking strongly back above May highs after we noticed a complex W-X-Y correction in wave (2). Now that ALTcoin dominance is stepping strongly in, we may easily see more gains within a projected five-wave bullish cycle during the ALTseason, just be aware of short-term pullbacks.
is AltSeason Started ????"The altcoin season has likely begun! We're currently witnessing Bitcoin's dominance chart breaking down at a critical juncture, and this cycle may surpass even our most optimistic expectations. The technical signals are remarkably clear and verifiable for most seasoned traders. In these market conditions, the wisest strategy is to hold strong with conviction – maintain your positions and trust in the assets you've carefully accumulated. This could very well be the start of an extended altcoin rally that rewards patience and strategic positioning. #AltSeason #CryptoMarket #BTCDominance #HODLStrategy"
