Ethereum Update on 05/08/2023There will be a buy/long opportunity for ETH. Focus on buy zone and 200 DMA.
Disclaimer: The information and analysis provided in this publication are for educational purposes only and should not be construed as financial advice or recommendations to buy, sell, or hold any securities. The author and TradingView are not responsible for any investment decisions made based on the content presented herein. Always consult a financial professional before making any investment decisions.
Cryptos

Trading Lesson 👨🏫#2 - Understanding Consolidations in CryptoIn today's lesson I will explain the difference in consolidations.
Some of you are new to the market and are probably wondering what's happening exactly when it's not moving in price and when it's moving down more than up but would later return to the last price it was.
Well to best answer that question.
It's called consolidation:
It's a thing that happens in the crypto market where waves of prices fluctuate up and down calculating the sells and buys of the market until it meets a point of exit - after consolidating the actual price of the market you're in, and only has two places it can go.
There are two types of consolidation.
The first is where it does a price correction where you have rapid 📉drops or rapid 📈rises.
An lastly is a repeated wave🏄🏼♀️ that can run in the same location for a few hours, sometimes days, give or take how many orders were made within the past few minutes - hours - days - weeks or months.
Consider it like a balloon🎈 being blown into until it 💥pops!💥
Now this is where the problem begins - we don't know where it may go once it's done, could go up or down and when that balloon has popped it's rapidly going there. We could see the 0.00002000 - range within a few hours or just see 0.00000900 range within a few minutes, depending on the orders made for shib and the rest of the market as a whole, this can last for days, weeks depending on the amount of buys or sells.
Also note these are when you get the same surprise jumps like we did in 2021. It started off from the 850's and jumped to the 0.00001300 within a day.
However; right behind it, is a price correction waiting for a peak in the returns to meet its end. Once that happens it'll just fall or rise back to where the price actually suppose to be and starting the process all over again.
You may not know it but there are all forms of consolidations on ever chart from 1 minute to 4 hours to 1 day to 12 months.
You're in a consolidation right now and you don't even know it. Like the ones that occur on a weekly chart, This is what I call "a Seasonal Trend" the day, week, or month, is in a seasonal consolidation and is trending high or low.
But note anything can stop a seasonal trend and disrupt the flow of it, but it will continue the process as long as the damage done was not to bad such as major crashes in a seasonal up trend due to outside interferences such as massive sell-offs, regardless it'll still attempt to rise back because it's in a wave that's trending up-word, if the wave was trending down then it would do way more damage than expected.
But the worst thing to do in a consolidation day - is to sell while it's consolidating, the price may not go no higher or no lower, and if you sell while at a low price in a consolidation you will likely lost position and will have to wait for it to finish to get more shares let alone the original shares, that's if it drops, so best to hold while in a consolidation day, at least until closing.
So I hope this answers anyone question as to why your crypto stock of choice is not moving anywhere, it may not move for hours or even days. you'll just have to wait for closing hour to see if it will pop - hopefully on a positive outcome.
So Happy Trading Everyone

Total Crypto Cap Idea For The Rest of the MonthUsing CRYPTOCAP:TOTAL as a guide for the rest of the market, this is what I'm keeping in mind over the next 2 weeks.
On the weekly timeframe we are currently Under the 200 MA which is right around 1.08T
It's highly Likely we close under that on Sunday.
Next week we will look to find support in the range of 1.024T and ~1T.
To the upside I have set an alert at 1.038T
I don't expect too much price action over the weekend.
But in the coming days watch for the death cross(21 and 200) and potential bearish retest on the Daily timeframe.
Waiting game now.
Keeping in mind Super Moon (Bullish) at the end of this month may signal some bullish price action. If that is the case price should bottom over over the next week or so.

BTC downtrend?Bitcoin has unfortunately broken the diagonal support, and it is highly likely that it will go down from here to the 61% Fibonacci level in the coming months. It is possible that we may see the price again between 18k - 20k

Where is Bitcoin going?BINANCE:BTCUSDT Bitcoin after the formation of wave C, which passed 138% of wave A, we have to wait for an upward movement, and I have the range of 32000 to 33000 to start in my mind! After that, we will again experience a short downward correction and return to 29900, and after that, I am considering a small upward movement to the final range of 36000, and finally we will go for a semi-heavy fall to... (this is just one It is one of the scenarios in my mind and will be updated if needed)

Bitcoin (Gann Fan Update)Its a very important time for Bitcoin in my opinion , within the next 8-10days we will get a large move above or below the 1/1 Gann , for weeks now we have been holding just under it.
Here is a zoomed in view on the daily.
As you can see we reach this apex 24th of August 2023 , of course its also possible we trickle sideways above the 1/1 but historically breaking the 1/1 on Bitcoin during this part of the cycle we get some type of action.
2015
If we go back and take a look on how price reacted to the 1/1 we can see a lot of violent swings ranging from 25-40%.
2019
This year was had way more reactions to the 1/1 and almost everytime it resulted in fairly large swings , this time ranging 45-60%.
2023
So for this year we have touched 1/1 once and it was the local high of the year , candle closed right on it.
2/1 Gann and Time
The bull market doesn't start until we break and hold support the 2/1 , the last two cycles it has taken about the same time 640days .
So if it repeats Bitcoin would be somewhere around 36500 during this period.
We also know it takes about 750 days from cycle low to reach previous cycle high.
So that would be Bitcoin back at 69k sometime in December 2024.
Conclusion
If the cycle repeats the Bull market will start sometime August 2024 at 36500 and Bitcoin will reach previous cycle high at 69k December 2024 which would then make a new cycle high October 2025.

BTCUSDTBTCUSDT, the price is near the 28290 support zone, if this support is still active. It is expected that in the short term there is a chance that the price will rebound.>> GooD Luck 😊

$ONE Performing Falling wedge in 1D Keep eye on Breakout Falling Wedge
The falling wedge can either be a reversal or continuation signal.
As a reversal signal, it is formed at a bottom of a downtrend, indicating that an uptrend would come next.
As a continuation signal, it is formed during an uptrend, implying that the upward price action would resume. Unlike the rising wedge, the falling wedge is a bullish chart pattern.
In this example, the falling wedge serves as a reversal signal. After a downtrend, the price made lower highs and lower lows.
Notice how the falling trend line connecting the highs is steeper than the trend line connecting the lows.
If we placed an entry order above that falling trend line connecting the pair’s highs, we would’ve been able to jump in on the strong uptrend and caught some pips!
A good upside target would be the height of the wedge formation.
If you want to go for more pips, you can lock in some profits at the target by closing down a portion of your position, then letting the rest of your position ride.

BTCUSD - Still on vacation - Weekly chartSince June, Bitcoin has not been pampering us with its volatility. The bulls slowed down at the first resistance of a very strong supply zone of $31,580 - $35,900 .
It consists of 50% Fibonacci from the downtrend in March 2022 supported by the Price Action zone from May-June 2021. The upper band of this zone is 38.2 Fibonacci measured from the ATH in November 2021 supported by the Price Action from January-February 2022.
The bulls will need a strong impulse to overcome this zone - it will also be a marker for me for the near future how to play the market on lower time frames.
More about this in my next analyses, where I will take a closer look at this situation.

CKB fully control in Buyer
#ckb genuine Chinese goods in the first phase of the year pumped to x4 after 3 months of crawling. Then there was 1 continuous break
It must have entered a rally now, consider this coin it doesn't pump strongly CRYPTOCAP:CKB likes the gentleness of the bulls 😊
Descending Channel Formation in Weekly Timeframe...
In Case of Upside Breakout Expecting Massive Bullish Wave📈

POSSIBLE SHORT ON EURUSDWeekly and monthly price action for EURUSD appears to point towards a bearish sentiment and thus we expect shorts this week as we run into weekly lows, keep our fingers crossed and wait for the markets to come to us. Structural candles and confirmation on 15m bos entry.

SHUSI USDT HELLO GUYS THIS MY IDEA 💡ABOUT SHUSIUSDT is nice to see strong volume area....
Where is lot of contract accumulated..
I thing that the buyers from this area will be defend this LONG position..
and when the price breakout this resistance , strong buyers will be push up the market again..
IF you like my work please like and follow thanks

$OGN Performing Falling wedge in 4h Breakout doneNYSE:OGN Performing Falling wedge in 4h Breakout done
Falling Wedge
The falling wedge can either be a reversal or continuation signal.
As a reversal signal, it is formed at a bottom of a downtrend, indicating that an uptrend would come next.
As a continuation signal, it is formed during an uptrend, implying that the upward price action would resume. Unlike the rising wedge, the falling wedge is a bullish chart pattern.
In this example, the falling wedge serves as a reversal signal. After a downtrend, the price made lower highs and lower lows.
Notice how the falling trend line connecting the highs is steeper than the trend line connecting the lows.
If we placed an entry order above that falling trend line connecting the pair’s highs, we would’ve been able to jump in on the strong uptrend and caught some pips!
A good upside target would be the height of the wedge formation.
If you want to go for more pips, you can lock in some profits at the target by closing down a portion of your position, then letting the rest of your position ride.

$FLOKI performing Descending $FLOKI performing Descending Triangle in 1d Yes I am interested to buy here
What Is a Descending Triangle Chart Pattern?
A descending triangle is a powerful technical analysis pattern with a predictive accuracy of 87%. The pattern is flexible and can break out up or down, and is a continuation or a reversal pattern.
A descending triangle has one declining trendline that connects a series of lower highs and a second horizontal trendline that connects a series of lows. A descending triangle can be bearish or bullish or a reversal or continuation pattern, depending on the direction of the price breakout.
A descending triangle occurring during a price uptrend, with a price breakout above the resistance line, is considered a bullish continuation pattern. (See chart below)
Conversely, a descending triangle occurring during a price downtrend, with the price breaking out above the resistance line, is considered a reversal pattern.
KEY POINTS
The descending triangle has a horizontal support line and a declining slope resistance line.
If the price breaks out of the triangle in the direction of the previous trend, it is a continuation pattern.
If the price breaks out of the triangle in the opposite direction of the previous trend, it is a reversal pattern.

$DODO performing Descending TriangleWhat Is a Descending Triangle Chart Pattern?
A descending triangle is a powerful technical analysis pattern with a predictive accuracy of 87%. The pattern is flexible and can break out up or down, and is a continuation or a reversal pattern.
A descending triangle has one declining trendline that connects a series of lower highs and a second horizontal trendline that connects a series of lows. A descending triangle can be bearish or bullish or a reversal or continuation pattern, depending on the direction of the price breakout.
A descending triangle occurring during a price uptrend, with a price breakout above the resistance line, is considered a bullish continuation pattern. (See chart below)
Conversely, a descending triangle occurring during a price downtrend, with the price breaking out above the resistance line, is considered a reversal pattern.
KEY POINTS
The descending triangle has a horizontal support line and a declining slope resistance line.
If the price breaks out of the triangle in the direction of the previous trend, it is a continuation pattern.
If the price breaks out of the triangle in the opposite direction of the previous trend, it is a reversal pattern.

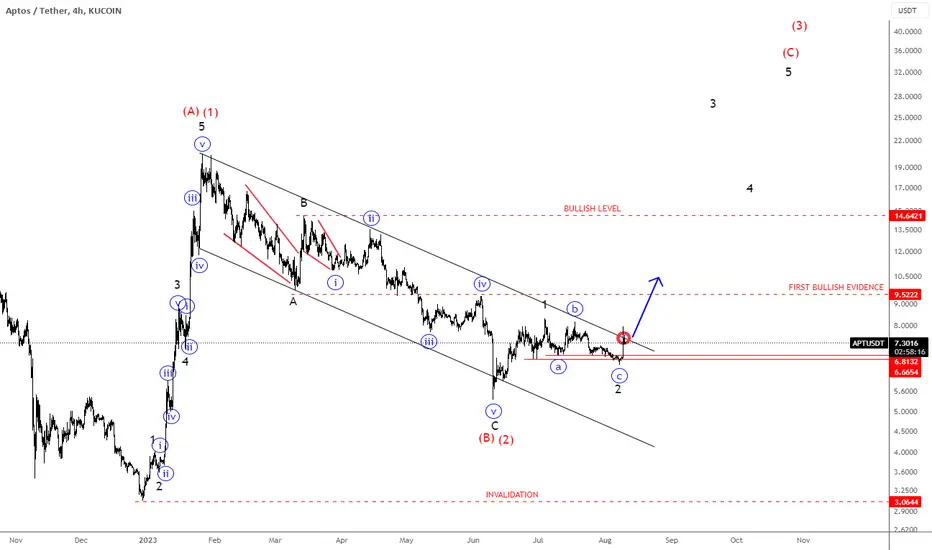
APTOS Bulls Ready?!Aptos Token Surges on Microsoft Partnership Ahead of APT Supply Unlock
Aptos with ticker APTUSD is waking up after a completed higher degree A-B-C correction in (B)/(2). Currently we can see it forming a lower degree bullish setup formation with impulsive wave 1, followed by a-b-c pullback in wave 2 that can push the price into the steepest wave 3 of a five-wave bullish cycle within higher degree wave (C)/(3). Just keep in mind that we still need broken channel resistance line decisively and 9.5 first bullish evidence level to confirm wave 3 of a five-wave bullish impulse.
Bullish confirmation is above 14 level, while invalidation level remains at 3.
BTC PUSHNice push to the top side out of a pinch. FaKe out? I may have pulled the trigger a little eary but im looking at the 32.5k Level for a tafget< Bitcoin has be struggling at this 30 k level so I wanna be cautious of a sell off. Lets see where it takes us.

What a Wonderful Time - to be a - Shib🐶fan🚀 BINANCE:SHIBUSDT
COINBASE:SHIBUSD
CRYPTOCAP:SHIB
Buy now or miss out on the ride as signs are pointing up for the next big move - This will last until the 1'st of September be expecting heavy peak drops but a potential rise back to another potential level shib is on the move and it get's no better than this till October.
Day Chart and closing predictions
What are your thoughts on this potential rise?
#buyshibnow!

CHZ/USD Local trade. Pivot zone.Logarithm. Time frame 1 day. Local trend. The reversal zone (price squeezed) in the descending channel.
After the rebound, the price is squeezed in a narrow zone of 124-144. The chart shows the percentages to the key support/resistance levels from this price squeeze zone.
Risk management.
It's worth noting that the price of the coin is at a super profit, I've clearly shown this on the chart, which shows the entire main, long-term trend (the entire trading history). Consequently, when working on a coin, you need to keep this in mind and limit potential losses. Observe the risk management.
Secondary trend. Time frame 3 days.
CHZ/USDT Secondary trend

Bitcoin - BTC🟢candle close above bull run limit line 🚀Bitcoin
BTC 3-day chart candle just closed above bull run limit line👀🚨
Is🔴bottom floor #3 "THE BOTTOM" dear Crypto Nation❓🤔
Remember:
⚫️candle close in bottom zone
🔴bottom floor(s) #
🟢candle close above bull run limit line
bullish🚀
Let me know your thoughts in the comments🤗
⬇️⬇️⬇️
Likes and Follow for updates appreciated🤗
Disclaimer:
Not financial advice
Do your own research before investing
The content shared is for educational purposes only and is my personal opinion

POLYUSD Crossed over the Bear Cycle's Resistance! Major move!Polymath / POLYUSD crossed today above the Falling Resistance that dated back to September 4th 2021, the start of the Bear Cycle.
This is the first major bullish breakout signal, with the second and more decisive being when it will cross above the 0.382 Fibonacci level.
Be ready to buy that breakout and target the 0.618 Fibonacci at 0.4800, which was the September 8th 2022 (Lower) High.
Previous chart:
Follow us, like the idea and leave a comment below!!

Chainlink Update (The same playbook )Since October 2022 I have been getting things wrong with chainlink a lot , pretty much the only coin where I missed the target and time over and over . Most of the time its easier to trade Litecoin because it actually has organic movement.
Chainlink has not been moving organically in my opinion , there is no historical price movement that we can compare this sideways movement for over 400 days.
For me atleast it was looking like this was some sort of wyckoff accumulation period and we just had a spring event.
In my previous TA I tried to give traders a heads up that this was highly likely a coordinated move to get Chainlink at much lower prices.
It was very clear to me that this was the case just based on the wave of news and timing of the flash crash structure that came shortly after.
Its the same playbook over and over if its not a ETF to bring price up , its SEC hammer to bring it down or "China ban" or Elon musk selling btc holdings for tesla etc etc you get the picture.
So where are we now , still under the 1/2 Gann Fan , at 6.8 dollars Chainlink will be over the 1/2 Gann Fann , lets see if its start closing above it that would signal a big change for LINK in terms of market structure.
We also have this very nice support line here which until now I didn't notice , seems to be bouncing off this support for a long time.
As I posted in my previous post of LINK , my indicators have been flashing bullish divergence and 5 wave counts across the board.
This EW count suggests wave 5 is in and target is just under 8/1 Gann Fan , very interesting.
and finally we have the most important Chainlink chart , the LINK/BTC dominance last LINK TA I talked about potential hidden bullish divergence if it bounced on this trendline.
We got that bounce.
So to conclude here , never sell your Chainlink at these levels , there is clearly big things happening in the background , when a coin has coordinated attacks to dump price and goes into some sort of Wyckoff accumulation its extremely bullish long term it might not seem that way short term and its been a long road for LINK holders but the play in a bear/sideways market is always to load up on fundamentals .

BitcoinTypical weekend scam pump?
Looks to be hitting trendline resistance.
Unless you get some sort of confirmed breakout above I wouldn't be getting into longs based on this early green this morning.
Though I would LOVE to be proven WRONG and have this take off as i have plenty enough longs myself on proxy plays to make it great. I just don't see this really going anywhere.
My call was for a test of $29.8k so IF it breaks this trend for a proper fake out that would by my target.
