MARA Is Waking Up And Looks Promising For The Crypto MarketMARA Is Waking Up And Looks Promising For The Crypto Market, as it can send the price even higher this year from a technical and Elliott wave perspective.
Marathon Digital Holdings with ticker MARA nicely and sharply recovered away from the strong support after a completed projected higher degree abc correction in wave B/2. So, similar as Crypto market, even MARA can be forming a bullish setup with waves »i« and »ii« that can soon extend the rally within wave »iii« of a five-wave bullish cycle within higher degree wave C or 3, especially if breaks above 21 first bullish evidence level. It could be easily supportive for the Crypto market if we consider a positive correlation.
Cryptos

Total crypto MC - 1DThe total crypto market capitalization on the daily timeframe has formed a Falling Wedge pattern, which is typically a bullish reversal pattern. The price has broken out above the upper resistance line of the wedge, confirming the breakout. Currently, the price is undergoing a retest of the breakout level, which now acts as support. If this support holds successfully, it is expected that the market will experience an upward move in the near term, signaling potential bullish momentum.

COIN -- Major Trendlines + Bearish Divergence = Breakdown?Hello Traders!
Today I have shared the chart of COINBASE. Of course we cant know for sure what price will do, however you can take clues and combine them to give you a high probability reading of the chart.
Here are the clues:
1) MAJOR TRENDLINE
2) TRENDLINE
3) BEARISH DIVERGENCE
4) BULL FLAG MEASURED MOVE
When we combine these clues, a very bearish picture is painted... This signals to me that there is a high probability price will likely reverse and trade to the downside in the near future.
I hope everyone enjoyed this post and is able to use it as an educational tool.
Thanks everyone and best of luck on your trading journey!

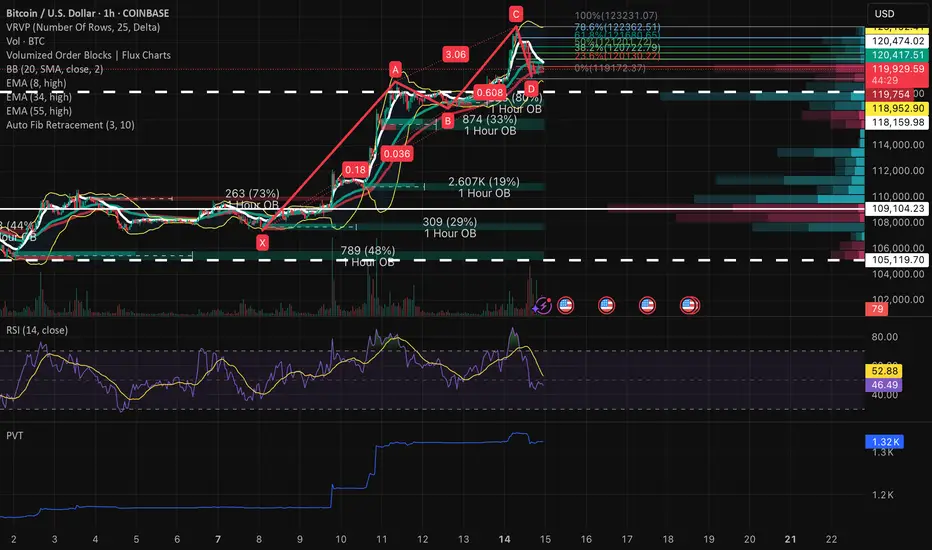
BTCUSD • 1H ABCD Completion at Key Confluence – Long Bias1) Macro → Micro Context
Daily / 4H Trend:
Still a clear up-trend on the daily & 4-hour: higher highs / higher lows above the 8, 34 & 55 EMA ribbon.
The $120 K–$121 K zone houses the largest Volume-by-Price node in two weeks, now acting as near-term support.
1H Context:
X→A: $106 100 → $118 950 impulsive run
A→B: ~15% pullback into $117 000 (≈0.15 XA)
B→C: 3.06× extension to $123 230
C→D: Retrace into $119 900–$120 300, matching 0.618 BC & ~80% XC Fib
2) Structural & Momentum Breakdown
AB=CD & Fib Confluence: D at $119 900–$120 300 aligns perfectly with both 0.618 BC and ~80% XC retracements.
1H Bullish Order Block: $119 900→$119 750
20-period SMA (mid-BB): ≃$120 100
VRVP High-Volume Node: Centered ≃$120 400
RSI (14): Holding 47–50 on the hour, flattening and poised to curl up
PVT: Flat-to-up on the pullback—sign of absorption
Volume: Contracts into D, then a slight uptick on the last 1 h bar
3) Exact Trade Plan
Entry: $119 400 - $120 300
Stop-Loss: $117 300 - $118 000
Take-Profit 1: $121 800 → $122 200
Take-Profit 2: $123 000 → $123 500
Optional “Hype” TP instead of TP 2: $125 000 → $126 500
(for a parabolic push if the upcoming House vote prints strong headlines — targets at 78.6%–100% BC extensions)
Entry Confirmation (any one):
1 h bullish engulfing or inside bar within entry zone
RSI (14) closes back above 50 on the hourly
PVT prints a higher low with renewed buy-side volume
ETH / USDC Liquidity Pool RangeEthereum is climbing alongside Bitcoin, but it’s clearly outperforming. In many ways, ETH is the Microsoft of the crypto space—serving as a foundational platform on which countless networks and tokens are built, much like Windows supports a broad software ecosystem. In contrast to Bitcoin’s role as a digital currency, Ethereum functions more like a software operating system.
We broke out of the previous range for strong profits. The new range is tighter, with the lower boundary set just above the current ETH spot price at $2,995.91 and the upper boundary at $3,340.90, as marked by the horizontal yellow lines. On the 3-hour chart, momentum is beginning to turn upward. To enter the liquidity pool within this range, we must be fully allocated in ETH.

Feeling the waves (Ripple $XRP)Setup
The price has been consolidating since the explosive move from ~50c to $3 last year. There has been a wide $1 price range between $2 and $3. A failed breakdown below a still rising 30-week moving average and new 4-month high suggest underlying bullishness.
Signal
Should there be any follow-through to last week's big up-move, then any pullback to the golden pocket between the 50% and 61.8% Fibonacci retracement levels could trigger a rebound.

BITCOIN =140-150kThe X-wave has formed in the form of a neutral triangle pattern, and eventually Bitcoin could once again touch $106,000 and move towards $140,000-150,000 with the completion of wave-e.
Good luck
NEoWave Chart


Bitcoin Smashes Records, Hits $117,000Bitcoin has climbed to a new all-time high of approximately $117,000, gaining further credibility as an institutional asset class. Strong demand from ETFs, growing mainstream adoption, and a favourable stance from President Trump regarding crypto regulation are all contributing to this momentum.
As Bitcoin grows in market cap and adoption, its volatility has been slightly dampened, but it remains highly reactive at technical pivot points.
Technical View (BTC/USD):
The next resistance sits at $118,000, which also coincides with the 161% Fibonacci extension level. If price stalls here, expect potential pullbacks toward $114,000 or even down to $110,000. However, a confirmed breakout above $118,000 could re-establish a new bullish leg.

COIN long -- currently in Wave 3 of 5 wave advance I've been using Elliott Wave Theory to look at COIN's price action. We seem to be in the middle of Wave 3.
- Wave 1: April 7, 2025 to May 22, 2025
- Wave 2: May 23, 2025 to June 13, 2025 - we pulled back right below the 23.6% Fibonacci retracement level with ~$244 serving as support.
- Wave 3: June 14, 2025 - now. The third wave usually has 5 distinct sub-waves. As of July 7, 2025 We appear to be in the 3rd sub-wave of wave 3. Using the upper channel line, price target for this wave is around $408-$410. Quite possible if we see BTC move up explosively, which also seems imminent given the highest weekly close on July 6, 2025.
COIN is a very volatile stock that has explosive moves to the up and downside. I think we still have more room to run in this current wave 3--even beyond sub-wave 1 peak at $380.

Crypto at All Time Highs! But...Last month I shared a chart of an equal-weight crypto basket suggesting crypto may be on the cusp of fresh All Time Highs -- those highs have arrived! While that is certainly exciting for crypto holders one should take note of other aspects of the rally.
The US Dollar has depreciated substantially against foreign currencies this year (2025)
Bitcoin has yet to reach a fresh high against Gold
Bitcoin is strongly correlated to US equities, which are also at all time highs
USD Decline
The US Dollar is down a whopping 10% against a basket of foreign currencies this year, lead ostensibly by President Trump's raucous political policies, most notably aggressive tariffs across the globe and industries. The crypto rally therefore could be characterized as more of a Dollar softening than a crypto strengthening.
Bitcoin v Gold
Bitcoin - still the epicenter of all things crypto has not topped Gold.
Gold in fact has been on a heater of late against the Dollar.
Many folks still regard Gold as "real money". As such crypto could be said to be in a "stealth bear market", especially considering the declining momentum against Gold while failing to match its highs.
Bitcoin v Stocks
Bitcoin is also strongly correlated to US equity performance, despite claims that it's a hedge. The correlation has only grown stronger as Bitcoin's price against the Dollar has soared.
That said, it does consistently outperform equities, as long as the music is still playing!
Closing Thoughts
Most people likely don't care about how Bitcoin is faring against Gold. Bitcoin, the highest quality form of crypto is itself still highly speculative. While an equal-weight basket of cryptos is impressively reaching an all time high against the Dollar, coins with smaller market caps will surely be the first to go when this speculative impulse subsides.
There's probably still some gas in the tank at this point, but now is a good time to consider trimming positions before you miss the chance 🤑

SOL TO 167?Good morning folks
so it looks like we are correcting down possibly down to 153 then seeing a drive up to 167. What are your thoughts on the market for Solana
Looks like things are heating up for Solana
Kris/Mindbloome Exchange
Trade Smarter Live Better

XRP head to 7$XRP will make it the 2nd biggesst crypto in histiry surprassing Ethereum once ET Network is suffeering the biggest sells ever by traders.
Everyone on the other side is beting on Bitcoin, making it bigger but with room for others like XRP the best performing crypto in history.

Bitcoin Is Looking For A Bullish ContinuationMorning all! Bitcoin has impulsive characteristics on 4h time frame, and we can clearly see five waves up that can send the price even higher after recent projected ABC correction. With the current impulsive recovery back above 106k area, it confirms that bulls are still here and we should be aware of further rally in July, especially if breaks above channel resistance line near 110k area. Seems like it's in wave (1) of a new five-wave bullish impulse, so after current wave (2) pullback, we can expect more gains within wave (3).

ETH: Buying in the DipCME: Micro Ether Futures ( CME:MET1! ), #microfutures
On May 22nd, #Bitcoin reached a new all-time high of $111,814. The king of cryptos rallied as bullish sentiment built up behind the most pro-crypto U.S. administration. As of last Friday, bitcoin realized a one-year return of +90.8%. For comparison, holding S&P 500 only yields 11.8% for a year, even after the US stock index made its ATH last week.
Meanwhile, #Ethereum, second only to Bitcoin in the cryptocurrency world, experienced a dramatic decline in 2025. ETH is currently trading around $2,500, down 40% since December. It is a far cry from its ATH of $4,815 on November 9, 2021.
Why Is Ethereum (ETH) Falling?
The most significant challenge facing Ethereum is the proliferation of Layer 2 scaling solutions. Networks such as Arbitrum, Base, and Optimism were developed to address Ethereum's scalability issues, but they've created a revenue problem for the main chain.
When users conduct transactions on these Layer 2 networks, transaction fees flow to third-party organizations rather than to the Ethereum network itself. Revenue diversion has weakened Ethereum's economic model.
Ethereum could counter the revenue erosion by implementing a fee on Layer 2 transactions. However, it would undermine the very purpose of these networks. Layer 2 solutions were designed specifically to reduce transaction costs by processing operations off-chain and submitting only batched results to the main network. Adding fees would increase costs and diminish their competitive advantage.
Increased competition in the blockchain space has further eroded Ethereum’s dominance. Investors have been withdrawing funds from Ethereum and redirecting them to competing projects with potentially better returns or technological advantages.
Future Outlook
Ethereum’s path forward appears challenging. While the platform still hosts thousands of decentralized applications and maintains a large developer community, its economic model is under pressure from multiple directions. Without finding new ways to generate value, Ethereum may continue to lose market share to more nimble competitors.
The platform’s supporters point to upcoming technical improvements and the maturation of the proof-of-stake consensus mechanism as potential catalysts for recovery. The recent approval of staking enabled ETF for Ethereum in Hong Kong is one of the ways forward. However, with increasing competitive pressures, Ethereum faces an uphill battle to reclaim its former status as the undisputed leader in smart contract platforms.
While the future remains challenging, Ethereum still has upside potential at the current price level. As ETH dropped below $1,500 in April, bargain hunters came in to scoop it up. As a result, ETH had a spectacular rebound of 70% in the last three months, outrunning Bitcoin’s 25% gain for the same period.
There are over 17,000 cryptocurrencies in existence, according to Coin Gecko. However, only a handful of them have proven to have a lasting investment value. We could refer to Bitcoin and Ethereum as the digital form of Gold and Silver. Historical trend shows that the spike in gold prices would likely prompts investors to buy silver at a lower cost, helping maintain a stable Gold/Silver price ratio. The same could be true for the BTC/ETH relationship.
For extensive reading, please refer to my Editors’ Picks, The Gold-Silver Ratio Explained, published on TradingView on April 28th.
Recent regulations on #stablecoins in the US and Hong Kong are good news to the crypto space. It legitimates crypto offerings from mainstream financial institutions. Bitcoin is positioned for another big lift as investors reallocate assets into cryptos.
On July 4th, President Trump signed into law the “Big and Beautiful Bill”. Above all, this massive package funds deficit spending and raises the national debit by $5 trillion. While we will carry the debt burden for many years, in the short run, injecting huge liquidity into the economy and the financial market would pop up asset prices.
The latest CFTC Commitments of Traders report shows that, as of June 24th, the total open interest for Micro Ether futures are 128,500 contracts.
• Leverage Fund has 94,167 in long, 112,442 in short, and 1,854 in spreading
• The long-short ratio of 0.84 does not provide a good indication of what the “Smart Money” views about Ethereum.
In summary, I hold the view that ETH may regain ground above 3,300 before year end. Investors sharing this bullish view could explore CME’s Micro Ether Futures ( NYSE:MET ).
Long Futures with Stop Loss
Last Friday, the August Ether Futures contract (METQ5) was settled at 2,518. Each contract has a notional value of 0.1 ETH, or a market value of $251.8. To buy or sell 1 contract, a trader is required to post an initial margin of $84. The margining requirement reflects a built-in leverage of 3-to-1. It’s cost-effective to invest with CME MET futures, vs. buying ETH from the spot market.
Let’s use a hypothetical trade to illustrate how the long futures with stop loss strategy would compare with buying spot ETH.
Hypothetical Trade:
• Buy 1 METQ5 contract at 2,518, and set a stop loss at 2,400
• Trader pays $84 for initial margin
High Price Scenario: Ethereum rises to $3,000
• Futures gain will be $48.2 (= (3000-2518) x 0.1)
• Futures return will be +57.4% (= 48.2 / 84)
• This compares to a 19.1% for investing in spot ETH. (= (3000 /2518) – 1)
Low Price Scenario: Ethereum drops to $2,000
• Futures stop loss at 2,400, and the maximum loss is $11.8 (= (2518-2400) x 0.1)
• Futures return will be -14% (=11.8 /84)
• This compares to a 20.6% loss for investing in spot ETH. (= (2000 /2518) – 1)
The above scenarios show that
• When ETH goes up, futures will have higher returns due to its leverage nature.
• When ETH falls, the stoploss will kick in to reduce losses.
Happy Trading.
Disclaimers
*Trade ideas cited above are for illustration only, as an integral part of a case study to demonstrate the fundamental concepts in risk management under the market scenarios being discussed. They shall not be construed as investment recommendations or advice. Nor are they used to promote any specific products, or services.
CME Real-time Market Data help identify trading set-ups and express my market views. If you have futures in your trading portfolio, you can check out on CME Group data plans available that suit your trading needs www.tradingview.com

BTC/USDT Back Test Perhaps it's not surprising to say that I see a chance to put the $99,000 zone back in the test. Just because of the FVG. Even if it doesn't happen, I see an upward trend now.

Ethereum Trading Strategy: 5:1 Risk-to-Reward Ratio"Ethereum Showing Strength on the 4-Hour Chart — A New Bullish Trend Emerging?"
The 4-hour timeframe is starting to show strong bullish momentum. Could this be the beginning of a new uptrend?
A potential 5:1 risk-to-reward setup is forming:
Entry: 2,620
Stop Loss: 2,364
Target: 4,062
Support 2500 must hold!!!

Crypto Market Completes A Correction Within Bullish TrendGood morning Crypto traders! We got a nice bounce and recovery in the Crypto market along with stock market rally after US President Donald Trump announced that Iran and Israel had agreed to a ceasefire, calling the conflict “The 12-Day War.”. Crypto TOTAL market cap chart now shows that correction is completed, support is in place and bulls back, so more upside can be seen in upcoming days/weeks, just be aware of short-term intraday pullbacks.

BITCOIN SELL TRIGGERED Following our previous analysis, BTC took both the sell-side and buy-side liquidity. It's currently within a premium zone and has major supply, so a sell entry was triggered.
Risk management is intact, target 1:3 RR. Good luck fams.

Crypto Stocks to the moon?NASDAQ:MSTR , along with numerous other publicly traded companies with significant cryptocurrency exposure, experienced a remarkable rally during the previous crypto bull market. There are indications that a similar dynamic could be emerging once again.
#bitcoin #crypto #stocks #stockmarket #portfolio

USDT.D Showing Signs of Bounce – Altseason at Risk?USDT Dominance is still moving within a rising parallel channel, holding just above the nearest support zone. After a brief dip, price is now showing signs of recovery from the lower boundary of the channel.
However, the key resistance zone near the top of the channel has proven tough to break — it rejected price on the last attempt.
Until we get a clear breakout or breakdown from this channel structure, the market may remain choppy. A breakout above 5.00% could signal risk-off sentiment (bad for alts), while a drop below the support zone may trigger altcoin momentum.
Stay cautious — the market is still undecided.

OTHERS data points to biggest ALT-Season Good Day Investors and traders,
This the OTHERS on the weekly and I have taken some measured moves in what could be expected in time and price.
The OTHERS chart in my opinion is the last form of the higher risk curve which generally happens at the very end of cycles The others does not include the top ten crypto, so it a very good form of risk on.
I have been looking at the OTHERS chart fairly often of recent times because this is the time for it to really outshine Bitcoin and lead the market with fairly explosive gains.
I have marked a couple of possible time lines that could occur and both seem to be lining up in sort of way or another. From what I can see, others has one big wave remaining, and it’s the one you don’t want to miss
The Indicators
Fibonacci retracement
I have placed a potential take profit zone from the 1.272 to the 1.618 levels and anywhere in between. I have added an up trending channel that OTHERS would have to hold to stay somewhat relevant or then could be susceptible to adjustment.
2.RSI
I have measured the first breakout of the RSI from the 2015-17 and 2019-21 bull runs along with this one so far. The one more relevant to us is 2015-17 as this is the cycle we are more closely following. There seems to be a recurring trend of 90 plus bars before a top to OTHERS. One more thing that really stands out to me in the RSI this the first time it has shown a very strong bearish divergence. normally it seems to maintain or gain strength. right to the very end. time will reveal the real issue here.
3. ISO
The average sentiment oscillator to also show very consistent data for us. I have two measurements. The one points to late July and the the other late October. To me this could be the potential ALT-season time frame from July as it fizzles in the October time frame.
My suggestion to you is follow what you have been taught so far, do not get greedy, take profits when they are there and trust your game plan and stick to it. ALT- SEASON can you a lot of money, or lose you a lot of money. By design, its there to take any profits you have may have, or catch any late coming stragglers. Don’t get caught up in the hoopla.
Once again, I ask you for you input, I really want to hear from you.
Check my bio for more links and information
Kind regards,
WeAreSat0shi

Stablecoins will Supercharge Cryptos AdoptionCME: Micro Bitcoin Futures ( CME:MBT1! ), #microfutures
On June 5th, Circle Internet Group ( NYSE:CRCL ), issuer of the #USDC #stablecoin, debuted its initial public offering at $31 per share. By June 23rd, NYSE:CRCL prices peaked at $298.99, up nearly ten folds in just 13 trading days.
At Friday's closing of $180.43, Circle has a market cap at $40.2 billion. Wall Street gave a mindboggling price earnings ratio of 234, based on Circle’s $0.77 earnings per share.
How to Invest in Stablecoins
Stablecoins are cryptocurrencies that aim to maintain price stability. Both USDC and #USDT (issued by #Tether) peg their value to the US dollar. Paying $1 for 1 stablecoin, you will get exactly $1 back in one month, one year, or ten years. Unlike buying Bitcoin, there is no investment return for holding stablecoins. So why would anyone want them?
Because stablecoins are not investment instruments, instead, they are payment methods. Like PayPal and Apple Pay, USDT and USDC enable users to move money fast and cheaply globally, but now in the crypto world.
How do stablecoin issuers make money? They generate revenue through interest on reserves, transaction fees, lending, and partnerships with financial institutions.
• The biggest source of revenue is interest income. When it comes to stablecoin issuers, size matters, and the Fed matters.
• Based on a study by Artemis, Castle Island Ventures, and Dragonfly on May 29th, USDT and USDC have a combined market capitalization of over $214 billion.
• With the Fed Funds rate averaging above 5% last year, the $214 billion reserve investing in Treasury and other high-quality bonds could yield at least $12 billion between Tether and Circle.
• Tether reported 2024 profit of $13 billion, while Circle generated $1.68 billion last year.
Investing in stablecoins means buying Circle stock, not converting cash into USDC. The difference is like buying Apple stock vs. adding money in your Apple Pay account.
Headwinds and Tailwinds
On June 17th, the US Senate passed the GENIUS Act of 2025. It establishes a regulatory framework for the $250 billion market for stablecoins. “Stablecoins are a paradigm-shifting development that can bring our payment system into the 21st century", declared Sen. Bill Hagerty of Tennessee, who introduced the bill.
With regulatory certainty, real-world utility and adoption will quickly follow. The future for stablecoins is very bright, and I expect the market size to double soon. However, market leaders Tether and Circle both face strong headwinds going forward.
• Real world utility brings in fierce competition. Big banks and credit card issuers will create their own stablecoins to keep customers on the book. This will slow down Tether’s and Circle’s efforts to attract mainstream financial investors.
• I expect the Fed to cut interest rates by a lot during the remaining 3-1/2 years of the Trump Administration. Some cuts will happen under the current Fed Chair. A lot more will come by his successor beginning June 2026. Lowering interest rates by 100-200 basis points will cripple stablecoin issuers’ main income.
In my opinion, the high dependency in growth and interest rate policies make NYSE:CRCL a very risky investment at the current lofty valuation.
Bullish Signal for Bitcoin
In the past, stablecoins were mainly used by crypto investors. Going forward, mainstream investors will find compelling offerings from their banks, stockbrokers and credit card companies. When mainstream financial intermediaries begin making serious inroad into cryptos, there will be a paradigm shift.
In my opinion, the new development in stablecoins will supercharge the growth of crypto market size. Bitcoin, being well established as a Digital Gold, will benefit the most from the global asset reallocation to cryptocurrencies.
An investor sharing a bullish view on bitcoin could explore the CME Micro Bitcoin Futures ( LSE:MBT ).
Last Friday, the August MBT contract (BTCQ5) was settled at 108,640. Each contract has a notional value of 0.1 bitcoin, or a market value of $10,864. To buy or sell 1 contract, trader is required to post an initial margin of $2,598. The margining requirement reflects a built-in leverage of 4-to-1, which is more cost-effective that buying bitcoins from any ETF fund.
A long MTC strategy with a stop-loss would enhance the returns while limiting the potential losses. Below is a hypothetical trade for illustration purposes only:
On Day T+0, buy 1 BTCQ5 at 108,640 and set a stop loss at 105,000
• The portfolio value is 10,864
• Upfront margin is $2,598
Rising Bitcoin Scenario: On Day T+N, Bitcoin goes up 20% to $130,368
• Futures gain will be $2,172.8 (= (130368-108640) x 0.1)
• Investment return will be +86.6% (= 2172.8 / 2598), excluding transaction fees
• This compares to a 20% gain with bitcoin ETF, with no leverage
Falling Bitcoin Scenario: On Day T+N, Bitcoin drops 20% to $86,912
• With a stop-loss at 105,000, losses will be capped at $364 (= (108640-105000) x 0.1)
• Investment return will be -14% (= -364 / 2598)
• This compares to a 20% loss with bitcoin ETF, with no stoploss provision
Happy Trading.
Disclaimers
*Trade ideas cited above are for illustration only, as an integral part of a case study to demonstrate the fundamental concepts in risk management under the market scenarios being discussed. They shall not be construed as investment recommendations or advice. Nor are they used to promote any specific products, or services.
