Bitcoin short position After my win streak from previous trades on btcusd I happy to give me to the people who followed me
Here's another great trade for you
Short Bitcoin with a limit order at 108,500
Take profit at 101k , stop loss at 109,500
A 7.5 to 1 risk reward ratio 🔥😉
You can never find anybody trade Bitcoin like me
Cryptos

Bitcoin Bounced Right Where It ShouldBitcoin continues to respect the script — breakout, clean retest, and now holding strong.
The 50 EMA has been a reliable dynamic support throughout the entire uptrend, and once again, it helped catch the recent dip. Price has now successfully retested the breakout zone and is starting to bounce.
Structure looks healthy, momentum is building, and unless the support fails, the next leg up could be just around the corner.
Simple setups. No noise. Just trend.
DYOR, NFA

BTC 120K READY ???BTC 4H Chart Update 📉📈
Bitcoin is still trading inside a descending channel, but bulls are now testing the upper trendline for a potential breakout.
Price is consolidating just below $107K, showing strength after the recent bounce from the bottom of the channel.
🔹 Structure: Descending Channel
🔹 Current Resistance: $107K–$110K zone
🔹 Break & close above = bullish breakout confirmation
🔹 If breakout and close above 110k than this target possible
🔹 Target after breakout: $112K-120K+
⚠️ Rejection = pullback likely toward $103K–$104K support
📊 Breakout or breakdown — decision time is near!
#BTC #Bitcoin #Crypto #TechnicalAnalysis #BreakoutSetup

XRPBTC May Face Another Rally This YearXRPBTC pair can be trading in a larger weekly (A)(B)(C) flat correction, where wave (C) can be now in progress as a five-wave bullish impulse back to 2021 highs.
XRPBTC is currently slowing down due to BTC dominance, but notice that it's now testing February 2025 lows, so wave 4 correction can be coming to an end, which can extend the rally for wave 5 of (C) towards 0.000040 area and it can bring the ALTseason.

Solana Heading to 112 or 330+Hey fam
So for Solana if we hold under 148 then a drive down to 112 makes sense. However if we drive above 148 then we can possibly hit weekly targets of 330
Make sure you adjust accordingly in a smaller time frame to ensure your in the right move
Happy tradings folks
Kris Mindbloome Exchange
Trade Smarter Live Better
Under 148 we go to 112 if we break 148 we can see a drive up to 338

SatochiTrader Expecting a huge BTC CRASH AFTER This..BTC Market Update by SatochiTrader
EVERY CRASH DID START WITH A FALSE INCREASE TREND.
Depending on the market sentiment and price action, BTC is currently showing strength with a positive trend. However, based on deeper data and insights held by myself and a small group of early-cycle followers, this current movement may be a deceptive signal — potentially foreshadowing a major crash.
This is not trading advice. Those who are confident in the long position should continue, and those on the other side should stay prepared as well.
We have previously explained that the current cycle appears to have ended. Since 2013, BTC has consistently respected its macro cycle targets. The end of such a cycle typically leads to significant corrections.
A cycle ending implies not just a retracement, but the potential for a major crash. Hedge funds and real BTC whales understand the underlying indicators and risks at play. Our expectation remains clear: BTC may soon fall below the 100K level, with $85K identified as a critical support and target zone.
Stay sharp. Stay informed. The market may look bullish — until it isn't.
The best way to follow BTC is not the news.. but the cycle overview.
This update is an education update, which means the high expectations of the upcoming correction for BTC.
Compared to last quarter, miners are now less severely underpaid, though profitability remains low

BTC BUY NOW ?BITSTAMP:BTCUSD
Bitcoin flushed out .
Next Impulse started from 98200 - 98400 range.
Entered long @98700 with SL the low.
Expecting a rally & holding it to ATH
Small Risk and changing SL to CtC when it crosses 100300

Bitcoin are heading to 114k or 92k A quick little analysis on BTC, we can either push up higher to 114k levels breaking new highs is a must for price action to validate bill swing. However if we break a couple lows be prepared for 92k run down
Kris/ Mindbloome Exchange
Trade Smarter Live Better

XAU/USD Double Bottom Breakout Bullish Momentum Incoming!XAU/USD Double Bottom Breakout 💥 | 🚀 Bullish Momentum Incoming!
Analysis:
🟡 Double Bottom Pattern: Two clear lows have formed around the $3,340 support, signaling a potential reversal.
🟦 Accumulation Zone: The price consolidated in a range, indicating strong buying interest before the breakout.
🟣 Bullish Momentum: Recent aggressive bullish candles show strong buying pressure.
📈 Breakout & Retest Zone: If the price holds above $3,370, a bullish continuation toward $3,409 and possibly $3,445 is expected.
🧭 Target Area: Marked with a blue box, the upside potential is clearly projected.
Conclusion:
A successful retest of the breakout level may lead to a strong bullish run. Keep an eye on $3,370 as the pivot zone. 🎯

XRP Price Finds Some Relief — But Headwinds Remain,Says ArtavionAfter slipping below $0.50 last week, XRP has rebounded modestly, now trading above $0.52. While this short-term recovery provides relief for holders, fundamental and structural challenges still limit the token’s upside potential, according to analysts at Artavion.
The recent bounce appears largely technical. Support held near $0.48, and with Bitcoin regaining strength above $66,000, sentiment across altcoins briefly improved. XRP’s Relative Strength Index (RSI) has moved out of oversold territory, suggesting some room for additional upside — but resistance between $0.56 and $0.60 remains firm. Low trading volume suggests the rally lacks conviction.
A major ongoing concern remains XRP’s legal battle with the U.S. Securities and Exchange Commission (SEC). Although Ripple Labs scored partial wins, the case is unresolved. Until a final judgment or settlement is reached, institutional investors will likely remain cautious, and U.S.-based platforms will continue restricting XRP exposure.
🗨️ “The legal cloud hasn’t lifted — and that limits capital inflows,” says a regulatory analyst at Artavion.
From a network perspective, XRP Ledger remains functional and Ripple’s payment infrastructure is active, particularly in select cross-border corridors. However, XRP still lacks integration with key crypto sectors like DeFi, NFTs, and gaming, which restricts organic demand and developer activity.
Externally, macro conditions are neutral to negative for altcoins. The Federal Reserve’s rate outlook and rising bond yields continue to pressure speculative assets. Stablecoin inflows into XRP trading pairs have slowed — another signal of fading short-term appetite.
Outlook
At Artavion, we believe XRP is currently locked in a range-bound pattern. A breakout above $0.60 is unlikely without:
Full legal clarity in the U.S.;
Stronger altcoin sentiment market-wide;
Renewed ecosystem development and integrations.
🗨️ “XRP isn’t broken — it’s waiting,” says the Artavion market desk. “But without a catalyst, it stays reactive — not directional.”

MOODENG 100% GAIN ????MOODENG ready to go 0.3000 ??? yes if moodeng hold the bullish ob than possible we will go o.3000 or more moodeng already pump hard now at ob so expecting good gain from here if ob not break here a trade plan mange your risk accourding your captial
entry plan
0.1200_1300
targets
0.2500
0.3000
0.5000
sl
0.1100_0.10000
its NFA DYOR

ETH READY TO GO 3000$ ???🔍 ETH/USDT Analysis – Daily Timeframe
ETH is currently trading at $2,427, holding above the key support zone around $2,370 - $2,390, which is aligned with the 100 EMA. This zone has acted as a strong accumulation area.
📈 Market Structure:
Price is consolidating inside a horizontal range. A confirmed breakout above the resistance zone ($2,650 - $2,700) could lead to a bullish continuation towards the major resistance at $2,861.
📊 Technical Outlook:
Trend: Sideways range (accumulation phase)
100 EMA: Acting as dynamic support
Breakout Potential: Bullish continuation expected on breakout and retest
📌 Trade Plan (Not Financial Advice):
Entry Idea: Break and close above $2,700 zone
Target: $2,861 and higher
Invalidation: Daily candle close below $2,370
ETH is building strength above its 100 EMA. A breakout from this range can trigger a fresh bullish leg.
🔁 Like & share your opinion! Always DYOR before trading.

Bitcoin Could Hit as High as $400KWhen comparing our macro cycle to the 2017 cycle, we see the potential for a very parabolic run on Bitcoin. I believe Bitcoin could hit as high as $400K by 2029. This is because Bitcoin tends to follow the stock market, and I anticipate a major blow-off top coming for the stock market. I expect one more big parabolic run on the Dow Jones leading up to 2029, which would fuel Bitcoin’s rise to $400K.
The lowest I see Bitcoin going during this parabolic run is $250K. On the higher end, I could see it hitting $400K or even more. Big things are coming.
As always, stay profitable.
— Dalin Anderson

Litecoin Is Forming A Bullish PatternLitecoin with ticker LTCUSD made nice and clean five-wave recovery back to 100 area in the 4-hour chart, which confirms support in place and bullish reversal, so it can be a higher degree wave (1), thus more upside is expected for a higher degree wave (3) after current complex W-X-Y correction in wave (2) that can be in final stages. First support is here around 90-85 area, while second deeper one would be at 80 area.

GateChain Slows Down Within An Impulsive Bullish TrendGateChain with ticker GTUSD came slightly lower, but we still see it trading in a higher degree wave »iv« correction that can resume the bullish trend for wave »v«. It can be actually finishing final subwave (c) of a three-wave (a)(b)(c) corrective decline, so keep an eye on strong support here at the former wave (iv) swing low and 38,2% Fibonacci retracement. If we get sharp rebound and impulsive rise back above channel resistance line near 20 bullish confirmation level, then we can easily expect further rally within final wave »v« of 5 this year, which can push the price even up to 35 – 40 target area.

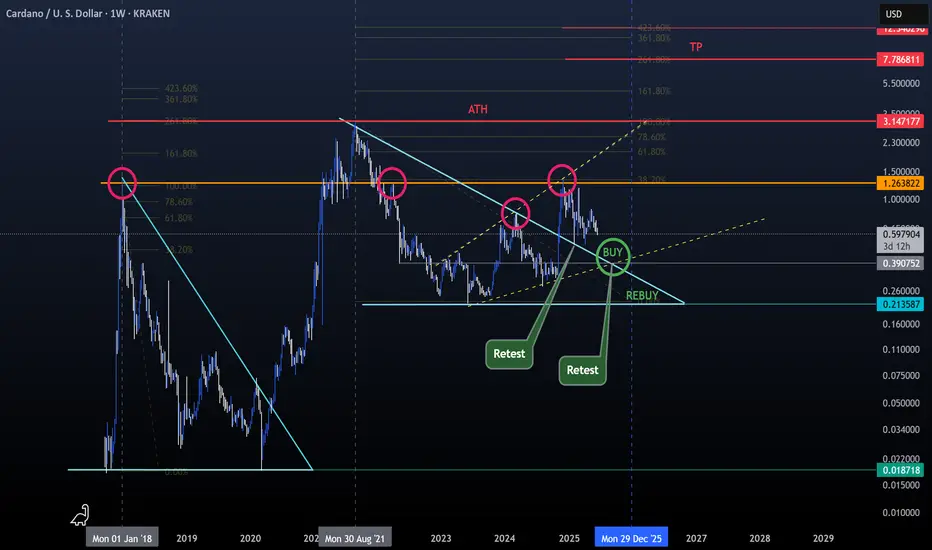
Cardano UpdateA lot of you have been DMing me asking for altcoin analysis. i hear you, but here's the truth:
- Right now, most altcoins are simply too weak to offer a reliable forecast. I prefer to post when timing makes sense, not just for engagement, but to avoid misleading anyone.
- BTC Dominance is still heavily suppressing the altcoin market, and I’d rather wait than risk rekting my followers with premature calls.
So why do I post about Cardano? :
- Simple, Cardano is one of the most established altcoins. It makes sense to track its evolution alongside Bitcoin and Ethereum. When you're analyzing the broader market cycle, starting with BTC, ETH, and ADA gives meaningful context. Newer cryptocurrencies from 2020+ don’t have the same historical data, which makes reliable analysis much harder.
Back to Trading (Everything is marked on the chart for easier reading) :
- Cardano got rejected around $1.25, which aligns with its 2018 ATH, a key historical resistance.
- Check the bullish megaphone pattern and how it connects with the trendline and that $1.25 level (marked with yellow dotted lines).
- Also observe the minor bounces and retests above the bearish triangle trendline (light blue).
What we can do now?
- Nothing. If BTC dips, altcoins will likely follow and get rekt.
Best strategy for now:
- Consider setting a buy order around $0.41 (don’t go all in).
- Keep some dry powder in case of further downside, potentially to rebuy around $0.21 if pressure continues.
Be wise, be patient, ride the wave, don’t fight it.
Happy Tr4Ding !
DeFi Index Completes Irregular Flat Correction; Bulls Back?DeFi Index may have a completed irregular flat correction within an uptrend, which may cause another rally this year, according to Elliott wave theory.
Cryptocurrencies are recovering and DeFi Index is now bouncing back above EW channel, so a five-wave impulse into wave (C) of an irregular (A)(B)(C) flat correction in blue wave B can be finished. It means that a higher degree blue wave C can now be in play, which can rally this year all the way back to March 2024 highs. Is this the beginning of an ALTseason?
A basic bullish irregular flat correction is a three-wave (A-B-C) pattern where wave B exceeds the start of wave A and wave C dips below wave A before the overall bullish trend resumes.

$RPL 4H AnalysisGETTEX:RPL 4H Analysis 🔥
RPL is currently trading at the lower boundary of a parallel ascending channel, which has acted as strong support multiple times in the past. The price action shows a clear higher high, higher low structure, indicating an ongoing uptrend.
Currently, the price is hovering around the key horizontal demand zone ($5.5–$5.8). This level has previously acted as a launchpad for aggressive bullish moves, and we are seeing early signs of accumulation again.
Bullish Scenario:
If the support holds, RPL is likely to retest the midline of the channel around $7, followed by a potential breakout toward the upper trendline near $9 – $9.5.
The risk/reward setup here is highly favorable for swing traders.
What to watch:
Hold above $5.5 = bullish continuation likely 🚀
Break below $5.5 = invalidation of structure ⚠️
📈 Conclusion:
Structure remains bullish. This is a textbook channel bounce setup with targets of $7 → $8.5 → $9.5 if momentum kicks in. Volume confirmation will be key.
#RPL #RocketPool #CryptoTrading #Altcoins #BreakoutSetup #TechnicalAnalysis

$BTC 4hr - The Calm Before Bitcoin’s Next Move💡 In bull markets, triangles break UP more often than down.
But volume + macro + ETF flows > patterns.
Set alerts, manage risk, stay nimble.
#BTC #CryptoAlpha #RiskManagement
🎯 Key Levels Analysis:
✅ Resistance: 106.3K
→ This level matches the upper bound of the symmetrical triangle and is reinforced by multiple recent rejections. Also aligns with previous highs.
✅ Support: 103.7K
→ Mid-range horizontal support. Price reacted here multiple times. It's also near the triangle base.
✅ Support: 99.6K
→ Clean psychological + technical level. A previous consolidation zone. Would likely trigger a strong reaction.
✅ Last Line of Bull Defense: 95.2K
→ Major horizontal support from the April/May breakout structure. Losing this would likely invalidate the bullish structure.

Bitcoin Pushed Crypto Market Into A Higher Degree CorrectionGood morning Crypto traders! Cryptos are coming lower and we can now see a five-wave drop on Bitcoin, which indicates for a deeper, higher degree correction, so Crypto TOTAL market cap chart may stay in consolidation within an ABC correction, which can retest 3.0T – 2.8T support zone before bulls return.
Bitcoin has impulsive characteristics on 4h time frame, and we can clearly see five waves up that can send the price even higher after a pullback. Now that it’s back to all-time highs, we can see it making a higher degree ABC correction, which can take some time, and it can retrace the price back to 97k-93k support zone before a bullish continuation.
However, we may now see a temporary corrective recovery in wave B, where some ALTcoins could still be doing well, if we consider that ALTcoin dominance may start kicking in. Yesterday we shared a chart of the ratio of TOTAL3(ALTcoins) market cap against Bitcoin with ticker TOTAL3ESBTC, which shows that ALTcoins may start outperforming BTC soon. It can be finishing final subwave C of (Y) of a correction in blue wave B which may cause a new strong rally into wave C that can bring the ALTseason similar as in the beginning of 2021.

My BTC Play With a Macro BoostThis isn't about guessing.
This isn’t hype.
This is what happens when structure, liquidity, and macro fundamentals align.
Let me break it down:
Technical Perspective
BTC just pulled a classic trap.
✅ Liquidity Sweep: Price dipped below the 4PDL (Previous Day's Low), sweeping out late longs and triggering emotional shorts.
✅ Break of Structure (BOS): Price broke cleanly broke strucutre, confirming bullish intent.
✅ Fair Value Re-entry Zone: We now have a clean FVG zone if price pulls back.
But that’s not all...
🔼 Retail Pattern Detected :
Look closely, there's a textbook ascending triangle in there. Retail traders often use it to predict bullish breakouts. What they see as a triangle, we see as smart money coiling pressure before the move.
Fundamentals Supporting the Structure
This move isn’t just technical, it’s backed by real market weight:
Public companies are buying Bitcoin by the billions: MicroStrategy, Trump Media, Metaplanet they’re not “speculating,” they’re storing BTC as a treasury asset.
Institutional inflows are accelerating: ETFs, sovereign interest, and large-cap investors are building long positions — and it’s beginning to reflect in the chart.
The U.S. is formalizing a Bitcoin reserve policy.: Call it political, strategic, or monetary — either way, it reinforces that dips like this are being bought by giants.
The candle doesn’t lie but neither does the macro narrative when they both point in the same direction.
Mindset Tip: Ride Logic, Not Emotion
This setup teaches us something important:
You don’t have to catch every move. You just need to understand why it moved — and position accordingly.
If it pulls back, don’t panic. Let the market invite you, not rush you.

BTC/USDT Bullish Reversal Zone AnalysisSupport Zone:
The horizontal purple box (~104,000 USDT area) has acted as a strong support/resistance flip zone multiple times.
Falling Wedge Breakout:
The price action broke out of a falling wedge pattern earlier, confirming bullish momentum.
Flag Formation (Current):
A smaller bullish flag/pennant appears to be forming, and a breakout above could trigger a strong upward move.
Projected Move:
The black arrow indicates a potential bounce from this support zone, with the price targeting the 111,000–112,000 USDT zone (highlighted in the top purple box).
Volume Spike:
Notable volume spike near the bottom supports the idea of accumulation and possible reversal.
📈 Conclusion:
If the support zone holds and price breaks above the minor flag, a bullish continuation is likely toward the 111,000–112,000 resistance area. Traders should watch for confirmation of a breakout and volume increase for validation.

"Bearish Reversal Opportunity Following Supply Zone Rejection"1. Double Top Formation (Resistance Level Identified)
The chart displays a clear double top structure at the 2,760–2,800 USDT level.
This level has acted as a strong supply zone (highlighted in red), where price previously reversed, indicating heavy selling interest.
Current price action has retested this resistance zone and shown signs of rejection.
2. Liquidity Sweeps & False Breakouts
On the left side of the chart, an aggressive downward wick (marked with a blue arrow) suggests a liquidity sweep below a key low before strong bullish momentum returned.
This type of price action indicates smart money involvement, designed to remove weak hands before pushing price higher.
3. Accumulation Phases (Sideways Consolidation)
Multiple accumulation ranges are highlighted with blue rectangles.
These ranges show horizontal consolidation, where price builds up energy before breakout.
The most recent breakout led to a vertical rally toward the resistance zone, signaling an end of the accumulation and a start of distribution.
4. Double Bottom Support Structure
Identified near the 2,480 level, marked by red circles.
This level has historically acted as demand/support, evidenced by multiple bounces from this price zone.
Now highlighted with a grey zone, it is projected to act as the next key support area.
5. Bearish Projection
A large black arrow suggests a forecasted bearish move from the current high (~2,800) back to the support zone (~2,480).
This aligns with the idea of a mean reversion or pullback after a strong bullish impulse.
---
Conclusion & Trade Idea:
🔻 Bias: Bearish (Short-term)
The chart presents a classic reversal pattern with a double top at a well-defined supply zone.
Entry could be considered after confirmation of rejection from this level.
🧠 Trade Plan Suggestion:
Entry: Short near 2,780–2,800 after bearish confirmation (e.g., bearish engulfing candle or break of structure).
Target: 2,480 (support zone).
Stop Loss: Above 2,820 (recent high).
Risk-Reward: Approximately 1:2.5 or better depending on execution.
