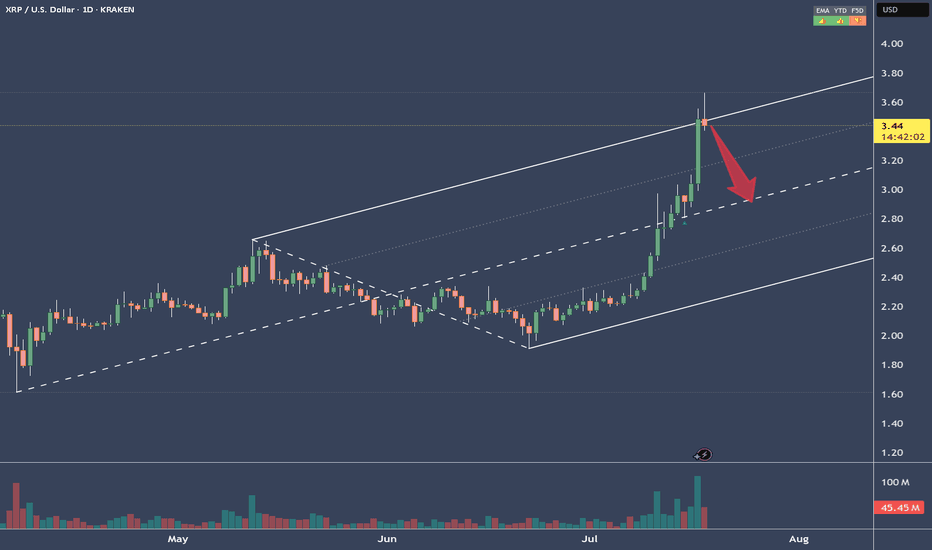
XRPUSD - Target reached. Reversal on the plateSo, that was a nice long trade.
Now price is stretched at the Upper Medianline Parallel (U-MLH).
As of the time of writing, I already see price pulling back into the Fork. A open and close within the Fork would indicate a potential push to the south.
Target would be the Centerline, as it is the level where natural Meanreversion is.
Observation Hat ON! §8-)
Cryptoshort
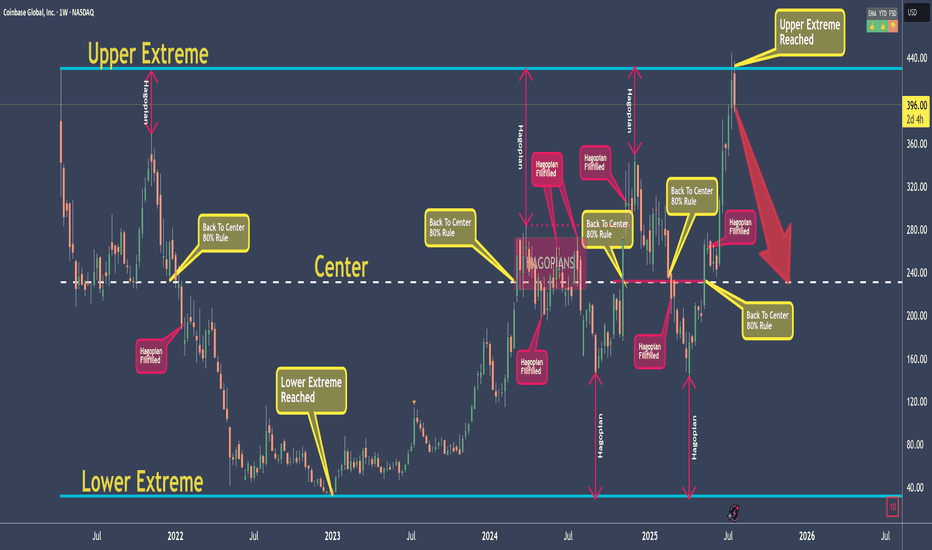
COINBASE - My rules say: Down with high probabilityI don't elaborate too much here, because I want to give you a chance to learn something!
As for the Trade, my rules say that it is a good Short.
The Short is not valid anymore, if price open and close above the Upper Extreme!
So, what are the rules?
Well, that's exactly what you will learn today ;-)
Go to my previous post which I will link, and you find everything you need to jump on the Steam-Train if you like.
As my old Mentors always said: "Larn To Earn"
Happy Profits Guys & Gals §8-)
Bitcoin’s Fake Pump Ends HERE! OB + FVG = Bearish Trap?📊 BTCUSD SMC Breakdown (3D Chart)
Price tapped into a High Probability Reversal Zone (OB + 61.8–79% Fib) with strong downward projection. This is a classic case of Smart Money selling into late bull euphoria. 👀
🧠 Smart Money Story:
Sell-side Liquidity Grab: Prior highs got swept—liquidity hunted 💧
Order Block (OB) + 61.8–79% Fib: This area is confluence-rich
Channel Top + Trendline Rejection = Extra confluence 🧱
Strong bearish reaction wick confirms Smart Money presence 🔥
Projection drawn toward 105,968 = -27% extension
📌 Key Technical Zones:
Zone Type Level / Range
Order Block : 108,267.68 (Purple Zone)
Premium Zone (OB + FVG) : 108,267 – 108,938
Entry Trigger : 108,251.52 (Current Price)
SL Zone (Invalidation) : Above 109,000
TP1 – TP2: 106,800 – 105,968 (TP2 = -27%)
🛠️ Trade Setup Idea (Short):
Sell Entry: 108,251 – 108,937
Stop Loss: 109,200
Take Profit 1: 106,800
Take Profit 2: 105,968
RRR: ~1:4 📉💰
#GNOUSDT remains weak after a strong drop📉 SHORT BYBIT:GNOUSDT.P from $181.40
🛡 Stop Loss: $186.50
⏱ 1H Timeframe
✅ Overview:
➡️ BYBIT:GNOUSDT.P experienced a sharp rally above $210, followed by an equally strong pullback.
➡️ The POC (Point of Control) at $187.27 indicates the highest liquidity area, which serves as a strong resistance level.
➡️ Price is consolidating below $183.12, signaling potential seller dominance.
➡️ If $178.55 breaks downward, further decline toward $175.30 is expected.
⚡ Plan:
➡️ Enter short upon a confirmed break below $181.50.
➡️ Stop-Loss placed at $186.50, above the resistance zone.
🎯 TP Targets:
💎 Take Profit1- 178.55
🔥 Take Profit2- 175.30
🚀 BYBIT:GNOUSDT.P remains weak after a strong drop—expect further downside.
#AIXBTUSDT continuation of the downtrend📉 SHORT BYBIT:AIXBTUSDT.P from $0.2255
🛡 Stop Loss: $0.2366
⏱ 1H Timeframe
✅ Overview:
➡️ BYBIT:AIXBTUSDT.P continues its downtrend, forming lower highs and lower lows.
➡️ The price has broken the $0.2290 liquidity zone and is holding below it, signaling weak buying pressure.
➡️ If sellers maintain control at $0.2255, a drop towards $0.2040 is likely.
➡️ POC at $0.2566 suggests the main volume accumulation is above the current price, reinforcing the bearish outlook.
➡️ High volume on recent candles indicates selling pressure, which could accelerate the downtrend.
⚡ Plan:
📉 Bearish Scenario:
➡️ Enter SHORT from $0.2255 if price confirms a breakdown.
➡️ Risk management with Stop-Loss at $0.2366, above key resistance.
🎯 TP Target:
💎 TP1: $0.2040 — strong support and profit-taking zone.
📢 BYBIT:AIXBTUSDT.P is in a bearish phase. If the price holds below $0.2255, further downside movement towards $0.2040 is expected.
📢 However, if the price reclaims $0.2366, the bearish scenario could be invalidated, leading to a potential bullish correction.
🚀 BYBIT:AIXBTUSDT.P Expecting a continuation of the downtrend!
BTC to fall from a rising wedge? SHORTBTCUSD on the 15-minute chart appears to have formed a rising wedge pattern which typically
forecasts a breakdown and a fall in price. Overlaid is the LuxAlgo predictive model-based
on a gaussian regression line ( top shelf mathematics) with a lookback to the left for similar
patterns on which to found the forecast. The algo indicator validates a bias for a fall in price.
I will take a partial on my long positions here and save the profits for a re-entry when a firm
uptrend is noted.
Wave of Crypto Supply Incoming? NEO EditionWelcome to RiskMastery's Red Flag Stocks - Stocks with bearish potential.
In this edition, we'll be looking at BINANCE:NEOUSDT ...
I believe this code is at a point of potential volatility.
If price can hold below $11.5100 ... Bearish potential may be unlocked.
My key downside targets include:
- $10.6428 (Conservative)
- $9.7200 (Medium)
- $6.7888 (Aggressive)
If however price breaks above $12.1784 ... Bullish potential may be unlocked.
(My key risk targets - C, M,& A - are as noted on the chart)
Enjoy, and I look forward to being of further service into the future.
If you'd like to connect, feel free to reach out and comment below.
Mr RM | Risk Mastery
Disclaimer:
This post is intended for educational purposes only - Publicly available RiskMastery information & content is not intended to be financial advice in any shape or form. Please do your own research and seek advice from a licensed professional before acting on any of the information contained within this post. This post is not a solicitation or recommendation to buy, sell or hold any positions in any financial instrument. All demonstrated trades are merely incidental to the educational training RiskMastery aims to provide. You are solely responsible for your own investment and trading decisions, of which should be made only according to your own opinion, knowledge and experience. You should not rely on any of the information contained on this site or contained in any RiskMastery material on any website or platform. You assume the sole risk of any trade or investment you elect to make. RiskMastery and affiliates shall not be liable to you for any monetary losses or any other damages incurred directly or indirectly, from your use, reliance or reference of RiskMastery materials, content and educational information. Thank you for your understanding and cooperation - We look forward to working with you into the future to navigate the fine line of trading and investment success.
Step'N Down with $GMTI have opened a short position on $GMT, this is a swing short positon. Much of GMT's tokens have been locked up, currently 83.79% of the token supply is locked and not in circulation. However, these tokens are subject to a linear unlock that began March 1st, 2023. The distribution is currently as follows:
My avg entry as of right now is $0.433. I am looking to slowly DCA into a short position on GMT to increase my position as the market gives opportunity.
UNLOCK DISTRIBUTION
3,387,097 GMTs
Private Sale 1,219,355 GMT/Day ($483,846)
Move and Earn 812,903 GMT/Day ($322,564)
Team 580,645 GMT/Day ($230,403)
Ecosystem/Treasury 580,645 GMT/Day ($230,403)
Advisors 193,548 GMT/Day ($76,801)
The private sale of GMT token was at $0.005 per token. I confirmed this with the Step'n team. That means investors who were in early in the project are currently up 7860%. My guesstimation is that they will begin to sell their tokens to capitalize on this incredible gain. This coupled with technical analysis and price action I think can set up a great short opportunity. Not to mention, each month the % unlocked increases dramatically. Over the next 7 years the tokens will continue to unlock≥
If GMT fails here at this breakout level of $0.4 I think we will accelerate back to $0.3. Failing this wedge to the downside as a fake breakout to the upside could play out.
UNFI : Short ideaUNFI broke below a key support area and is currently under bearish correction. A break below the red trendline will trigger further selloff and that will be a good shorting opportunity for UNFI


