DASHUSDT: Is a Big Move Brewing? Yello, Paradisers! Are we on the brink of a significant breakout or another leg down for DASH? Let’s dive into the chart and uncover what’s next for this coin. Stay sharp this analysis could save you from making the wrong move at the wrong time.
💎#DASHUSDT is currently approaching a key support level around $30.87, a zone that has consistently acted as a springboard for bullish momentum in the past. This level has been tested previously, showing signs of strength. However, if the support fails to hold, it could spark a cascade of selling pressure, potentially dragging the price down to the next lower demand at $25–$26.
💎Currently, the price is under the influence of a descending trendline, with repeated rejections clearly visible. This pattern has kept the bearish structure intact, making a breakout above this trendline a crucial signal for any shift in momentum.
💎A failure to hold the demand zone at $25–$26 could trigger a sharp move downward, leading to bullish invalidation with bearish targets around $16–$20. This would bring #DASH to an untested historical support level and possibly lead to a liquidation event, clearing out weak hands from the market.
💎The RSI, currently in a neutral range, will be critical to watch. A move above 50 on the RSI could support a bullish breakout, while a drop below 40 would reinforce bearish sentiment.
The market is at a tipping point, and taking action without confirmation at this stage could lead to unnecessary losses. Stay patient, disciplined, and wait for clear signals before taking action.
MyCryptoParadise
iFeel the success🌴
Cryptosignal

CHZUSDT: Bullish Breakout or Breakdown? Key Levels to Watch!Yello, Paradisers! Is CHZUSDT about to break out into a bullish rally, or will the support zone crumble and invalidate the setup? We’re at a critical decision point, and how price reacts at key levels will be crucial. Let’s break it down.
💎CHZUSDT has formed a W-pattern at a key support zone, which is a classic bullish reversal structure. This pattern increases the probability of an upward move, but it still requires confirmation. Without a proper breakout above resistance, the bullish setup remains incomplete.
💎To validate the W-pattern and increase the chances of bullish continuation, CHZUSDT needs to break through the resistance level and close a candle above it. A confirmed breakout at this level would signal strength from buyers and could lead to a significant upward move.
💎However, if the price pulls back instead of breaking out, there’s still hope for the bullish case. In the event of a retracement, we can expect a bounce from the strong support zone. But to increase the probability in our favor, it’s essential to watch for bullish signals on lower time frames. These include an Internal Change of Character (I-CHoCH) or familiar patterns like a smaller W-pattern or an inverse head and shoulders. Seeing any of these will reinforce the bullish outlook.
💎On the other hand, if the price breaks down and closes a candle below the strong support zone, the bullish idea becomes invalid. In that case, it’s better to step back and wait for cleaner price action to form before making any new decisions. It’s never a good idea to force a trade when the market is unclear.
Patience is key here. The market rewards those who wait for high-probability setups rather than chasing moves without confirmation. Discipline and a clear strategy will always keep you ahead.
MyCryptoParadise
iFeel the success🌴

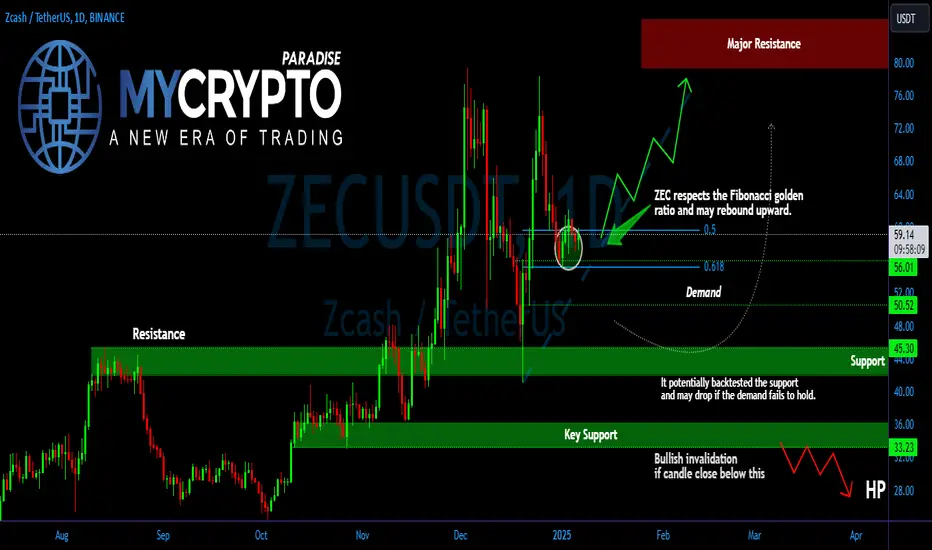
ZECUSDT: Is the Rebound Real, or Are We Heading Lower? Key LevelYello, Paradisers! Are we witnessing a genuine rebound for #ZECUSDT, or could this move be a trap before a deeper correction? Let’s take a closer look at what’s happening and the critical levels you should have on your radar.
💎#ZEC has shown respect for the golden ratio of the Fibonacci retracement, suggesting a potential bounce to the upside. However, the key question is whether the price can sustain above the crucial demand zone between $56 and $50.20. If ZEC holds this level, the upward momentum could continue, with the next target being a retest of the strong resistance area.
💎But what happens if ZEC fails to hold above this demand zone? In that case, the price could drop back to the $45.30 support area, a level that has historically triggered significant rebounds. This zone has acted as a strong base in the past, and it’s likely that any dip toward this level could see buyers stepping in once again.
💎The risk increases if ZEC breaks below this support and closes below $33.20. If this happens, we could see a much deeper correction, potentially pushing the price even lower. A candle close below this level would invalidate the bullish outlook and indicate further downside ahead.
Stay disciplined, Paradisers. Consistency in trading comes from managing risk and staying patient.
MyCryptoParadise
iFeel the success🌴
Is ARCUSDT Gearing Up for a Breakout?Yello, Paradisers! #ARCUSDT has been regaining strength after a corrective phase, showing promising signs of a rebound. Recently, the price formed a double bottom, a bullish pattern that often signals a trend reversal. Momentum is building as the price begins to break above this key structure, setting the stage for a critical test ahead.
💎The spotlight now is on a descending resistance at $0.04120, which has consistently capped #ARC’s upside potential. A breakout above this level could be the game-changer bulls are waiting for, paving the way for a bullish rally targeting $0.0510 to $0.0540. These levels align with moderate resistance zones and the double bottom's projected pattern target, where profit-taking might emerge.
💎If the bullish momentum remains strong, ARC could aim even higher, testing the next major resistance around $0.0630 to $0.0650. This range represents a robust supply zone that traders should keep on their radar.
💎On the downside, the neckline breakout level at $0.0370 to $0.03550 is a critical support zone. Any retest here is likely to attract significant buying interest, bolstered by the protective cushion of the EMA-200 and EMA-100. This confluence adds an extra layer of confidence for bulls preparing for the next move.
Patience and discipline are key here, Paradisers. The market often tests both bulls and bears before making decisive moves, so stay vigilant.
MyCryptoParadise
iFeel the success🌴

Solana’s Big Moment: Will the Ascending Triangle Ignite a Rally?Yello, Paradisers! #Solana is gearing up for action as it charges inside an ascending triangle pattern, inching closer to the critical neckline resistance. If bulls can deliver a convincing breakout here, a trending move could be on the cards, setting the stage for a significant rally.
💎For #SOLUSDT the first test lies at the $197–$198.50 range, a moderate resistance zone that has effectively capped its price since December 19th. A breakout above this level, supported by strong volumes, could signal the start of a trending move, initially pushing the price toward the $210–$212 zone, where some profit-taking is likely to occur.
💎If bullish momentum remains strong beyond this point, Solana could set its sights on the next major resistance at $220–$225.50. This key level has the potential to define the next phase of its upward movement and will be critical for assessing whether the bulls can sustain the rally.
💎On the downside, Solana is supported by the ascending trendline in the $188–$186 range, with additional horizontal support at $186–$183.80. As long as these levels hold, the bulls remain in a strong position to keep the momentum alive.
Paradisers, stay sharp—Solana is at a critical turning point, and the next few moves could be decisive!
MyCryptoParadise
iFeel the success🌴

Will EOS/USDT Explode or Collapse? Yello Paradisers, is #EOSUSDT gearing up for a breakout, or are we about to see a sharp decline? The current chart structure points to a make-or-break moment, and understanding these key levels is crucial for navigating what’s next.
💎#EOSUSD is currently testing a critical resistance level at $0.9627. A decisive breakout above this region could signal a significant shift in momentum, with the next targets around $1.30 to $1.60. These levels correspond to previous highs and represent a psychological barrier where profit-taking is likely. If buyers successfully push past this zone, it could ignite a bullish rally with considerable upside potential.
💎However, the resistance at $0.9627 remains strong, and failure to break above it could result in a pullback. Below the current price lies the demand zone at $0.8285, which serves as a crucial support for bulls. A bounce from this area could indicate the continuation of the broader accumulation phase and present a favorable opportunity for buyers.
💎If the $0.8285 demand zone fails to hold, the next significant support levels are found around $0.7114 to $0.6693. A strong rebound from these levels, accompanied by increased volume, could set the stage for a recovery targeting higher resistance levels. Conversely, a breakdown below this zone would confirm bearish dominance and pave the way for further declines.
💎Volume is the critical factor to watch here. Any breakout above $0.9627must be supported by robust trading volume to confirm its legitimacy. Similarly, low-volume moves in either direction should be approached with caution, as they are often fakeouts.
#EOSUSDT is at a crossroads, and its next move will likely define the near-term trend. A break above resistance could trigger a bullish rally, while failure to hold key support zones might lead to deeper corrections. This is not the time for impulsive decisions. Stay patient, disciplined, and wait for clear signals before taking action.
MyCryptoParadise
iFeel the success🌴

ROSEUSDT on the Verge of a Breakout or Breakdown?Yello, Paradisers! Are you watching ROSEUSDT closely? If not, you might want to pay attention because this setup is reaching a critical point that could make or break its next move. Let's dive into the key levels and scenarios we're monitoring to stay one step ahead of the crowd.
💎ROSEUSDT is attempting to form a W pattern from a key support zone. If this pattern fully materializes and we see a breakout with a confirmed candle close above the resistance, the probability of a bullish continuation will increase significantly. This move could open the door to higher price levels.
💎However, it’s essential to wait for confirmation—the breakout must be backed by a solid close above the resistance level to validate the W pattern. No premature entries, Paradisers! Discipline is key.
💎If the price pulls back before breaking out, there’s a high chance of a bounce from the strong support zone. But to increase the odds in our favor, we need to see signs of bullish intent, such as a bullish I-ChoCH (Internal Change of Character) or familiar bullish reversal patterns like the W pattern or inverse head and shoulders on lower timeframes.
💎Keep in mind—it's not just about the support holding, but also about how the price reacts at these levels. Strong bullish reactions give us more confidence to enter trades.
💎On the flip side, if ROSEUSDT breaks down and closes a candle below the key support zone, it will invalidate our bullish idea entirely. In that case, it’s better to remain patient and wait for new, more favorable price action to form before taking any positions.
💎Patience and discipline are what separate successful traders from the rest. We wait for high-probability setups with clear confirmations. No rushing into trades without a validated breakout!
Trade smart, Paradisers. Stick to your strategy, and remember—the market rewards the most disciplined players.
MyCryptoParadise
iFeel the success🌴

SUI Roadmap==>>Short-term!!!First, let's take a look at the previous BINANCE:SUIUSDT Roadmap that I shared with you on October 8, 2024 , which was well done with this analysis (I told you both the correction and the increase).
The SUI token has experienced significant growth in the past 24 hours , driven by several key factors :
1- Expansion of the DeFi Ecosystem : The Sui Network has experienced a significant increase in Total Value Locked (TVL), signaling growing adoption and investor confidence.
2- Rising Open Interest : A noticeable increase in open interest indicates higher liquidity and greater participation from traders, further driving price appreciation.
3- Increase in Daily Active Addresses : The number of active addresses on the Sui network has grown, reflecting heightened user engagement and network activity.
4- Haedal Protocol Secures Seed Funding : Haedal Protocol, focused on liquid staking solutions for Sui, closed a successful seed funding round with major investors like Hashed and the Sui Foundation. Its haSUI ( PYTH:HASUIUSD ) token enables users to earn staking rewards while maintaining liquidity for DeFi activities, contributing to Sui's ecosystem growth with over $200M in TVL.
----------------------------------------------
Now let's look at the SUI token chart on the 1-hour time frame and see if we still have a chance to profit from the increase in SUI!?
SUI managed to break the Resistance zone($5.00-$4.76) and seems to be completing the pullback now .
According to the theory of Elliott waves , SUI seems to be completing microwave 4 of microwave 3 of the main wave 5 .
I expect SUI to start increasing again after the pullback is completed, and we can profit at least +10% from the SUI token .
⚠️Note: If SUI falls below the Resistance zone($5.00-$4.76), we should expect it to fall further.⚠️
🙏Please respect each other's ideas and express them politely if you agree or disagree.🙏
Sui Analyze (SUIUSDT),1-hour time frame⏰.
🔔Be sure to follow the updated ideas.🔔
Do not forget to put Stop loss for your positions (For every position you want to open).
Please follow your strategy and updates; this is just my Idea, and I will gladly see your ideas in this post.
Please do not forget the ✅' like '✅ button 🙏😊 & Share it with your friends; thanks, and Trade safe.

GALA Bulls Must Watch This Level—A Major Move Is Coming!Yello, Paradisers! Have you been watching #GALA’s explosive move? The recent breakout from the ascending triangle pattern is sending a clear message—momentum is heating up fast, and the next pivotal level is right around the corner. But will GALA stop at just being bullish, or are we about to see it shift into hyper-bullish territory? Let’s dive in!
💎#GALAUSDT is now heading straight for a critical descending resistance zone around $0.04600. This is the level to watch! A breakout above $0.04600 would trigger a breakout after breakout setup—something that often signals major bullish strength ahead. If the bulls can smash through this level, it’s a game-changer.
💎GALA will likely be targeting $0.054 to $0.056 after clearing the resistance. But if the momentum stays intact, expect GALA to make a run higher for $0.06660, where we see the next big cluster of profit-taking. The $0.06660 to $0.07000 zone is where traders should be cautious, as this level historically brings out sellers.
💎Not only has GALA broken above its pattern, but it’s also reclaimed a major structural level between $0.0395 and $0.0410—a key zone that has acted as both support and resistance in the past. With price now holding above this level, bulls have established a solid base to build on. Below this, we see a layer of ascending and horizontal support, giving GALA strong protection on the downside.
Paradisers, this setup is looking very promising—but don’t forget, discipline and patience are key in this market.
MyCryptoParadise
iFeel the success🌴

Is ARB Poised for a Major Move? Here’s What You Need to WatchYello, Paradisers! Are you ready for a potential game-changing move in #ARBUSDT? The current setup hints at a decisive moment that could lead to either a breakout or a steep decline. Let’s dive into the details to see what’s unfolding.
💎#ARBUSDT is currently sitting between two critical levels. On the upside, the $0.8400 minor resistance is a key threshold that buyers need to breach to regain momentum. A successful break above this level could open the door to $1.00 and eventually test the major resistance zone at $1.2389–$1.2949. This area represents a psychological and technical barrier likely to attract significant profit taking. Overcoming it, however, could trigger an explosive rally as bullish sentiment takes hold.
💎On the downside, the support zone at $0.6515 is acting as a safety net for now. If this level fails, #Arbitrum could descend into the demand zone at $0.5685. A decisive bounce from here, coupled with increased volume, could signal the start of a rally targeting resistance levels and beyond. Conversely, a failure to hold this zone would confirm a bearish breakdown, inviting further downside movement.
💎The battle between bulls and bears hinges on how #ARB reacts to these critical levels. If buying volume increases near $0.8400 and #ARBUSD clears it with strength, the momentum shift could drive prices higher toward the $1.2389 region. Conversely, any rejection at $0.8400 or weakness near $0.6515 would signal that sellers are still in control, increasing the likelihood of a breakdown.
Keep an eye on trading volume, as it will confirm the strength of any breakout or breakdown. Low volume moves are often fakeouts, so stay cautious and wait for clear signals before entering a trade.
MyCryptoParadise
iFeel the success🌴

Is GALAUSDT Setting Up for a Bullish Breakout?Yello, Paradisers! Are we on the brink of a major bullish move for GALAUSDT, or is more downside on the horizon? Let’s dive into the latest analysis to help you prepare for what’s coming.
💎GALAUSDT has been consolidating in a descending channel, signaling a healthy retracement. This structure increases the probability of a bullish reversal—if key conditions are met.
💎If the price triggers an inducement and begins forming bullish patterns—such as a bullish I-CHoCH, W pattern, or inverse head-and-shoulders—at the key support zone, the likelihood of a strong upward move will significantly increase.
💎In the case of deeper retracement, we’ll look for a bounce off the strong support zone. However, confirmation is key. Keep an eye on patterns like the bullish I-CHoCH, W formation, or inverse head-and-shoulders to validate the bullish case.
💎If GALAUSDT breaks down and closes a candle below the strong support zone, the bullish outlook will be invalidated. In this scenario, patience will be critical—it’s better to wait for more favorable price action to form before making a move.
💎Discipline and risk management are essential in navigating markets like this. Remember, Paradisers, trading isn’t about predicting—it’s about reacting smartly to what the market shows us.
🎖Play it smart, stay patient, and wait for the best opportunities. Success in crypto is a long game, not a quick sprint! Stay disciplined, and you’ll already be ahead of the majority.
MyCryptoParadise
iFeel the success🌴

ZILUSDT: Will Zilliqa Explode or Collapse from Here? Yello, Paradisers! #ZILUSDT is sitting at a crucial inflection point. The market is testing a strong support zone that could either trigger a significant rally or lead to a steep drop. Are we about to witness a breakout or a breakdown? Let’s dive into the details.
💎#Zilliqa is currently approaching a key support level around $0.01788, a zone that has consistently acted as a springboard for bullish momentum in the past. This level has been tested previously, showing signs of strength. However, if the support fails to hold, it could spark a cascade of selling pressure, potentially dragging the price down to the next lower Demand at $0.01600.
💎For now, all eyes should remain on the current support zone at $0.01788. A decisive bounce from here, coupled with increased volume, could signal the start of a rally targeting resistance levels and beyond. Conversely, a failure to hold this zone would confirm a bearish breakdown, inviting further downside movement.
💎The RSI is hovering near oversold levels but hasn’t yet shown a clear signal for a reversal, leaving ZIL in a precarious position. This is a critical juncture, Paradisers. The next move could set the tone for #ZILUSDT in the coming weeks. Whether the market breaks out or collapses, remember to wait for confirmation before taking action.
Discipline and patience are the foundation of successful trading. Focus on preserving capital and only act on high-probability setups.
MyCryptoParadise
iFeel the success🌴

Is SUIUSDT on the Brink of a Major Breakout?Yello, Paradisers! #SUIUSDT has been showing remarkable strength, steadily climbing within an ascending channel and gaining momentum from its ascending support. Adding to the bullish narrative, the price is forming an inverse head-and-shoulders pattern—a powerful indicator suggesting the potential for a continuation to higher levels.
💎However, a significant challenge lies ahead. #SUI faces a major resistance zone between $4.80 and $5.00—a critical level that has repeatedly acted as a barrier, preventing the price from breaking higher. Notably, this range also aligns with the neckline of the pattern, making it a pivotal breakout area.
💎A successful breakout, accompanied by strong trading volume, could spark a bullish surge targeting the $5.45–$5.70 range, where the 1.618 Fibonacci extension resides. This area might prompt partial profit-taking as traders capitalize on the move. However, if momentum continues to remain strong, SUI could soar even higher, reaching the next significant resistance levels around $6.50–$6.80, fulfilling the pattern's target.
💎On the downside, SUI is well-supported. Initial support is seen at the $4.00–$3.90 zone, with additional strong support at the ascending trendline near $3.65—a level that has held firm for over 45 days, reinforcing its significance.
Patience and discipline are key here, Paradisers. The market often tests both bulls and bears before making decisive moves, so stay vigilant.
MyCryptoParadise
iFeel the success🌴

ATAUSDT: Will the Bulls Hold the Line, or Are We Heading Lower?Yello, Paradisers! #ATAUSDT is at a pivotal moment, and the next move could define the trend for days to come. After a sharp breakout, ATA has pulled back toward a critical demand zone. Will buyers step in to defend this level, or are we about to see another leg down?
💎The supply zone at $0.1844 has proven to be a major hurdle, as sellers overwhelmed the bullish momentum after the recent breakout. This zone has become a key resistance level, and breaking above it is essential for the continuation of an uptrend. On the other hand, the demand zone at $0.1337 is where buyers need to make a stand. A failure to hold this level would likely send #ATA tumbling down toward the next significant lower demand at $0.1038.
💎Currently, the 100 EMA is providing dynamic support. If the price respects this level, it could signal the beginning of a recovery. A bounce here could trigger renewed bullish momentum, while a breakdown would confirm bearish control.
💎Paradisers should remain cautious and wait for clear signals before taking action. A strong bounce at the demand zone with high volume would be a good indicator of renewed buyer interest, while a breakdown below $0.1038 would likely open the door to much lower levels.
Stay disciplined and patient, and remember to always wait for confirmation before entering a trade. Protect your capital, stay focused, and trade like a pro! Share your thoughts in the comments what’s your move for #ATA?
MyCryptoParadise
iFeel the success🌴

ENS Price Action: Rebound Imminent or Bearish Freefall?Yello, Paradisers! Is #ENSUSDT gearing up for a significant rally, or are we looking at a bearish breakdown? Let’s take a closer look at what the charts are telling us.
💎#ENS seems poised to retest its support level before potentially continuing its upward movement. A breakout above the minor resistance could spark a strong rally, with the price likely heading toward the next key target at the strong resistance area.
💎However, there’s a risk to watch out for. If ENS fails to rebound and breaks below the support zone, the price could head lower, potentially hitting the bullish order block or demand area. This region is crucial for maintaining a bullish structure. If ENS manages to reclaim support around the $32 mark, there’s a good chance of a rebound and resumption of the upward move.
💎On the flip side, if the daily candle closes below this area, it would signal a bearish invalidation. In that case, we could see a deeper dip, with ENS entering a completely bearish phase and continuing its downward trajectory.
Stay disciplined, trade smart, and let’s navigate this market with a professional mindset!
MyCryptoParadise
iFeel the success🌴

Could LIT Be Preparing for a Massive Move? Key Levels to Watch Yello, traders! Have you noticed the subtle clues #LITUSDT is dropping about its next potential breakout or breakdown? This chart is screaming opportunity, but the question is: are you ready to capitalize? Let’s break it down.
💎#LITUSDT is approaching minor resistance at $1.00. This level has proven to be a significant barrier for LIT, as repeated attempts to push higher have been met with rejection in the past. This level is currently dictating whether bulls can take control or if sellers will continue dominating the market. Just below this, the $0.834 support zone has provided a critical safety net for the price. Buyers have consistently stepped in to defend this level, making it a key point to monitor for any potential breakdown.
💎If the price breaks through the $1.00 minor resistance, the next stop to watch is the resistance area around $1.254. This region could serve as a temporary pause before the price advances toward the major resistance zone near $1.475. A breakout above these levels could ignite strong bullish momentum, especially if accompanied by rising volume.
💎However, failure to hold the $0.834 support zone would signal weakness, possibly triggering a sharp sell-off. This would likely push #LITUSDT lower toward the broader demand area below, leaving bulls in a precarious position. The next few days will be crucial as the market decides its direction.
Remember, Paradisers, the market rewards those who think strategically and trade with precision. Stay focused, stay disciplined, and let’s make the next move count! Where do you think #LITUSDT is heading? Share your thoughts below!
MyCryptoParadise
iFeel the success🌴

ARKUSDT: Is the Bullish Momentum on Thin Ice? Yello, Paradisers! #ARKUSDT is making waves again, but is it gearing up for a major breakout, or are we on the brink of a deeper correction? Let’s dive into the details to prepare for what’s next.
💎#ARK has shown a strong rebound from the support zone, signaling a potential continuation of its bullish movement. However, for ARK to confirm a bullish structure, it must break above the minor resistance at $0.671. If this breakout happens, ARK could rally toward the major resistance zone, marking a successful upward trajectory.
💎But what if ARK fails to break this resistance? Even if the price climbs to test the $0.671 level, a rejection could lead to a retest of the support area between $0.44 and $0.40. Historically, this zone has been respected multiple times, with the price consistently rebounding.
💎The critical risk emerges if ARK fails to rebound and breaks below the support area. A breakdown here would signal the loss of the higher low (HL) structure, likely turning the price bearish. In this scenario, ARK could continue its decline toward the major support zone at $0.30–$0.26. As long as ARK remains above this range, there’s still potential for a rebound.
💎However, if ARK’s daily candle closes below $0.26, the bullish case becomes invalidated. This would confirm a bearish trend, with the price likely to continue dipping further.
Stay focused and disciplined, Paradisers. Analyze the levels carefully, and always wait for confirmation. 🎖
MyCryptoParadise
iFeel the success🌴

Is DOTUSDT Preparing for a Reversal?Yello, Paradisers! DOTUSDT has been moving within a descending channel, presenting a textbook retracement pattern. Now, all eyes are on the crucial support zone, which could be the key turning point for the next move.
💎If DOTUSDT reaches this support zone and forms bullish patterns like a bullish I-CHoCH (Internal Change of Character), a W-pattern, or even an inverse head and shoulders, the probabilities for a bounce significantly increase. This could signal a potential bullish reversal from this critical area.
💎However, in the case of panic selling or deeper retracement, we may see a bounce from the strong support zone below. But remember, confirmation is key—bullish patterns in these zones will strengthen the case for a reversal.
💎If DOTUSDT breaks below the strong support zone and closes a candle there, this would invalidate the bullish setup. In such a scenario, waiting for new price action to develop is the smarter, safer move.
Staying patient and disciplined is essential here. Trade strategically, avoid impulsive moves, and let the market show its hand before jumping in. Remember, the best trades come to those who wait for the highest probability setups.
MyCryptoParadise
iFeel the success🌴

AVAX Teetering on the Edge: Will It Soar or Plunge into Chaos?Yello, Paradisers! Are we on the verge of witnessing AVAX’s next big breakout, or is a devastating collapse brewing? The chart is screaming volatility, and this is where disciplined traders either thrive or fall behind. Let’s dive into the analysis.
💎#AVAXUSDT is approaching a key demand zone, raising the high probability of bullish continuation from $32.90–$34.98. This zone is currently holding as a vital barrier for the bulls. If this level continues to act as a floor, we could see a reversal back toward $45–$54, where significant resistance awaits. A clean breakout above this resistance could spark a bullish rally, with the next targets around $59 and beyond. However, without strong buying pressure, the upward momentum may stall.
💎If the bulls manage to defend this demand zone $32.90–$34.98 with conviction, we could see a rapid upward rally, pushing prices higher. However, if #AVALANCHE fails to hold this demand zone, the lower support zone at $29.30–$30.21 will come into play. Breaking below this support would confirm a bearish breakdown, potentially dragging #AVAX down to $25 or even $20 in an accelerated sell-off.
💎Patience is key here, Paradisers. This setup could result in massive gains for those who wait for confirmation rather than jumping in prematurely. Emotional trading in moments like these often leads to losses, so stick to your plan, manage your risk, and let the market come to you.
Play it like a pro, and let patience be your edge. The market rewards the strategic, not the impulsive.
MyCryptoParadise
iFeel the success🌴

KDAUSDT: Will the Bulls Hold the Line, or Are We Headed Lower? Yello, Paradisers! Are we about to see a strong bounce or a deeper drop for Kadena (KDA)? The chart is heating up, and it’s time to pay close attention to these critical levels as we approach a make-or-break moment.
💎#KDAUSDT is raising the high probability of bullish continuation from the key support zone at $0.9342–$1.0102, which is currently holding as a vital barrier for the bulls. If this level continues to act as a floor, we could see a reversal back toward $1.2951–$1.4623, where significant resistance awaits. A clean breakout above this resistance could spark a bullish rally, with the next targets around $1.50 and $1.80. However, without strong buying pressure, the upward momentum may stall.
💎On the downside, if the $0.9342 support fails, the demand zone at $0.6569–$0.7518 will come into play. This area has historically attracted buyers and could act as a temporary safety net. Still, a sustained breakdown below this zone would expose KDA to deeper losses, with the potential to drop to $0.50 or lower.
💎The RSI is neutral but leaning toward oversold territory, which may suggest a potential bounce. Meanwhile, the MACD is signaling weak momentum but could flip bullish if the price holds or climbs above $0.9342.
💎This is a decisive moment for KDA. Whether it’s a bounce or a breakdown, volatility is expected in the coming days. Stay patient and disciplined, waiting for clear confirmation before making your move.
Stay focused and trade smart!
MyCryptoParadise
iFeel the success🌴

Could ARBUSDT Be Gearing Up for a Breakout?Yello, Paradisers! ARBUSDT is showing good signs of bullish momentum as it completes a proper retracement with descending channel and begins forming a W-pattern near the key support zone. This classic pattern is a strong signal that the odds of an upward move are increasing.
💎However, to confirm this bullish scenario, ARBUSDT needs to break out above the resistance level following the completion of this W-pattern. Until then, there’s potential for consolidation or even another retracement. This is why waiting for a clean breakout is critical to avoid premature entries.
💎In the event of panic selling, the strong support zone could act as a bounce-back level. To increase confidence in this scenario, we’ll need to see a bullish I-CHoCH (Internal Change of Character) on lower timeframes. Additionally, ARB’s strong fundamentals add weight to the probability of a recovery from support.
💎On the flip side, if ARBUSDT breaks down and closes candle below the support zone, this would invalidate the bullish setup entirely. In this case, it’s prudent to stay patient and wait for a better price action structure to form before taking any positions.
Trade smart, Paradisers, and remember—discipline, patience, and a solid strategy are your greatest tools in navigating the market successfully!
MyCryptoParadise
iFeel the success🌴

Bitcoin - Weekly Forecast - Technical Analysis & Trading IdeasMidterm forecast: (Daily TF)
73777.00 is a major support, while this level is not broken, the Midterm wave will be uptrend.
A trough is formed in daily chart at 92424 on 12/23/2024, so more gains to resistance(s) 99607, 102700, 108293 and more heights is expected.
Trading suggestion:
There is possibility of temporary retracement to suggested Trend Hunter Buy Zone (94200 to 92231). We wait during the retracement, until the price tests the zone, whether approaching, touching or entering the zone.
We would set buy orders based on Daily-Trading-Opportunities and expect to reach short-term targets.
Beginning of entry zone (94200)
Ending of entry zone (92231)
Take Profits:
99607
102700
108293
110000
115000
118281
120000
125000
130000
134468
__________________________________________________________________
❤️ If you find this helpful and want more FREE forecasts in TradingView,
. . . . . Please show your support back,
. . . . . . . . Hit the 👍 BOOST button,
. . . . . . . . . . . Drop some feedback below in the comment!
🙏 Your Support is appreciated!
Now, It's your turn!
Be sure to leave a comment; let us know how you see this opportunity and forecast.
Have a successful week,
ForecastCity Support Team

Key Moment for RLC: Breakout Opportunity or Bearish Threat?Yello, Paradisers! Is #RLCUSDT setting up for a powerful bullish continuation, or are we facing a bearish rejection? Let’s dive into the key levels you need to watch right now.
💎#RLC has made a strong rebound off its support, showing promising signs of strength. A successful breakout from the falling wedge pattern could confirm a bullish continuation. For this, we need a daily close above the trendline to validate the breakout. If this happens, the next target would likely be the minor resistance at $2.67. This level is crucial because a breakout here could lead to the highest probability of reaching the major resistance level.
💎If RLC fails to break the falling wedge and faces rejection with bearish candles, the price might drop back to retest the support zone around $1.87–$1.72.
💎The real concern arises if RLC fails to rebound from this support and breaks below it. In this case, the price would likely continue its downward trajectory toward the strong support at $1.30.
💎The $1.30 level represents the last line of defense for the bullish scenario. A rebound from here, followed by a reclaim of the $1.87 support, is necessary to reignite bullish momentum.
💎However, if RLC breaks below the major support at $1.30 and a daily candle closes under this level, it would confirm a bearish trend, with the potential for further downside and deeper dips.
Strive for consistency, Paradisers, and trade smart. This market rewards the disciplined and punishes the impulsive. Let’s stay focused and make the best decisions possible.
MyCryptoParadise
iFeel the success🌴
