AVAX-USDT | 4H | TECHNICAL CHARTHello traders, AVAX has completed its first 5 waves, and now it's time for the completion of the ABC wave. Right after the completion of wave C, I combined harmonic patterns and made an analysis of both. I marked my target with yellow arrows on the chart after the completion of the harmonic pattern.
If you want me to keep my analysis up to date, please don't forget to like this post.
Thank you for considering my analysis and perspective.
Cryptosignal

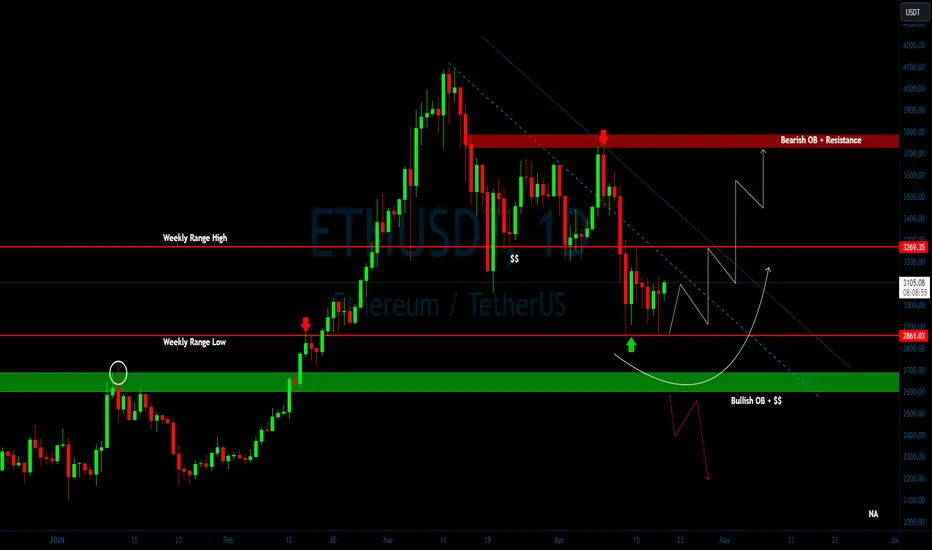
ETH/USDT presenting wonderful scenario? What Next👀💎 Paradisers, let’s explore the captivating movement of #ETHUSDT currently, it is raises probability of bullish continuation from the weekly low range at $2860.84. Although the price is trading above this range, this level remains crucial due to the presence of sound liquidity.
💎 Another intriguing scenario to consider is if #ETHEREUM fails to break the weekly low and drops below it. In such a case, our point of interest shifts to the lower bullish order block (OB) at $2606. There exists a high probability that the price will sustain momentum at this level and embark on a bullish move, potentially mitigating the impact of the bearish order block.
💎 Caution is advised, as CRYPTOCAP:ETH falling below this OB level could signal a shift toward a bearish trajectory. Stay vigilant and adapt to market movements! As always, remember to employ prudent trading strategies and implement proper stop-loss measures! Stay alert, monitor market movements, and eagerly anticipate further insights
MyCryptoParadise
iFeel the success🌴
THETA/USDT should price hold momentum at OB? 🚀Theta Analysis💎 Paradisers, let’s explore the captivating movement of #THETAUSDT. Currently, it is assessing a bullish order block (OB) level—a zone of immense significance due to its juicy liquidity.
💎 Our observations reveal that #THETA dutifully adheres to a descending channel trajectory, respecting channel resistance on two occasions. Now, if the price successfully maintains momentum at the bullish OB level of $1.787, there exists a compelling probability that it will target levels above the major resistance.
💎 However, my friends, the markets are ever-changing. Should the price of MYX:THETA dip below this pivotal OB zone, our strategy must swiftly adapt. Brace yourselves! We anticipate a bullish rebound from the lower support level at $1.451. Failure to reclaim ground here could potentially lead to further declines. Stay vigilant, stay nimble, and let’s navigate these market fluctuations with grace and precision.
MyCryptoParadise
iFeel the success🌴

JST/USDT preparing for bullish horizon? 🚀JST Today Analysis💎 Paradisers, prepare for an exciting trading chance with #JSTUSDT! It's currently catching eyes by maintaining its ground at the crucial demand level of $0.03850. This firm stance hints at a possible bullish trend, especially considering how past dips below this point have reinforced a bullish outlook.
💎 If AMEX:JUST struggles to keep up the momentum at this demand level, it might signal a need to reassess and prepare for a potential drop below its current support. In that case, we're looking at a bullish recovery from the next line of support at $0.03624.
💎 Be mindful: slipping below this additional support level could indicate a move towards a clearer bearish phase, with increased selling activity. Remaining alert and ready to adapt is key as we navigate the unfolding dynamics of the #JST market.

RNDR/USDT showing a bounce, potential will back to upward!💎 Paradisers, the recent market dynamics surrounding #RNDR have indeed been noteworthy.
💎 Currently, RNDR is rebounding from the Bullish OB area, indicating a positive sentiment in the market. There's potential for RNDR to test the resistance trendline of the falling wedge pattern.
💎 If RNDR successfully breaks above this pattern, it could signify a continuation of the upward movement, potentially reaching our target Bearish OB area.
💎 However, if RNDR fails to break out of the falling wedge pattern and faces rejection at the resistance trendline, there's a possibility of a downward movement, revisiting the Bullish OB to establish new momentum.
💎 RNDR must bounce back from the Bullish OB area. A breakdown below this level could indicate further downside potential, potentially leading RNDR towards the support area or even lower levels.
MyCryptoParadise
iFeel the success🌴

CKB/USDT in the support area, possible to bounce and back upward💎 Paradisers, the recent market dynamics surrounding #CKB have indeed been noteworthy.
💎 Currently, CKB is hovering around the support zone area, and based on the candlestick patterns, there's potential for a bounce.
💎 If this bounce materializes, CKB could retest the resistance around the 0.0255 area. A successful breakout above this level could propel CKB towards our target strong resistance area.
💎 However, if CKB fails to bounce and breaks down below the support area, it could signal a bearish trend reversal, potentially leading the price to move downward towards the Bullish OB area.
💎 In the Bullish OB area, CKB must bounce back and reclaim the price above the support to maintain its upward momentum towards our target. Failure to do so, with a breakdown below the OB area, could lead to further downward movement.
MyCryptoParadise
iFeel the success🌴

TIA/USDT is it required break the resistance for continue up!💎 Paradisers, the recent market dynamics surrounding #TIA have indeed been noteworthy.
💎 TIA is currently facing resistance, and a successful breakout above this level could confirm a bullish trend reversal, potentially leading TIA to back-test the strong resistance area.
💎 However, if TIA fails to break out and experiences rejection at the resistance, it may indicate a reversal to the downside, with the price potentially returning to the weekly OB area to establish new momentum.
💎 The weekly OB area is a critical level for TIA, and if the price remains within this zone, it presents a good buying opportunity as there's potential for a bounce back to the upside. However, if TIA breaches the weekly OB area, it could signal further downward movement.
MyCryptoParadise
iFeel the success🌴

HOOK/USDT shows bouncing from support and back to upward!💎 Paradisers, the recent market dynamics surrounding #HOOK have indeed been noteworthy. Currently, HOOK is bouncing from the support trendline, which aligns with historical patterns where the price has consistently bounced from this level.
💎 If this bounce proves to be valid, there's potential for the price to resume its upward trajectory, especially if it successfully breaks out above the resistance area at $1.22. The next target movement could be towards our strong resistance area.
💎 However, if HOOK fails to break out above the $1.22 resistance level and faces rejection there, it could signal a potential downward movement back towards the support trendline to establish a new momentum.
💎 A concerning scenario would be if HOOK breaks down below the support trendline, leading it to test the support area in the range of $0.7 to $0.64.
💎 In such a case, the price must bounce from this support level and reclaim the area above the support trendline. If HOOK fails to do so and also breaks below the support, it could indicate a bearish momentum, potentially leading to further downward movement.
MyCryptoParadise
iFeel the success🌴

YGG/USDT Bullish Potential from Support Zone? 🚀YGG Analysis💎 Paradisers, let’s dive into the intriguing dynamics of #YGGUSDT! Currently, it’s displaying a pattern that has caught our attention in the market. Positioned within a key support zone, it’s aligning itself for a potential bullish advance.
💎 As we assess the price of SET:YGG , it’s crucial to note that it’s hovering around the key support at $0.8127. If the price successfully sustains momentum at this level, there’s a significant probability of a planned bullish move. With sustained upward momentum following a retest of this support, the target lies above the strong resistance at $1.7709.
💎 However, in the unpredictable world of crypto trading, being prepared for various outcomes is essential. Should #YGG struggle to maintain its level within the support zone, a strategic shift may be necessary. Consider preparing for a bullish resurgence from a lower support level at $0.6480. Caution is advised, as falling below this support level could signal a shift toward a bearish trajectory. Stay vigilant and adapt to market movements!.
MyCryptoParadise
iFeel the success🌴

RNDR/USDT bullish horizons from demand? 👀🚀RNDR analysis💎 Paradisers, let’s focus on #RNDRUSDT. It’s currently positioned within a demand zone and approaching key resistance at $8.284. If the price manages to break above this level, we can anticipate a strong bullish move.
💎 In our previous observations, CRYPTOCAP:RNDR has consistently followed a descending trendline, respecting it twice. With the current assessment near the key resistance of $8.284, there’s a high probability that the price will break through this level, especially considering it’s also trading within the demand zone, further strengthening the bullish scenario.
💎 However, a word of caution: if the price of #RNDR fails to maintain its momentum within the demand zone and dips below, we anticipate a bullish rebound from the lower Bullish Order Block level at $5.962. Thanks to ample liquidity, breaking below this level could cause a significant downward move1.
💎 Remember to employ prudent trading strategies and use proper stop-loss measures! Stay alert to market movements and look forward to more insights
MyCryptoParadise
iFeel the success🌴

CYBER/USDT bouncing on the support trendline, it's good sign!💎 Paradisers, the recent market dynamics surrounding #CYBER have indeed been noteworthy. It appears to be bouncing after hitting the support trendline.
💎 For CYBER to sustain its upward momentum, it needs to break out above the resistance area around $9.6. A successful breakout here could signal a return to bullish sentiment, potentially leading to a test of the strong resistance area.
💎 However, if CYBER breaks down below the support trendline, this could indicate a bearish momentum shift, with the price continuing its downward movement toward the support area.
💎 The support area is a critical level, and CYBER must bounce from it to resume its upward trajectory. If CYBER fails to bounce from the support and instead breaks below it, confirming bearish sentiment, the price may continue to decline further.
MyCryptoParadise
iFeel the success🌴

BCH/USDT it shows bounce from this level and potential upward!💎 Paradisers, the recent market dynamics surrounding #BCH have indeed been noteworthy. With a bounce from the demand area, there's momentum for BCH to continue its upward movement.
💎 A valid bounce from this area could signal a return to upward momentum, potentially leading to a back test of our target strong resistance area.
💎 However, if BCH fails to bounce from the demand area and instead breaks below it, this could signify a negative momentum shift, leading to continued downward movement towards the support area.
💎 BCH must bounce from the support area and reclaim price above the demand if it intends to sustain its upward movement. Failure to do so, with a breakdown below the support, could lead to further downward movement.
MyCryptoParadise
iFeel the success🌴

ZRX/USDT showing a bounce and potential back to upward move!💎 The recent market dynamics surrounding #ZRX have indeed been quite notable. Currently, ZRX is bouncing from the Bullish OB and is poised to test the resistance of the descending channel.
💎 If successful in breaking the pattern, the next challenge will be to breach the key resistance area at 0.618.
💎 This level is crucial for confirming a bullish reversal, and ZRX must surpass it to signal a return to bullish sentiment. If achieved, the price may target a test of the strong resistance area.
💎 However, if ZRX fails to break above the 0.618 resistance level and faces rejection, it could lead to a downward movement, potentially retracing to test the Bullish OB for new momentum.
💎 It's essential to monitor ZRX's behavior at the Bullish OB level. A successful bounce from this level would reinforce bullish momentum. Conversely, a failure to bounce, or a breakdown below the OB area, could signify a bearish trend continuation, resulting in further downward movement.
MyCryptoParadise
iFeel the success🌴

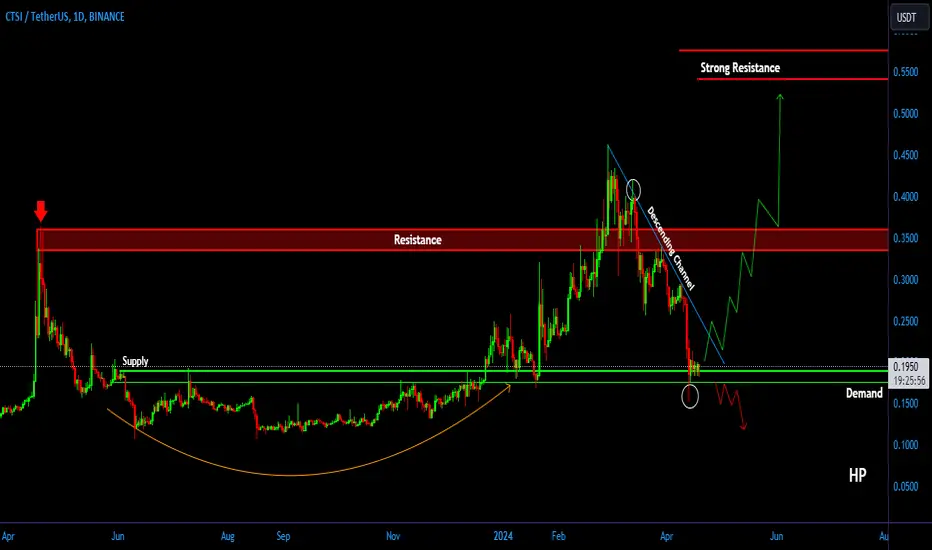
CTSI/USDT in the crucial area is required to bouncing from here!💎 The recent market dynamics surrounding #CTSI have indeed been quite notable. Currently, the price is at a critical support demand area, where a bounce is necessary to sustain upward momentum.
💎 If the bounce proves to be valid, the next hurdle is breaking out of the descending channel. Achieving this would facilitate continued upward movement, potentially leading to a test of the next resistance level and ultimately reaching the strong resistance area.
💎 However, if CTSI fails to bounce from the demand area and instead breaks below it, this could signal a bearish momentum. Such a scenario could lead to continued downward movement, with the price likely to decline further.
💎 It's essential for CTSI to successfully bounce from the demand area to maintain the bullish momentum. Failure to do so could result in a bearish trend, potentially leading to further declines in price.
MyCryptoParadise
iFeel the success🌴
GALA/USDT is the possible the price bouncing and back to upward!💎 The recent market dynamics surrounding #GALA have indeed been quite notable. Currently, the price is bouncing from the demand area, which is a positive indication.
💎 This bounce suggests potential upward momentum, with the price likely to test the resistance area next. If there is a successful breakout above the resistance, it could pave the way for further upward movement, potentially leading to a backtest of the strong resistance area.
💎 However, if GALA fails to bounce from the demand area and instead breaks down below it, this could signal a bearish scenario. Such a move could lead to continued downward momentum, with the next significant support level likely found at the support area.
💎 GALA must maintain support and reclaim the area above the demand to validate the bullish scenario. Failure to do so, especially if the support area is also breached, could confirm a bearish trend, potentially leading to further downward movement.
MyCryptoParadise
iFeel the success🌴

COMP/USDT preparing bullish trajectory|👀🚀COMP analysis💎 Paradisers, let’s delve into the #COMPUSDT as it nicely following falling wedge formation however, there’s a glimmer of hope as it once again restores momentum at the key support level of $49.82.
💎 But what if #COMPOUND can’t quite stick the landing at this support level? In that case, we need to be prepared to switch up our strategy. Our focus shifts to a strong comeback from slightly lower down specifically, at a support level it has already tested twice.
💎 Should the price of NYSE:COMP dip below this critical area, it’s time to reevaluate our game plan. We’re optimistic about a potential bounce back from the next support line, which sits at $41.92. However, if it fails to recover from there, we may witness further downside. Stay vigilant and remain adaptable as we closely monitor unfolding market dynamics.
MyCryptoParadise
iFeel the success🌴

SC/USDT Bullish Potential from Support Zone? 🚀SC Analysis💎 Paradisers, it’s time to focus on #SCUSDT, which is currently showing an intriguing pattern in the market. Positioned in a key support zone, it is lining up for a possible bullish advance.
💎 As we have seen price of SET:SC is approaching key support $0.005928 if price successfully sustain momentum there is great probability it will plan bullish move .with sustain upward momentum after retest of this level it aims to target above strong resistance$0.023106.
💎 However, in the unpredictable world of crypto trading, being prepared for various outcomes is key. If #SIACOIN finds difficulty maintaining its level within the support zone, a strategic shift may be necessary. This shift could involve preparing for a bullish resurgence from a lower support level at $0.004287. Caution is advised, as falling below this support level could signal a shift towards a bearish trajectory.
MyCryptoParadise
iFeel the success🌴

WOO/USDT it required to bounce and break for continue upward!💎 The recent market dynamics surrounding #WOO have indeed been quite notable. Currently, WOO is exhibiting a bounce from the Bullish OB area, signaling potential upward momentum.
💎 If this bounce proves valid, the price may attempt to break out of the resistance and reclaim this area.
💎 A successful breakout or reclamation of the resistance zone would be a positive signal, indicating a shift back to bullish sentiment and the potential for continued upward movement, possibly towards a backtest of the strong resistance area.
💎 However, if WOO fails to bounce from the OB area and instead breaks down below it, this could be a concerning sign. Such a move could lead to continued downward momentum, with the next significant support level likely around the $0.15 area.
💎 It's crucial to monitor WOO's behavior around these key levels closely. If it fails to bounce from the support area and subsequently breaks down below it, it could signal a further bearish movement. Conversely, a successful bounce and breakout above the resistance would reaffirm bullish sentiment and pave the way for potential upward movement.
MyCryptoParadise
iFeel the success🌴

COTI/USDT Shows a good sign for bouncing and back to upward!💎 The recent market dynamics surrounding #COTI have indeed been quite notable. Currently, COTI is positioned on the support area, and there are indications of bullish momentum with a rejection bullish candle.
💎 This suggests potential for a bounce from the support and a resumption of upward movement. There's a possibility that COTI will continue its upward trajectory, potentially reaching our target at the strong resistance area.
💎 However, if COTI fails to maintain the support or execute a successful bounce, it could signify a loss of momentum. In such a scenario, a breakdown below the support level may occur. If this happens, it would confirm a return to bearish sentiment and could lead to continued downward movement.
💎 Therefore, it's crucial to monitor COTI's behavior around the support area closely to assess whether the bullish momentum will be sustained or if a bearish trend reversal is imminent.
MyCryptoParadise
iFeel the success🌴

ADA/USDT show a bouncing from the support, potential back to UP💎 The recent market dynamics surrounding #ADA have indeed been quite notable. Currently, ADA is positioned on the support area.
💎 Historically, when ADA has touched this support area, it has exhibited significant upward movement. Therefore, there's potential for ADA to replicate this pattern by bouncing off the support and resuming its upward trajectory, possibly testing the bearish OB area.
💎 However, if ADA fails to sustain the support or bounce effectively, it could signal a loss of momentum and potentially lead to a breakdown below the support level. This would result in continued downward movement, possibly towards the Bullish OB area.
💎 At the Bullish OB area, a bounce and reclamation of price above the support level would be essential to resume the upward trend. If successful, ADA may have an opportunity to reach our target level. Conversely, if ADA fails to hold above the Bullish OB and breaks below it, further downward movement may ensue.

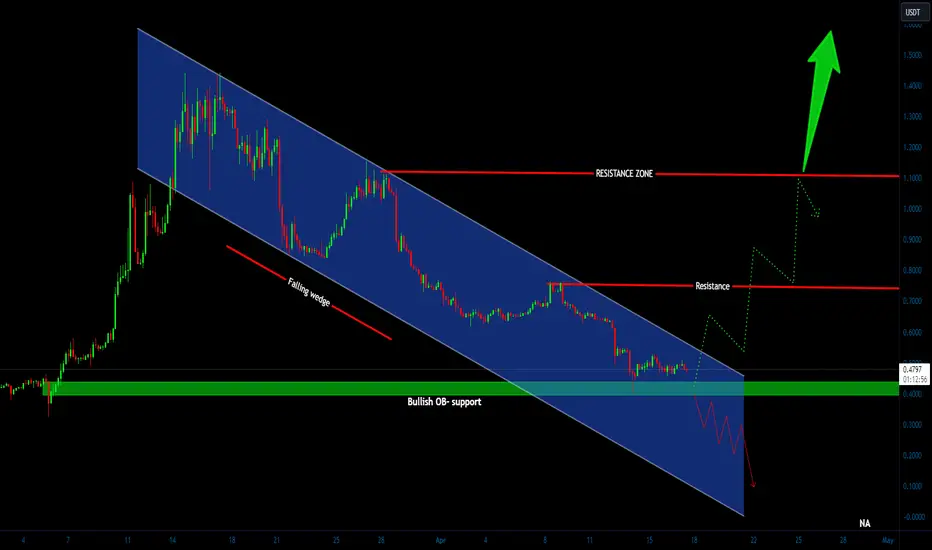
ZRX/USDT falling wedge what next? 👀ZRX analysis💎 Paradisers, get ready for an intriguing ride with ZRXUSDT! The current price action closely adheres to a falling wedge trajectory. If the price maintains momentum at the bullish order block (OB) and key support $0.3942, we can anticipate a bullish ascent toward the strong resistance level.
💎 However, let’s also consider an alternative scenario: Should the price drop below the key support within the falling wedge, it’s time to act wisely. As savvy traders, we’ll take a downward position because selling pressure has overcome buyers, capitalizing on the recent market uncertainty.
💎 For newcomers tempted to go long, remember to stay vigilant and anticipate market movements. Being one step ahead can make all the difference!
MyCryptoParadise
iFeel the success🌴
Floki/USDT upward momentum what next?👀🚀Floki Today analysis💎 Paradisers, prepare for an exhilarating ride with #FLOKIUSDT! The cryptocurrency is gearing up, fueled by a refined bullish order block (OB) in the lower time frame.
💎 A noteworthy development is its escape from a descending trendline, propelling #FLOKI on an optimistic trajectory. If the price successfully maintains momentum at the current OB level of $0.00008890, we can anticipate a strong bullish move targeting the robust resistance at $0.00030725.
💎 However, let’s remain vigilant. Should SEED_DONKEYDAN_MARKET_CAP:FLOKI encounter obstacles and struggle to maintain its stride, a bullish effort from the $0.00005514 support level may come into play. Breaking below this level would trigger a significant downward movement.
MyCryptoParadise
iFeel the success🌴

IMX/USDT preparing bullish trajectory|👀🚀IMX analysis💎 Paradisers,#IMXUSDT is doing something cool!After making double top formation it takes downward move despite downward trajectory price once again restoring momentum at key support level $1.7030
💎 What if #Immutable can't stick the landing at this support level and slips below it? Then we've got to switch things up. We're looking for a strong comeback from a bit lower down, at a support level it's hit twice already.
💎 If the price of #IMX dips below this key area, it's time to rethink our game plan. We're hoping for a bounce back from the next support line at $1.3147. If it doesn't manage to recover from there, we might see it fall even more. Stay sharp and ready to adapt as we watch how things unfold.
MyCryptoParadise
iFeel the success🌴
