QUICK/USDT preparing bullish trajectory|👀🚀QUICK analysis💎 Paradisers,#QUICKUSDT is doing something cool! After getting pushed back from a high point at $0.09842, it's picking up speed again at a crucial support spot, $0.09077. If it can keep up the pace here, there's a good chance it'll jump back up past that resistance level we saw before.
💎 What if #QUICK can't stick the landing at this support level and slips below it? Then we've got to switch things up. We're looking for a strong comeback from a bit lower down, at a support level it's hit twice already.
💎 If the price of #QUICK dips below this key area, it's time to rethink our game plan. We're hoping for a bounce back from the next support line at $0.08783. If it doesn't manage to recover from there, we might see it fall even more. Stay sharp and ready to adapt as we watch how things unfold.
Cryptosignal

PORTAL/USDT If break the descending, Indicating bullish momentum💎 PORTAL has recently undergone notable market dynamics. Presently, PORTAL has successfully reclaimed its position above the support area and is now approaching the resistance of a descending channel pattern.
💎 A breakout above this pattern would signal bullish momentum, probability propelling the price further upward toward our target resistance area.
💎 However, should PORTAL fail to break above the pattern and retreat back to the support level, there's a risk of losing the support, leading to a potential downturn towards the demand area around $1.8 - $1.7.
💎 PORTAL must bounce from the demand area and reclaim its position above $2.07 to sustain upward momentum.
💎 Failure to do so could result in further downward movement, particularly if key support levels are breached.

ARK/USDT It required break the resistance for continue upward!💎 ARK has recently exhibited significant market dynamics. Presently, ARK is encountering resistance in its price action.
💎 To regain bullish momentum, ARK must successfully break above this resistance level and reclaim its position. Doing so could signal a return to an upward trajectory, with probability movement towards our target area.
💎 However, should ARK fail to overcome the resistance and experience rejection, there's a likelihood of a retracement towards the support area around $0.98.
💎 When ARK approaches the support area, it becomes imperative for it to rebound from this level. Failing to hold above this support could lead to continued downward movement, potentially towards stronger support zones.

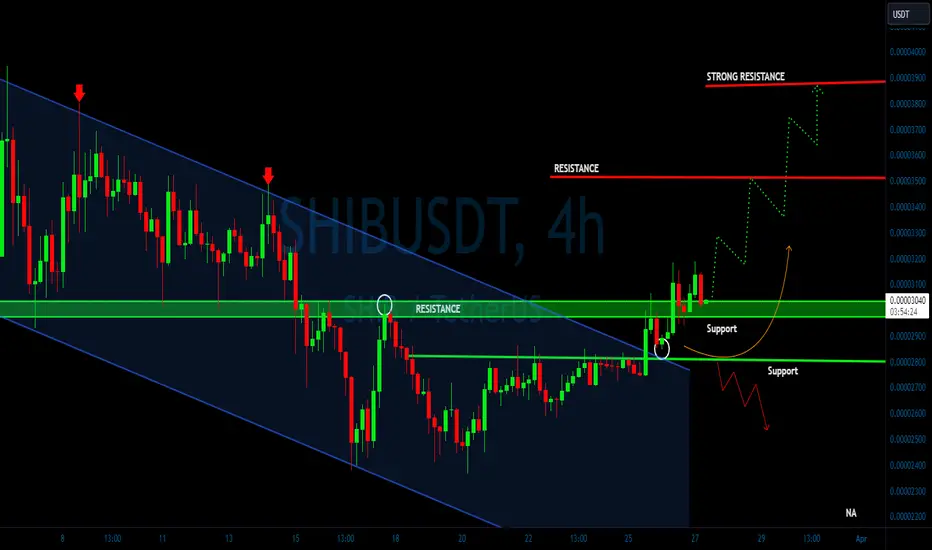
SHIB/USDT upward momentum? 🚀SHIBA Today Analysis💎 Paradisers, take note as #SHIBUSDT is on the move. After climbing out of a descending channel, it's currently challenging a key resistance at $0.00002961. Breaking through this level could pave the way for a bullish advance beyond.
💎 In light of market fluctuations, should SHIBAINU face hurdles at this resistance, we may need to rethink our strategy. A bullish recovery from the support at $0.00002803, where the price has previously stabilized, is on our radar.
💎 Falling beneath this crucial support could hint at a shift towards a stronger bearish trend, marked by increased selling. Staying vigilant and adaptable is vital as we navigate the changes in the #SHIBA market.
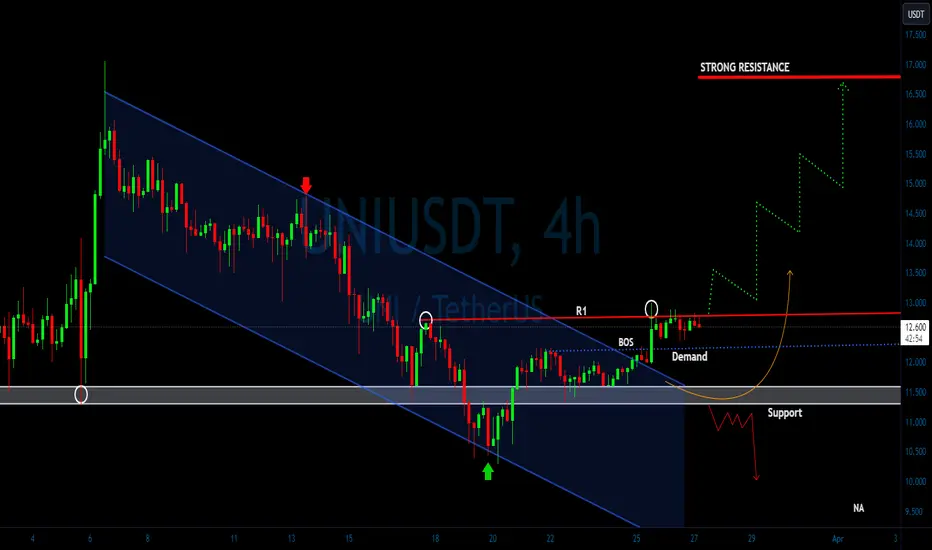
UNI/USDT descending channel assessing key resistance? 🚀UNISWAP 💎 Paradisers, pay attention as #UNIUSDT showcases an intriguing move. Following a descending channel, it's recently broken above and is now testing a critical resistance at $12.763. A successful breach of this resistance could significantly boost its chances for a bullish journey past this barrier.
💎 Amid market volatility, if $uniswap struggles to surpass the R1 resistance, we'll consider adjusting our approach. We're eyeing a bullish bounce from a lower support at $11.317, a level where the price has previously found footing.
💎 A drop below this key support level might signal a transition to a more pronounced bearish phase, accompanied by heightened selling activity. Maintaining alertness and flexibility is essential as we monitor the #UNI market's shifts.
GAS/USDT For the Bullish move, need to breakout the supply area!💎 GAS has indeed garnered significant attention in the market. Currently, there is a possibility that GAS will undergo a retesting phase at the support area before resuming its upward movement to attempt a breakout of the supply area. It's noteworthy that GAS has consistently faced rejection upon reaching the supply zone.
💎 If GAS manages to successfully break above the supply area, it could trigger a bullish momentum, probability the price further upward toward our target area.
💎 However, if GAS fails once again to break above the supply zone, there's a likelihood of the price being rejected and retracing back towards the support area, or potentially even descending to the demand area.
💎 If GAS retraces to the demand area around $5.5, it is crucial for it to bounce from this level. Failure to do so could indicate a continuation of the downward movement for GAS, leading to further declines.

RDNT/USDT It required to break the resistance for back to upward💎 RDNT has indeed captured considerable attention in the market. Currently, RDNT is poised to reclaim and break out of the resistance area.
💎 A successful breakout could potentially signal a renewed upward movement for RDNT, with the next target being the resistance ATH area.
💎 However, if RDNT fails to break above the resistance level, there's a possibility that the price will retreat to the support area.
💎 It's important to note that this support area holds significant importance. If RDNT fails to bounce from this level and subsequently breaks down below the support, it could signal a continuation of the downward movement for RDNT.

LEVER/USDT Potential back to try break the key resistance area.💎 LEVER has recently demonstrated significant market dynamics, exhibiting a bounce from the support area.
💎 There's potential for LEVER to sustain its upward momentum and retest the resistance around the 0.0032 area. A breakout above this resistance could pave the way for an easy movement towards our target area.
💎 However, if LEVER faces rejection at the resistance area, there's a possibility that the price will retreat and test the demand area around $0.002.
💎 When LEVER reaches the demand area, it is crucial for it to bounce, as this zone holds significant importance. Failure to sustain the demand area could result in further downward movement, potentially testing lower support levels.

ICX/USDT A successful break the pattern, will indicate a bullish💎 ICX has undeniably attracted significant attention in the market with the formation of a double-bottom pattern.
💎 There is potential for ICX to attempt a breakout above the resistance neckline of this pattern. A successful breakout could pave the way for significant upward movement towards our target strong resistance area.
💎 However, if ICX fails to break above the resistance, there is a possibility of rejection, leading the price back to the support area around 0.285 to gather new momentum.
💎 ICX must bounce from the support area to make another attempt at breaking above the resistance of the double bottom pattern. Failure to bounce, or worse, a breakdown below the support, could signal further downward movement for ICX.

AVA/USDT Descending channel bullish move from FVG?💎 Paradisers, focus your sights on #AVAUSDT for a potential trading breakthrough. This asset is making its way through an ascending channel, hinting at a significant bullish jump from an important FVG (Fair Value Gap) level.
💎 Over the recent month, #Travala.com has been diligently following a descending channel pattern. As we near the FVG level of $0.5481, we're poised for a bullish turnaround at this point, provided the asset can sustain its momentum, laying the groundwork for a bullish journey ahead.
💎 If momentum for NYSE:AVA starts to wane, our strategy includes scouting for a robust bounce back from the critical demand level just beyond the FVG zone at $0.5212.
💎 A decline below the pivotal demand level of $0.5212 would necessitate a comprehensive reevaluation of our trading strategy. This scenario would suggest a challenge in maintaining bullish momentum, requiring an adaptive strategy shift to meet the changing market dynamics..🌴💰

DASH/USDT Nearing a Key Supply Zone with Potential for Action? 💎 Attention, Paradisers! We're zoning in on #DASHUSDT as it edges closer to a pivotal supply zone, hinting at possible market dynamics.
💎 On its journey, NASDAQ:DASH has been navigating a descending channel but is now aiming for the supply level at $30.82. The anticipation builds if it breaches the $30.82 mark and manages to maintain momentum above this zone, transforming supply into demand. Such a development holds a strong potential for a bullish trend, provided the price meets these conditions.
💎 For the savvy traders among us, should the climb falter, be on the lookout for a bullish comeback from the demand level at $28.57. A dip below this level might signal a shift towards bearish trends.
💎 Maintain adaptable strategies and remain vigilant, Paradisers. We're all in this together, prepared to navigate the market's fluctuations.🌴💰

CRV/USDT bullish horizon from demand? 🚀CRV Analysis💎 Paradisers, prepare for an exciting trading opportunity with #CRVUSDT, poised for a bullish breakout from its current demand zone.
💎 As we delve into #CurveDaoToken, after a brief deceleration at the supply level of $0.5797, our sights are now set on a potential bullish leap from the demand level of $0.5414. This opportunity is bolstered by significant liquidity, presenting a robust scenario for a bullish reversal. Maintaining strength at this level could be the foundation for the bullish journey we anticipate.
💎 If momentum for LSE:CRV starts to wane, our strategy shifts to seeking a powerful bounce from the firm demand level at $0.5074. However, a descent below this crucial point may signal the onset of a more substantial bearish trend.

ZEC/USDT bullish ride? 👀 🚀 ZCASH today analysis💎 Paradisers, focus on #ZECUSDT! An interesting pattern has emerged as it finds itself in a demand zone, hinting at a possible bullish journey ahead.
💎 #ZCASH is currently moving within an ascending channel, and it has impressively broken above a significant resistance at $26.09. Following a successful retest, it continues its climb. Its position in the demand zone boosts the likelihood of maintaining a bullish path.
💎 Additionally, a notable resistance zone lies ahead. We anticipate the price may soon make another attempt to breach this barrier in the coming days.
💎 However, stay vigilant: a dip below a crucial support level could indicate a shift to bearish territory. As always, ensure you're using wise trading tactics and setting appropriate stop-loss orders! Keep an eye on market trends and anticipate further updates.

SXP/USDT bullish horizon from demand? 🚀SXP Analysis💎 Paradisers, get ready for an exciting trading adventure with #SXPUSDT, signaling a bullish momentum from its demand zone.
💎 As we explore the journey of #SXP, we've observed its transition from a supply to a demand zone, thanks to a consolidation and liquidity shift. The new pivotal point at $0.3705 is where price demonstrates strong upward momentum, marked by significant green candles. Holding firm at this level could be crucial for the bullish trend we anticipate.
💎 If the momentum behind TSX:SXP starts to fade, our focus will shift towards seeking an energizing bounce from the established demand level at $0.3567. However, a drop below this essential level could signal the onset of a more profound bearish trend

NEAR/BTC bullish ride? 👀 🚀 Near today analysis 💎 Paradisers, turn your attention to #NEARBTC! We've spotted a compelling trend as it positions itself within a demand zone, suggesting a bullish path could be on the horizon.
💎 #Nearprotocol is navigating an ascending channel and has notably breached a key resistance at $0.00007898. Currently, as the price edges closer to a demand level, maintaining its momentum could significantly increase the chances of a bullish advance towards and beyond the supply zone.
💎 Should the momentum for AMEX:NEAR begin to wane, we'll be looking to capitalize on a dynamic rebound from the crucial demand level at $0.00005848. Nonetheless, breaking below this pivotal point may hint at a shift towards a deeper bearish phase.
💎 Remember to employ strategic trading methods and implement proper stop-loss measures! Stay vigilant to market developments and await more insights

KAVA /USDT bullish horizons from key demand? 👀 🚀KAVA analysis💎 Paradisers, set your sights on #KAVAUSDT! An intriguing pattern has emerged, indicating it's in a prime spot for a potential bullish surge.
💎 #KAVA is on an upward trajectory within an ascending channel, having impressively crossed a significant supply point at $0.8455. With the price now nearing a critical demand level, keeping up the pace could pave the way for a strong bullish push into higher territory.
💎 If the drive behind SEED_DONKEYDAN_MARKET_CAP:KAVA starts to fade, we're poised to seize a potential uplift from the key demand level at $0.7972. However, a drop below this essential marker could signal a move into bearish waters.
💎 As always, make sure to navigate with savvy trading strategies and secure your positions with appropriate stop-loss orders! Keep an eye on the evolving market landscape and stay tuned for further updates.

SEI/USDT upward momentum from key support?👀🚀SEI Analysis💎Paradisers, turn your focus to #SEIUSDT, radiating bullish vibes from its support zone.
💎#SIECOIN has encountered resistance at $0.9380, leading to a slight retreat. However, if it stays strong above the pivotal support at $0.8366, we're on the brink of a bullish journey targeting the significant supply zone at $1.0339.
💎 In the ever-shifting landscape of crypto, flexibility and quick adaptation are key. If #SEI finds it challenging to maintain its stance at this crucial level, a strategic shift might be in order.
💎 Should we need to adjust, we're looking at a bullish maneuver from the support level at $0.7613. It's critical to monitor this level closely, as a fall below could indicate a turn towards a bearish scenario for #SEI.

EGLD/USDT upward momentum what next?👀 🚀 EGLD Analysis💎 Paradisers, brace yourselves for an exciting opportunity to profit with #EGLDUSDT! It's gearing up for a potential rise from a pivotal level.
💎 Diving into #EGLD journey, it has been tracing a cup and handle pattern. Currently, it's testing a tough supply zone. A breakthrough above this zone, coupled with sustained momentum, could signal a robust bullish sprint towards the $77.59 supply zone.
💎 Should CRYPTOCAP:EGLD begin to falter, our eyes are on a vigorous recovery from the solid support and gap at $55.90. With substantial liquidity at this level, a rebound seems promising, setting a critical watchpoint. However, slipping below this crucial level could spell a shift towards bearish terrain.

STX/USDT bullish reversal form key support? 👀 🚀STX analysis💎Paradisers! #STXUSDT looks like it's getting ready to climb. If it can keep up its energy at a crucial support level $2.3741 and bounce back, there's a good chance it'll start moving up, aiming to get past a big obstacle.
💎 Watching Closely: Right now, the price of #STACKS is heading towards an important level, and we're waiting to see how it behaves. Being patient and keeping a sharp eye out is crucial in trading. Looking back, we've seen the price respect this spot twice. However, on its third approach, a break occurred due to factors like Fair Value Gap (FVG), liquidity and OB right below the support.
💎Plan B: As smart traders, we always have a backup plan. If our hope for a rise at this spot doesn't happen and the price falls further, we'll change our game plan. We're looking at a potential bounce back from a lower spot at $2.0669, attracted by some strong market interest there that could push the price up again. If it falls below this, we might see it drop more.
💎 Flexible Moves: Paradisers, this situation shows why it's important to be flexible with our trading strategies. By watching closely and being ready to change plans based on what's happening, we set ourselves up for success. Your ParadiseTeam is here to help guide you through these market waves, making sure you're ready for whatever comes next.

Op/usdt retesting key resistance| 👀🚀OP Today analysis💎 Paradisers, check out #OPUSDT as it's on an intriguing path, currently retesting a crucial resistance that could soon become support, signaling a potential bullish jump from here.
💎 After escaping a descending channel, $Optimism is gearing up to challenge the resistance at $3.847. A successful retest and maintaining strength at this level could set the stage for a bullish surge. With continued momentum, it's eyeing an initial resistance at $4.295, aiming to break through and tackle even higher barriers.
💎 Should #OP's price fall beneath this pivotal zone, it's time for a strategic shift. We're bracing for a bullish bounce from the secondary support at $3.395. Falling short of a comeback here could spell further drops. Let's remain alert and adaptable to swiftly navigate any market changes.

ARB has formed an entry for a long positionARB has formed an entry for a long position
🔵Entry Zone 1.7208 - 1.6859
🔴SL 1.5761
🟢TP1 1.8412
🟢TP2 1.9662
🟢TP3 2.0766
Risk Warning
Trading Forex, CFDs, Crypto, Futures, and Stocks involve a risk of loss. Please consider carefully if such trading is appropriate for you. Past performance is not indicative of future results.
If you liked our ideas, please support us with your likes 👍 and comments.

STG after the pullback will continue to go upSTG after the pullback will continue to go up
🔵Entry Zone 0.7156 - 0.7334
🔴SL 0.6679
🟢TP1 0.8102
🟢TP2 0.8834
🟢TP3 0.9953
Risk Warning
Trading Forex, CFDs, Crypto, Futures, and Stocks involve a risk of loss. Please consider carefully if such trading is appropriate for you. Past performance is not indicative of future results.
If you liked our ideas, please support us with your likes 👍 and comments.

FLR/USDT assessing resistance and trendline?🚀FLR Today AnalysiS💎 Paradisers, take a moment to observe #FLRUSDT as it embarks on an interesting journey. Currently, the price is testing an ascending trendline and facing a crucial resistance at $0.03848. A breakthrough above this level could launch a significant bullish campaign to overcome even tougher resistance.
💎 On the flip side, if NYSE:FLR struggles to surpass this resistance, it's time for a strategic pivot. As astute traders, we're anticipating a bullish recovery from the lower support at $0.03473, including a Fair Value Gap (FVG) level. Given that liquidity has been tapped below this point, a bullish reversal seems highly probable.
💎 Falling beneath this additional support level could indicate a shift towards a more defined bearish trend, marked by increased selling pressure. Staying vigilant and adaptable is crucial as we navigate the evolving #FLR market dynamics.
