MANA can get rejected and go lower from 0.7053MANA can get rejected and go lower from 0.7053
🔵Entry Zone 0.6837 - 0.7053
🔴SL 0.7250
🟢TP1 0.5982
🟢TP2 0.5188
Risk Warning
Trading Forex, CFDs, Crypto, Futures, and Stocks involve a risk of loss. Please consider carefully if such trading is appropriate for you. Past performance is not indicative of future results.
If you liked our ideas, please support us with your likes 👍 and comments.
Cryptosignal

HOOK/USDT it is required break the resistance for continue UP!💎 HOOK has recently exhibited significant market dynamics, particularly as it encounters resistance in its current trading range.
💎 HOOK needs to break and reclaim the price above this resistance level to signal a bullish reversal and probability continue its upward movement toward our target area.
💎 However, if HOOK fails to overcome this resistance and experiences rejection, there is a possibility that the price will retreat and test support levels. The demand area around $1.16 to $1.023 is crucial in this scenario, as it has historically provided significant support.
💎 If HOOK reaches the demand area, it must bounce from this level to maintain its bullish momentum. Failure to do so could lead to a bearish continuation, with the price potentially experiencing further downward movement.

HOT/USDT need to bounce from this support zone for back to UP!💎 HOT has recently demonstrated notable market dynamics, particularly as it undergoes a retest of the support area following a significant breakout. It is crucial for HOT to bounce from this support zone in order to sustain its upward momentum.
💎 If HOT successfully bounces from the support area, it has the potential to resume its upward movement, aiming to make higher highs in our target strong resistance area.
💎 However, if HOT fails to find support at the current level and breaks below the support area, it would indicate weakness in the market sentiment. This could lead to further downward movement, with the next potential support area being around 0.00173.
💎 Therefore, it is essential for HOT to bounce from the support area and reclaim levels above it to maintain its bullish trajectory. Failure to do so could result in a continuation of the downward movement.

HIVE/USDT Bullish move from support?👀 🚀Hive Today analysis💎Paradisers, #HIVEUSDT is currently on the move, showing promising strength at its support level. There's a good chance it could rise above the $0.4136 resistance if it keeps up this positive momentum.
💎In the past, we've seen #HIVE follow a downward trend, consistently hitting lower peaks and troughs. A recent bounce from the $0.3689 support has bolstered the outlook for a bullish turn, especially as it's maintaining its pace at this support level to potentially climb past the resistance.
💎 Should #HIVE struggle to keep its momentum at the $0.3689 support, we're anticipating a bullish recovery from the next support at $0.3348. However, breaking below this point may lead to a further drop. Let's stay alert and ready to adapt our strategies as needed.

BAL/USDT should price respect key support? 👀 🚀BAL analysis💎Paradisers, turn your attention to #BALUSDT! We've observed its steadfast position, holding a pivotal support level and gearing up for a potential bullish ascent.
💎 #BAL has been under a tough line that kept pushing it down, but it recently broke free and is now sitting comfortably at $4.558 support. If it keeps up the good work here, we could see it jump up past $5.871 resistance.
💎 But, if #BAL starts slipping and can't stay above $4.558, we might need to change our plans. We're looking at a possible bounce back from $4.307, a spot it's hit before, showing there's a good chance for a pickup. Dropping below this point, though, could mean more drops ahead, so let's stay sharp and make smart moves with #BAL.

ZEN/USDT Should bounce from the support for continue upward move💎 ZEN has recently displayed notable market dynamics, particularly as it rests on a support area, which is crucial for sustaining its upward momentum. A bounce from this support zone is essential for ZEN to continue its upward trajectory.
💎 Should ZEN successfully bounce from the support, it has the probability to resume its upward movement, aiming to break through the local resistance at $15.7.
💎 However, if ZEN fails to find support at the current level and breaks below the support area, it will signify weakness and could lead to further downward movement. In such a scenario, the next potential stop for ZEN would be at the lower support area around $9.6.
💎 Therefore, it is imperative for ZEN to bounce from the support area and reclaim levels above it to maintain its bullish momentum. Failure to do so could result in a continuation of the downward movement.

MASK/USDT The perfect bounce suggests potential back to upward!💎 MASK has recently shown notable market dynamics, particularly as it rebounds from a support area.
💎 The strong green candle suggests potential upward momentum, but a decisive breakout above the resistance at $5.35 is needed to confirm this continuation towards the target strong resistance area.
💎 However, if MASK fails to break above the resistance, there's a possibility of a retracement back to the support area to gather momentum for another attempt at breaking out.
💎 If MASK fails to find support at the current level and breaks below the support area, the next potential stop is at the demand area of around $3.08. This demand area holds significance as it needs to act as a strong support zone for MASK to maintain its upward trajectory.
💎 However, if MASK breaks down below the demand area, it will confirm bearish sentiment, potentially leading to further downward movement in price.

BNX/USDT Keep an eye on the demand or support, Indicating Bounce💎 BNX has recently experienced notable market dynamics, particularly as it faces significant resistance in its current price range. The rejection from this resistance suggests a potential retracement to the demand area around 0.424.
💎 If BNX demonstrates bullish signs at this demand level, such as a rejection of lower prices with bullish candle formations, there's a probability of a bounce back upward toward retesting the strong resistance area.
💎 However, if the demand area fails to provide sufficient support and instead shows signs of consolidation with weak volume, it could indicate weakness in BNX's price action. In such a scenario, there's a risk of BNX breaking down below the demand area and continuing its downward movement towards the support zone around 0.34 - 0.3.
💎 At the support level, it's crucial for BNX to bounce back and reclaim its position above the support area to maintain its upward movement. However, if the demand area fails to hold and support is broken, it would signal bearish sentiment for BNX, potentially leading to further price declines.

APE/USDT Indicating bounce from this support & continue upward!💎 APE has recently encountered notable market dynamics, particularly as it resides within a support area that is crucial for maintaining its upward trajectory.
💎 A bounce from this support is essential for APE to sustain its upward movement. If APE successfully bounces from this support, there's potential for it to resume its upward trajectory and retest the strong resistance area.
💎 However, if APE fails to find support at this level and instead breaks down below the area, it could signal a concerning development. Losing the support may lead to continued downward movement for APE, potentially targeting the next lower support area around 1.54, where a significant bullish trendline is also present.
💎 At the support level, it's imperative for APE to bounce and reclaim its position above the support area to maintain its bullish momentum. Failure to do so could result in further downward movement for APE.

MINA/USDT bullish reversal from support? 👀 🚀MINA analysis💎Paradisers, prepare for an enthralling ride with #MINAUSDT. Positioned at a pivotal support level, it hints at a robust leap into bullish territory.
💎 A standout feature is its escape from a descending trendline, propelling #MINA on an optimistic trajectory. This shift marks the resurgence of bullish momentum, favoring a surge upwards. If this energy persists, the $1.7238 resistance zone stands as our next target.
💎 Conversely, should #MINA face obstacles and struggle to maintain its stride, a bullish effort from the $0.9763 support level could be in play. However, a descent below this threshold may prompt the asset to revisit the trendline it recently overcame, indicating a critical juncture for its short-term direction.

ALT/USDT Breakout alert!!, Indicating continue the upward trend!💎 ALT has recently encountered significant market dynamics, particularly with a breakout of the descending channel pattern.
💎 This breakout suggests a potential continuation of the upward movement, aligning with the prevailing bullish trend characterized by higher highs and higher lows.
💎 With this breakout, ALT may continue its upward trajectory and probability reach new higher highs, particularly targeting levels indicated by Fibonacci retracement.
💎 However, if ALT fails to sustain its upward momentum and does not continue upward, there's a possibility that the price may retreat and retest the support area to gather another momentum.
💎 When ALT reaches the support area, it's crucial for it to bounce, as this area holds considerable importance. Failure to bounce and a subsequent breakdown below the support could signal a shift in momentum, potentially leading to a bearish trend reversal.

ID/USDT Keep an eye on the support or demand, Indicating Bounce!💎 ID has recently encountered significant market dynamics, particularly as it lies on a support area requiring a bounce to sustain its upward movement.
💎 A successful bounce from this support could signal a continuation of the upward trend, potentially leading to a retest of the strong resistance area.
💎 However, if ID fails to bounce from the support and breaks down below it, this could indicate a bearish sign. In such a scenario, ID may lose support and continue downward, potentially reaching the demand area around $0.8 - $0.7.
💎 At the demand area, it's crucial for ID to bounce and reclaim the price above the support area to maintain the upward movement. Failure to do so could result in continued downward movement for ID.

COMP/USDT Bounce with strong green candle, Potential back to UP!💎 COMP has recently experienced notable market dynamics, particularly with a bounce from a support area.
💎 A strong green candle suggests potential upward movement, with a key resistance level at $80.7 needing to be breached for further bullish momentum toward our target strong resistance area.
💎 However, failure to break this resistance could lead to a retest of the support area, potentially creating a new momentum for a breakout.
💎 Should COMP fail to bounce from the support, the next stop would be the demand area around $55.8. COMP must bounce from this area and reclaim the price above the support to sustain the upward movement.
On the contrary, a breakdown below the demand area and the support trendline would confirm a bearish sentiment, likely resulting in further downward movement.

OM/USDT Potential retesting before continue upward movement!💎 OM has recently encountered notable market dynamics, experiencing a strong rejection at a key resistance area. There's a possibility that OM may retest the support area in the range of 0.45 to 0.4.
💎 If OM demonstrates bullish signs at this support level, such as bullish candle rejections, it could lead to a bounce in price, propelling it back upwards toward the strong resistance area.
💎 However, if the support area fails to hold and there's only consolidation with weak volume, it's likely that OM will break down further, potentially testing the demand area around 0.25.
💎 In such a scenario, it's important for the demand area to facilitate a bounce and for the price to reclaim the support level. Failure to do so would be considered a bearish sign, likely leading to further downward movement.

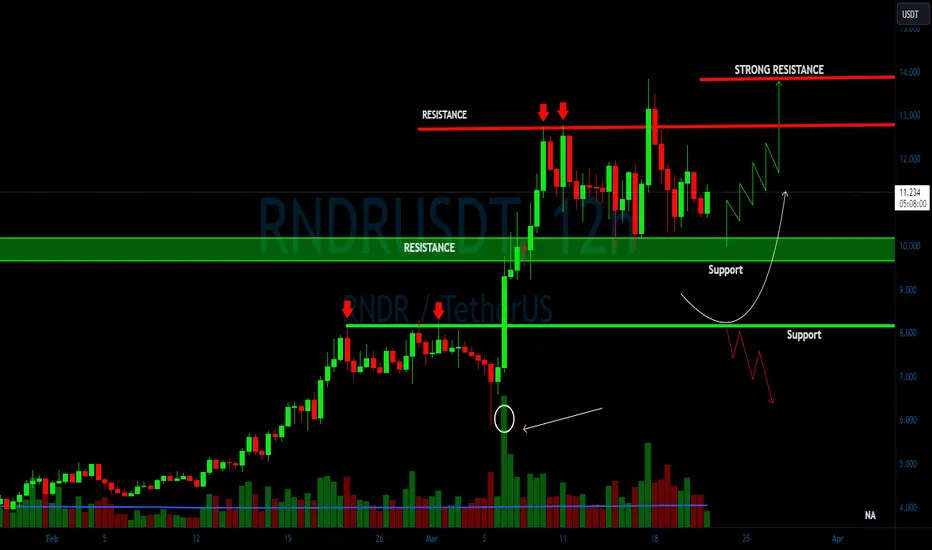
RNDR/USDT upward momentum from support? 🚀RNDR Analysis💎 Paradisers, take notice as we observe #RNDRUSDT an intriguing move underway. Should the price maintain its drive at the critical support of $9.936, there's a good chance we'll see an ascent towards overcoming the resistance at $13.873.
💎 Another angle to consider: if the price of CRYPTOCAP:RNDR can't sustain its momentum at this key support and dips below, it's time to adjust our approach. We're eyeing a bullish resurgence from a deeper support at $8.163. Notably, this level has shown significant volume spikes, signaling substantial liquidity and money flow, urging us to proceed with caution in our trading decisions.
💎 A fall beneath this lower support could lead to further declines, underscoring the importance of precise and well-thought-out actions in your trading journey to achieve success
SOL has broken below the last HHSOL has broken below the last HH, it can continue to go lower
🔵Entry Zone 191.76 - 195.48
🔴SL 214.54
🟢TP1 177.52
🟢TP2 155.35
Risk Warning
Trading Forex, CFDs, Crypto, Futures, and Stocks involve a risk of loss. Please consider carefully if such trading is appropriate for you. Past performance is not indicative of future results.
If you liked our ideas, please support us with your likes 👍 and comments.

XRP After the breakout will go upXRP After the breakout will go up
🔵Entry Zone 0.5908 - 0.6234
🔴SL 0.5467
🟢TP1 0.6928
🟢TP2 0.8320
🟢TP3 1.0980
Risk Warning
Trading Forex, CFDs, Crypto, Futures, and Stocks involve a risk of loss. Please consider carefully if such trading is appropriate for you. Past performance is not indicative of future results.
If you liked our ideas, please support us with your likes 👍 and comments.

HBAR/USDT bullish ride what next? 👀 🚀HBAR analysis💎 Paradisers, gear up for an exciting journey with #HBARUSDT. It's currently anchored at a critical support, suggesting a promising push towards bullish territory.
💎 A key highlight is its breakaway from a descending trendline, launching #HederaHashgraph into a positive climb. This move signals a revival of bullish energy, with a strong tilt towards an upward spree. Should this momentum hold, we're eyeing a run at the $0.1429 resistance zone.
💎 On the flip side, if #HBAR encounters hurdles and fails to keep up the pace, we might see a bullish attempt from the $0.0875 support level. Yet, slipping below this line could lead the asset to retest the previously escaped trendline.

FLOW/USDT upward momentum from support? 🚀flow Analysis💎 Paradisers, direct your attention to the recent intriguing activity of #FLOWUSDT, which is showing a promising hint of a bullish movement. With key support identified at $1.272, the past few days have seen the price engaged in a downward trend within a descending channel.
💎 However, with signs now pointing towards a trend reversal, we're on the lookout for solid confirmation that supports a bullish outlook from this critical support level.In the event that AMEX:FLOW struggles to maintain its footing at the $1.272 support level and dips below, we are prepared for a potential bullish rebound off the secondary support level at $1.205.
💎 It's important to proceed with caution: a fall below this secondary support might indicate a shift to a more definitive bearish trend, accompanied by an uptick in selling pressure. Staying vigilant and adaptable is key as we monitor the developments in the FLOW market.

DOT/USDT holding key support? 🚀Polkadot Today Analysis💎 Paradisers, prepare for an exciting chance with #DOTUSDT as it stands firm at the critical support of $8.711. Holding steady at this level hints at a potential bullish trend, especially since the price has already tested liquidity below this point, reinforcing the bullish outlook.
💎 Let's also ponder the scenario where CRYPTOCAP:DOT struggles to surpass its previous peak, suggesting a risk of breaking below the support. In such a case, we're eyeing a bullish bounce from a secondary support at $8.137.
💎 Caution is advised: slipping below this secondary support could signal a shift towards a more pronounced bearish phase, marked by increasing sell-offs. Being alert and flexible is crucial as we navigate the evolving #POLKADOT market.

NEO/USDT A Breakout the resistance, Indicating Bullish momentum.💎 NEO has recently encountered significant market dynamics, currently facing resistance. A breakthrough above this level is crucial for NEO to regain bullish momentum and continue its upward movement towards our target area.
💎 However, if NEO fails to overcome the resistance and experiences rejection, it may retreat to test support levels around $13.5 or even potentially drop further to the demand area around $10 if the support is breached.
💎 When NEO reaches the demand area, a bounce is necessary as this level holds significant importance. Failure to sustain the demand zone would signal a bearish sentiment, potentially leading to further downward movement in NEO's price.

SYN/USDT Bounce from the support, Indicating continue the upward💎 SYN has recently demonstrated significant market dynamics. After a notable bounce from the support area, there's potential for the price to resume its upward movement and retest our target strong resistance area.
💎 However, if SYN returns to test the support again and fails to bounce, this could be a concerning sign.
💎 A failure to bounce might indicate weakness, potentially leading to a breakdown below the support level.
💎 In such a scenario, SYN could see further downward movement, with the next support level likely around 0.587.

CHR/USDT Bullish pennant formation, Indicating Bullish momentum!💎 CHR has recently encountered notable market dynamics, with the current price bouncing within a support area and forming a bullish pennant pattern.
💎 This pattern typically suggests a continuation of the bullish trend. If CHR successfully breaks out of the pattern, it may experience significant upward movement, potentially reaching our target area.
💎 However, if CHR faces rejection and fails to break out, it may revisit the support area for multiple tests.
💎 This support area holds significant importance, as a failure to sustain it could lead to a breakdown and signal further downward movement for CHR.
