QTUM/USDT Need to bounce from the support for back to upward!💎 QTUM has recently encountered notable market dynamics, currently resting on a support area.
💎 If QTUM demonstrates a positive sign such as a bullish candle rejection at this support, there is probability for a bounce upward, leading to a retest of the strong resistance area.
💎 However, if QTUM fails to bounce at this support level, it could be a concerning sign. A breakdown below the support level may lead to further downward movement, with the next potential stop being the demand area around 3.134.
💎 QTUM must bounce from the demand area and reclaim the area above the support to sustain upward momentum. Failure to do so could result in continued downward pressure on QTUM's price.
Cryptosignal

ETC/USDT ascending channel trajectory what next? 🚀ETC Analysis💎 Paradisers, take a moment to observe #ETCUSDT intriguing path. It's currently tracking an ascending channel, closely evaluating a crucial support level. Should it maintain its momentum, we're poised for a bullish breakout.
💎 Should #EthereumClassic's drive falter at this support, it's our cue to adjust our approach. Anticipate a bullish bounce from a lower support level, where there's a notable chance for a rebound, given its history of honoring this level on two occasions.
💎 Vigilance remains paramount: a descent below this further support could herald a more pronounced decline as market sentiment shifts towards selling. Remain alert, Paradisers, as we navigate the nuanced movements of the #ETC market.

GALA/USDT upward journey from demand? 🚀GALA Analysis💎 Paradisers, dive into the fascinating shift of #GALAUSDT from supply to demand zones, hinting at a bullish wave on the horizon.
💎 Reflecting on #GALA journey, it has masterfully navigated through its Cup and handle pattern, traditionally sparking ascents. Now, as supply morphs into demand, the stage is set for a bullish leap from this pivotal level, aiming for higher supply zones with continued momentum.
💎 Conversely, should INDEX:GALA falter in its climb, pivoting to a bullish stance from the demand level at $0.03547 might be our next move. While the temptation to sell may grip newcomers at signs of struggle, the wisdom lies in holding off for a clear dip below this level before executing strategic trades.
MKR/USDT Potential will be back test on the demand or support!💎 MKR has recently encountered notable market dynamics, experiencing a significant rejection at a strong resistance area.
💎 There is potential for MKR to undergo a backtest on the demand area around $2530. If MKR shows positive signs in the demand zone, such as bullish candle rejections, it could bounce back upward and retest the strong resistance area.
💎 However, if MKR consolidates within the demand area with weak volume, there is a possibility of further downside movement, testing the support area around $2260.
💎 A bounce from the support area is necessary for MKR to continue its upward trajectory and establish a new leg up. However, if MKR breaks down below the support, it would be a bearish sign, potentially leading to a return to consolidation and a test of stronger support levels.

SXP/USDT upward journey eyeing key supply?💎 Paradisers, set your sights on #SXPUSDT, marking a notable trajectory in the trading landscape. Nestled within a support zone, it's prepping for a renewed charge at a tough resistance, signaling the possibility of a bullish breakout.
💎 A deep dive into #SXP's trading saga reveals its journey along a descending channel, now breaking free with renewed momentum after a recent dip, suggesting a ripe opportunity for a bullish run.
💎 Seasoned TSX:SXP traders know the crypto road is fraught with twists. Should our breakout hope hover on the brink yet veer off course, gear up for a bullish bounce from the support at $0.3862, integrating this into our adaptive battle plan.
💎 And, should #SXP fall beneath this key level, it's time for a tactical regroup. Such a turn signals a critical moment for reevaluating our bullish stance, necessitating a strategy recalibration in tune with the market's pulse. 🌴💰

WAVES/USDT bullish momentum from key demand? 👀🚀waves analysis💎 Paradisers, brace yourselves for an exciting turn with #WAVESUSDT as it encounters resistance at the supply zone, paving the way for a potential bullish surge from the demand level.
💎 Through market cycles, we've observed how previous supply zones have transitioned into areas of demand, driving prices higher. Presently, with #WAVES challenging a key supply area at $3.671 there's a promising outlook for a bullish shift from this point.
💎 Conversely, if PSX:WAVES falls beneath the $3.067 level, it might signal a move towards bearish waters, prompting a strategy reassessment. A bullish push from a secondary demand point at $2.649 could be anticipated, yet breaching this could lead to further declines

GMX/USDT getting ready for potential shift? 👀 🚀 GMX Analysis💎Paradisers, prepare for an engaging trading opportunity as #GMXUSDT shows signs of an upcoming pivotal move. The market dynamics indicate a strong push from a crucial demand level at $58.88, with the price aiming to breach a significant supply zone. Our strategy hinges on confirming this transition from supply to demand before making our move.
💎Targets Post-Breakout:Upon successfully navigating past the current supply level, our sights are set on the next target at $64.55. Surpassing this will open the door to approach a higher supply threshold at $71.89. It's essential to tread carefully, as the market may present psychological traps during these transitions. A solid strategy backed by clear confirmation is crucial for moving forward.
💎Preparing for Volatility:The unpredictable nature of the market necessitates readiness for diverse outcomes. Should #GMX retreat below the $58.88 support, a bullish resurgence from the $54.10 support level might be our next focal point. A fall below this marker signals a need to recalibrate our approach, potentially considering short positions to align with the prevailing market sentiment.
💎Strategic Market Navigation:Embracing all potential market scenarios is what makes us proficient traders. By keeping a vigilant eye on market movements and maintaining a patient and strategic approach, we can navigate through market uncertainties effectively. Rest assured, the Paradise Team is here to support and guide you through every twist and turn of this thrilling trading venture!

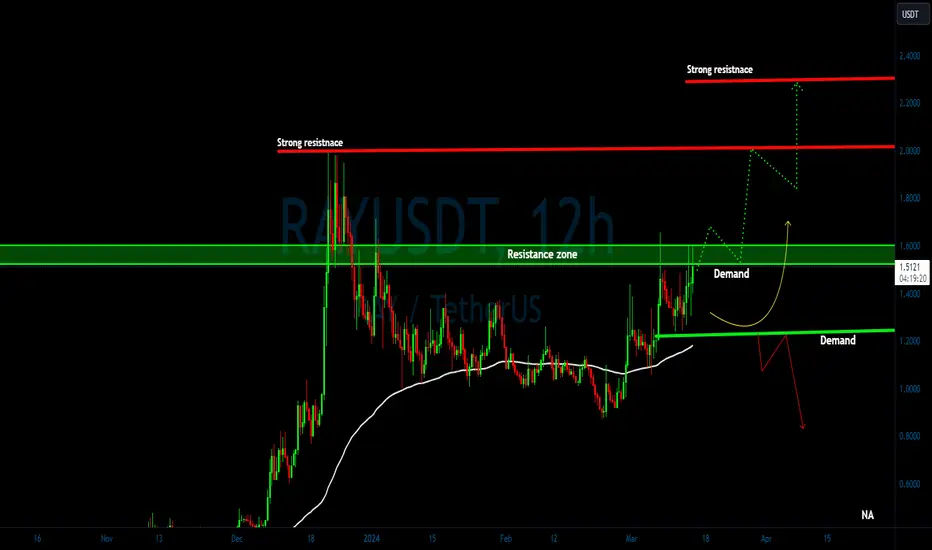
RAY/USDT assessing key resistance ? 👀 🚀RAY Today Analysis💎Paradisers, your focused attention is warranted as #RAYUSDT exhibits notable action around the crucial resistance level of $1.5001. A breakthrough and sustained momentum above this mark could herald a significant bullish journey towards tackling the next tier of resistance.
💎Navigating #RAY's Momentum: As #RAY vies to uphold its drive from its current support, strategic acumen becomes imperative. We're poised to recalibrate our approach in harmony with the dominant market sentiment. A bullish resurgence is anticipated from the support at $1.2373, emphasizing the necessity for agility and responsiveness in our trading maneuvers.
💎Market Dynamics and Strategy Adjustments: The unpredictability of the market calls for vigilance, especially if #RAY dips below the pivotal support of $1.2373. Such a move would suggest the bears are in control, steering us towards a bearish phase. Such indicators are critical for timely strategic adjustments, signaling a pivotal moment for market reevaluation.
💎Strategic Vigilance and Support: Amidst market volatility, a diligent watch on essential signals and readiness to adapt strategies is essential. Your prowess in modifying your approach in response to shifting market sentiments is invaluable for adeptly navigating the crypto market's uncertainties. Rest assured, the Paradise Team remains at your side, providing guidance and insights to foster informed decision-making in this dynamic trading landscape.
HBAR/USDT Keep an eye on the support, Potential Bouncing!💎 HBAR has recently experienced notable market dynamics. There is potential for HBAR to undergo a backtest on the support area around $0.099.
💎 If HBAR reaches this level, it needs to bounce to resume its upward trajectory, with the next target being the resistance area. A successful breakout above this resistance probability could pave the way for reaching our target area.
💎 However, if HBAR fails to maintain support and bounces, it could be a concerning sign. This failure may lead to a breakdown below the support area, potentially pushing the price back towards the demand zone.
💎 At the demand zone, a bounce is necessary for HBAR to reclaim support and continue its upward movement. Failure to do so may result in continued downward movement, pushing the price lower.

LPT/USDT Keep an eye on the support, potential bounce back to UP💎 LPT has recently encountered significant market dynamics, experienced rejection and forming a double-top pattern in the hourly timeframe. If this pattern holds true, there is potential for LPT to undergo a retest of the support area around 16.5.
💎 If LPT shows signs of bullish rejection at the support, such as forming bullish candle patterns, there is potential for the price to bounce and resume its upward trajectory, potentially testing the strong resistance area once again.
💎 However, if LPT fails to bounce when it reaches the support area, and even breaks down below it, it would signal bearish momentum, with the price potentially targeting the demand area.
💎 When LPT reaches the demand area, it must bounce and reclaim the area above the support at 16.5. A successful bounce would indicate a potential return to upward movement. However, failure to do so could lead to continued downward movement, with the price potentially declining further.

LIT/USDT Keep an eye on the demand, Potential bounce back to UP!💎 LIT has recently experienced significant market dynamics, encountering a strong rejection in the supply area.
💎 There is potential for LIT to undergo a retest of the demand area around 1.25. A positive sign in the demand, such as a bullish candle rejection, could signal a bounce in price and a return to upward movement, potentially testing the strong resistance area once again.
💎 However, if LIT fails to bounce when it reaches the demand area, and even breaks down below it, it would indicate bearish momentum, with the price potentially targeting the Bullish OB area around 1.035.
💎 When LIT reaches the bullish OB area, it's crucial for it to bounce and resume its upward trajectory. Failure to sustain this area, resulting in a breakdown, could further signal bearish sentiment and lead to continued downward movement for the price.

CRO/USTD bullish reversal from support? 👀 🚀CRO analysis💎 Heads up, Paradisers! #CROUSDT is on the brink of a bullish shift, eyeing a rebound from the critical support at $0.12303. If it keeps up the momentum here, we're likely to see a bullish journey, given this level has held firm three times before, underscoring its reliability as strong support.
💎 Should the climb of #CRO start to falter and dip below $0.12303, we'll turn our attention to a vibrant demand zone at $0.10938. With ample liquidity awaiting, there's a solid chance for a bounce back from this pivotal level.
💎 Alertness is essential: a breach below this lower support could signal a deeper slide, as market sentiment may swing towards a sell-off. Stay on your toes, traders, as we navigate through #CRO's market shifts.

ROSE/USDT assessing key support? 🚀ROSE Today Analysis💎 Attention, Paradisers! #ROSEUSDT is making waves, closely adhering to the $0.14161 support level, paving the way for a bullish surge. A successful validation of this support could lead to a decisive upward move, breaking through higher resistance barriers.
💎 However, if #ROSE's ascent begins to lose steam and it falls beneath the $0.14161 support, our gaze will shift towards a deeper safety zone at $0.12540. Notably, we've spotted a cup and handle formation when the price hovers around this demand level, offering a prime setup for a bullish assault.
💎 Staying vigilant is key: dropping below this additional support level might indicate a further downturn as the market tilts towards sell-off. Keep a sharp lookout, traders, as we tackle the evolving dynamics of the #ROSE market.

TRB/USDT Keep an eye on the OB potential significant bouncing!💎 TRB has recently shown significant market dynamics, with potential for a retest of the bullish order block (OB) area before a significant breakout from the descending channel.
💎 However, if TRB breaks the pattern without first retesting the bullish OB area, it could still continue its upward movement and potentially reach our target strong resistance area.
💎 When TRB reaches the bullish OB area, it's crucial for it to bounce and resume its upward trajectory.
💎 Failure to sustain this area, leading to a breakdown, could signal bearish momentum and result in further downward movement for the price.

ARB/USDT planning bullish ride from support| 🚀ARB Analysis💎 Paradisers, get ready for a significant move with #ARBUSDT. It's edging closer to a previous resistance, signaling a potential bullish path ahead. If it can turn this resistance into support with a successful retest, expect a vigorous surge past the $1.5704 mark.
💎 On the other hand, should #Arbitrum's climb stumble and it falls below the $1.5704 mark, we'll turn our attention to the next safety net at $1.3494. This level's deep liquidity pool could serve as a Launchpad for a bullish rebound.
💎 Keep your eyes peeled: falling through this secondary support might indicate a steeper decline as traders lean towards offloading. As always, vigilance and readiness to act on these shifts are key to trading success as we explore the #ARB market's twists and turns..

REEF/USDT Indicating Bounce and continue upward movement.💎 REEF has recently exhibited significant market dynamics. Currently, it has bounced after retesting the demand area around $0.00316.
💎 If this bounce holds, it's probability that REEF will resume its upward movement and retest our target area.
💎 However, if REEF fails to maintain this support area and breaks down below $0.00316, it could signal a bearish trend continuation. In such a scenario, the next potential support area is around $0.0023.
💎 At the support area, it's crucial for REEF to bounce and reclaim the area above the demand zone to sustain its upward momentum. However, if REEF fails to do so and breaks down below the support, it could lead to further downward movement.

TIA is at the key Support zoneTIA is at the key Support zone
🔵Entry Zone 13.72 - 14.07
🔴SL 12.3444
🟢TP1 15.0352
🟢TP2 16.7800
🟢TP3 18.5288
Risk Warning
Trading Forex, CFDs, Crypto, Futures, and Stocks involve a risk of loss. Please consider carefully if such trading is appropriate for you. Past performance is not indicative of future results.
If you liked our ideas, please support us with your likes 👍 and comments.

ZRX/USDT bullish momentum? 👀🚀ZRX Today Analysis💎 Paradisers, focus on #ZRXUSDT, which is currently positioned in a demand zone and indicating a readiness for a bullish shift.
💎 #ZRX recently encountered resistance at $0.6248, followed by a significant sweep of liquidity above that level, leading to a pronounced downturn. It's now gathering momentum in the demand zone at $0.3168. Maintaining strength above this level could set the stage for an upward trend, targeting the notable supply zone back at $0.6248.
💎 Nonetheless, should #ZRX face challenges in holding its position above the $0.3168 demand level, a strategic reassessment may be required. In this scenario, our strategy would pivot to anticipate a bullish rise from a more conservative support level at $0.2383. Notably, a descent below this level could trigger a substantial downward movement.

SXP/USDT upward momentum from demand zone? 👀SXP Analysis
💎 Paradisers, turn your attention to #SXPUSDT, which is currently showing promising signs of an upcoming move from a key demand level.
💎 #SXP is tracing an upward path, indicating a potential bullish breakout from its current demand level. It's anticipated to retest the demand level at $0.3452 before continuing its upward trajectory. If #SXP can maintain its position above this level, it sets the stage for an ascent towards the significant supply zone at $0.5390.
💎 Nonetheless, should #SXP encounter resistance in holding its ground above the $0.3452 level, a strategic shift in our trading approach might become necessary. In that case, we would adjust our focus towards initiating a bullish movement from a slightly lower demand level at $0.3106.
💎 Keeping a vigilant eye on this level is critical, as a drop below it could necessitate a strategic shift, potentially highlighting challenges in maintaining a bullish momentum in the #SXP market.

SNX/USDT upward momentum? 👀 Synthetix Today Analysis💎Paradisers, zoom in on #SNXUSDT, as it's showing clear signs of an impending major move from a critical demand level.
💎#Synthetix is currently on an upward swing, hinting at a bullish continuation. It's been tracking a descending channel pattern, consistently respecting the channel's resistance. We're anticipating a retest at the demand level of $3.091, which could set the stage for a continued upward momentum. A successful hold above this level for #SNX might open the path to a significant resistance zone at $4.769.
💎 However, should #SNX encounter obstacles in maintaining its position above the $3.091 threshold, a strategic recalibration may be required. In such a scenario, we would consider shifting our focus to a bullish ascent from a secondary demand level at $2.709.
💎 Monitoring this level is essential, as failing to sustain it could indicate a shift towards a more bearish trend in the #SNX market.

MINA/USDT gearing up for bullish move?👀🚀Mina Analysis💎 Paradisers, get ready for a potential bullish run with #MINAUSDT, as it begins to exhibit signs of an upswing from a strong demand zone.
💎 Our current analysis indicates that #MINA is encountering resistance at the supply zone around $1.3182. With market sentiments currently leaning towards the sellers, there's a considerable chance we might see the price dip before regaining strength. A pivotal moment awaits at the demand level of $0.9750; if #MINA can sustain momentum here, we're likely to witness a robust bullish movement.
💎 In the event that #MINA does not follow the above trajectory, pay close attention to the demand level at 0.8034. This level is critical, acting as a Point of Interest (POI) owing to its significant liquidity. If the upward trend falters, we anticipate a bullish rebound from this mark. However, should the price fall below this level, we could see a marked downward trend.

FIDA /USDT what next? Bull ride 👀 🚀 FIDA today analysis💎 Paradisers, it's time to focus on #FIDAUSDT as it's showcasing an intriguing move, stemming from a specific pattern formation, and setting the stage for its next potential movement.
💎 Recently, #FIDA has broken to a new low, creating a lower low pattern. This development leads us to anticipate a formation of a lower high. Following this, the price has reclaimed the demand level at $.2694, setting up a strong likelihood of a bullish movement, with sustained upward momentum targeting the supply zone at $.4837.
💎 However, if #FIDA struggles to continue its bullish trajectory while reclaiming the demand level, we might see a bullish rebound from a lower demand point at $0.2341. A break below this level could lead to a significant downward movement.

MAGIC/USDT bullish momentum from demand ? 👀🚀Magic Analysis💎 Paradisers, it's time to cast our focus on #MAGICUSDT, as it's currently displaying indications of a bullish continuation from its present demand zone.
💎 From our previous observations, #Magic has shown a pattern of making an equal high trajectory followed by a decline. Currently, it's showing an increased likelihood of a bullish move from the demand level at $1.0557. If the price sustains its momentum at this level, we might witness a bullish climb towards the bearish Order Block (OB).
💎 However, as astute traders, we always keep an eye out for alternative scenarios. If #MAGIC fails to hold the demand level at $1.0557, we should be prepared for a potential bullish rebound from a lower demand level at $0.9363. Be aware that breaking below this level could trigger a substantial downward trend.
