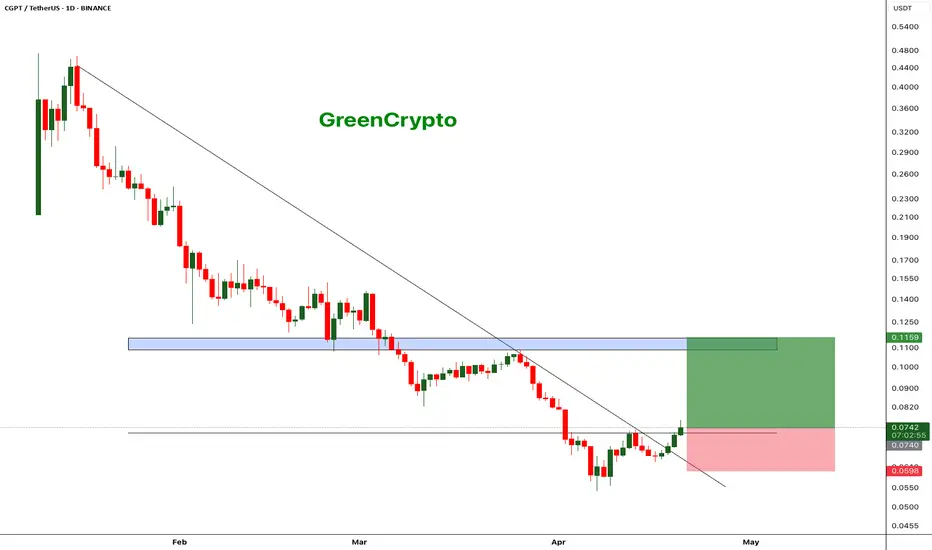
CGPT - Decent Swing Trade Opportunity $BINANCELCGPTUSDT (1D CHART) Technical Analysis Update
CGPT is currently trading at $0.0740 and successfully broke out from the local resistance and heading towards the next resistance. This gives a good opportunity for a quick swing trade with tight stoploss.
Entry level: $ 0.0740
Stop Loss Level: $ 0.0599
TakeProfit 1: $ 0.0818
TakeProfit 2: $ 0.0952
TakeProfit 3: $ 0.1114
Max Leverage: 2x
Position Size: 1% of capital
Remember to set your stop loss.
Follow our TradingView account for more technical analysis updates. | Like, share, and comment your thoughts.
Cheers
GreenCrypto
Cryptosignal
MEMEFI/USDT Bearish Rejection at Supply Zone Incoming? Down!!Price is currently approaching a key supply zone after a sharp drop, with signs of weakness on the lower timeframe. The recent bullish push appears corrective, forming a potential lower high structure.
Looking for price to tap into the highlighted supply area and show rejection — this could confirm a short opportunity.
Entry: 0.00447
Stoploss: 0.00466
Target:
• TP1: 0.00428
• TP2: 0.00412
• TP3: 0.00398
• Final TP: 0.00370
This setup aligns with a bearish continuation bias unless price breaks cleanly above the zone.

LTC Holds Key Support, Eyes ResistanceFenzoFx—Litecoin bounced from the $81.80 support level and is currently trading around $84.60, just below the 50-period simple moving average. As long as LTC stays above $81.80, the outlook remains bullish, with potential to retest the $88.50 resistance.
A drop below $81.80 would invalidate the bullish view and could trigger a move toward the $77.40 support.
***
>>> No Deposit Bonus
>>> %100 Deposit Bonus
>>> Forex Analysis Contest
All at FenzoFx Decentralized Forex Broker

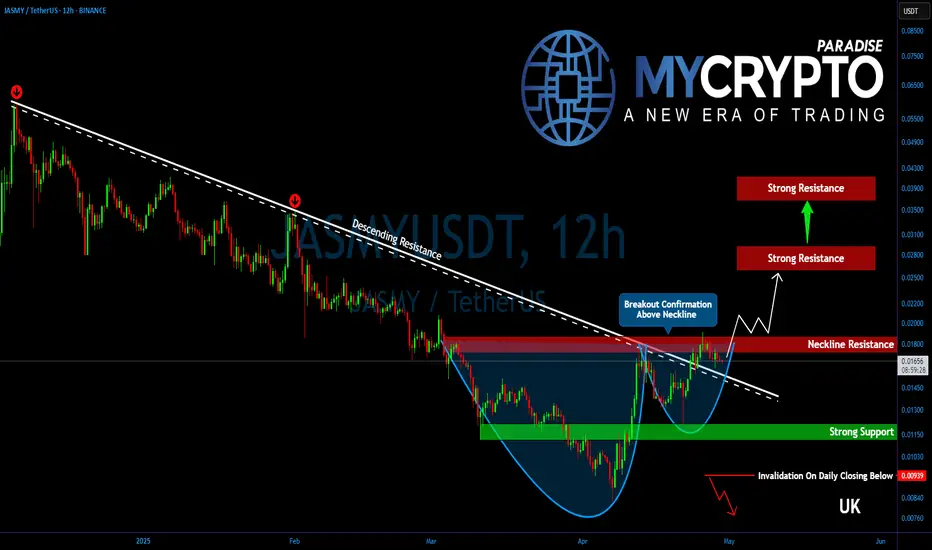
Is JASMY Ready for a Massive Comeback? Key Levels to Watch!Yello, Paradisers! After months of relentless selling, could #JASMY finally be staging a comeback? Let's dive into its key technicals:
💎After an extended and painful downtrend, JASMY has finally broken out of its multi-month descending trendline resistance. This significant technical breakout marks the first step toward a potential broader recovery. Moreover, the price action is shaping a potential cup and handle formation—a powerful bullish continuation pattern—which strongly suggests that the recovery momentum still has further room to run.
💎At the moment, #JASMYUSDT is battling a crucial resistance zone between $0.01750 and $0.01850. This area serves as the neckline resistance of the developing bullish structure. A clean and convincing breakout above this zone would trigger a major shift in momentum, potentially setting up JASMY for a back-to-back bullish breakout.
💎Should bulls succeed in pushing above this resistance, the next immediate target lies at $0.02500 to $0.02750—a heavy supply zone that coincides perfectly with the 50% Fibonacci retracement. This level is expected to attract some strong profit-taking.
💎However, if bullish strength continues to hold firm even after that, JASMY could extend its rally toward the 61.8% Fibonacci retracement zone, located around $0.03650 to $0.04000. This region is historically known to be a "golden pocket" for reversals and thus demands maximum caution. If signs of exhaustion emerge near this zone, it could potentially mark a medium-term top.
💎JASMY’s first primary support now sits at $0.01500. Below that, a firmer, more critical support base exists between $0.01150 and $0.01100—a zone that has already proven capable of withstanding strong selling pressure in the past.
Paradisers, strive for consistency, not quick profits. Treat the market as a businessman, not as a gambler.
MyCryptoParadise
iFeel the success🌴
FETUSDT.P Breakdown Incoming? Supply Zone + Rising Wedge FET just tapped into a strong supply zone and formed a rising wedge — usually a bearish sign. Price looks weak here and might break down soon.
If the wedge breaks, I’m looking for a short setup.
Entry: 0.716 - Wait for breakdown
Stoploss: 0.746
Target 1: 0.685
Target 2: 0.657
Target 3: 0.607
Waiting for confirmation before jumping in. Let’s see how it plays out.

TUT Analysis (2H)From the point marked as "start" on the chart, the TUT correction has begun.
It appears to be an ABC correction, and we are currently in wave B of this ABC.
Wave B seems to be a complex correction, possibly a triangle or a diametric, and we are currently in wave c of B.
Wave c of B itself appears to be forming a symmetrical pattern.
It is expected to move toward the red box while maintaining the green zone.
The targets are indicated on the chart.
A daily candle closing below the invalidation level would invalidate this analysis.
For risk management, please don't forget stop loss and capital management
Comment if you have any questions
Thank You

SHIBUSDT Is Flashing Major Bearish Warnings – Are You Ready??Yello Paradisers, Have you been keeping an eye on SHIBUSDT? If not, now is the time. The market is showing clear signs of weakness that could lead to a significant bearish move, and many traders may not be prepared for what’s coming.
💎SHIBUSDT is currently looking bearish after forming a clear bearish Change of Character (CHoCH) on the higher timeframe. Adding to this, the price action on the lower timeframe is showing an internal Change of Character (I-CHoCH) originating from a 4-hour bearish Order Block (OB). This setup substantially increases the probability of a continuation to the downside.
💎What we are focusing on now is the potential pullback. If SHIBUSDT pulls back to fill the Fair Value Gap (FVG) or develops a bearish pattern from the Order Block, it would provide a strong short opportunity with an excellent risk-reward profile.
💎However, it is crucial to remain cautious: if the price breaks out and closes a candle above the identified Order Block, it would completely invalidate the bearish idea, and we would need to step aside from any short positions.
Remember, Paradisers, sustainable trading success comes from patience and disciplined execution. There is no need to rush. Waiting for confirmation will always keep you on the winning side. Be smart, wait for the right setup, and always trade like a professional. This is the only way you will make it far in your crypto trading journey.
MyCryptoParadise
iFeel the success🌴

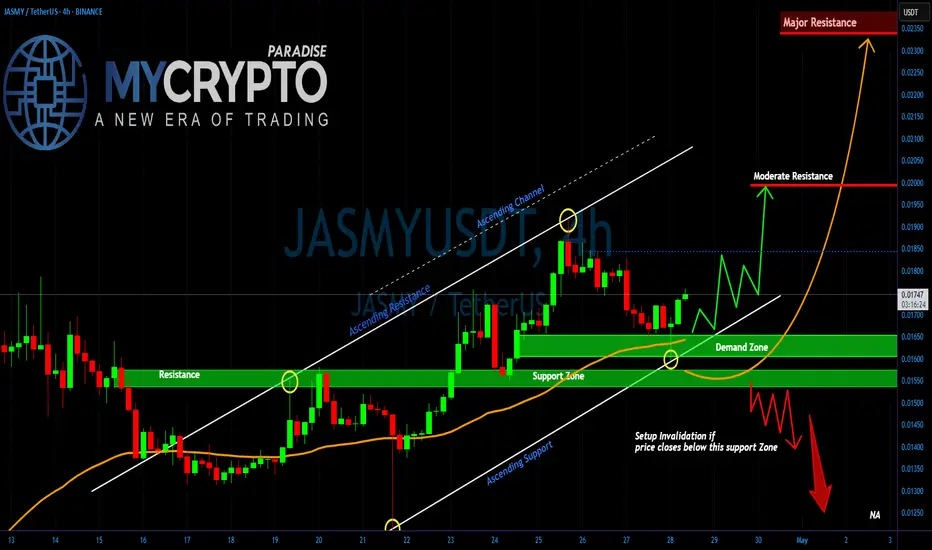
JASMY at a Breaking PointYello, Paradisers! Have you been watching JASMY closely? If not, you might be about to miss one of the most explosive opportunities we've seen in recent days. A major breakout or breakdown is brewing, and the market is preparing for a decisive move!
💎Right now, #JASMYUSDT is sitting above a critical Demand Zone after successfully flipping a strong historical resistance into support. Price action is following an ascending structure, respecting both the Ascending Support and the broader Ascending Channel pattern. As long as the price continues to hold this support region and maintain the bullish market structure, there is a high probability of a breakout towards the Moderate Resistance level around 0.01994. A clean break above this area could fuel a sharp rally straight towards the Major Resistance zone at 0.02337.
💎However, caution is absolutely necessary here. If JASMY fails to hold the current Demand Zone and we see a confirmed close below the support at 0.01540 level, it would invalidate the bullish setup. In that case, a rapid sell-off is likely, with downside targets opening towards the 0.01397 region and possibly even lower levels. This would create a high-risk environment where inexperienced traders could get trapped very quickly.
Stay focused, Paradisers. Be the hunter, not the hunted.
MyCryptoParadise
iFeel the success🌴
SUI/USDT.P Short Setup — Ride the Wave to Profits!Trade Details:
Entry: 3.56 - 3.6 USDT
Stop-Loss: 3.6935 USDT
Take-Profit Levels:
TP1: 3.4215 USDT
TP2: 3.2700 USDT
TP3: 3.0640 USDT
With clear targets set and a tight risk management strategy, this setup offers a great opportunity to ride the wave of the market’s next move.
Patience and discipline are key. Stay focused, follow your plan, and let's make this trade count!

CHZ 50x plus tradeTraders,
Here we are again pointing out an amazing trade idea for you, the solicitors 👧🏿 and dealers 🙍🏿♂️who will likely end up transacting all of your winnings with! CHZ a great wagering project that will make you a killing this run. This one is cut and dry, we have a wedge pattern along with a possible flag that will likely play our by the end of this year!
We hope you enjoy the free trades that we have been sharing from the VIP group and look forward to seeing you enjoy these gains year round if you come check us out!
As always, stay profitable folks!
Savvy!

ETH Rejection Incoming? Don’t Fall for This Bull TrapYello Paradisers, are you watching how ETH is reacting right now at this key zone? This could either turn into a textbook bearish setup… or catch everyone off guard. Let’s break it down 👇
💎ETHUSDT is currently hovering at a critical resistance area, perfectly aligned with both a key Fibonacci retracement zone and the 200 EMA—classic confluence. What makes it even more concerning is the bearish divergence, which is strengthening the probability of a downside rejection from this level.
💎To add fuel to the fire, the price action has just taken liquidity (inducement) above the previous highs, another bearish signal that supports the idea of a potential reversal from here.
💎However, this bearish bias will be fully invalidated if ETH manages to break and close a candle above the resistance zone. That kind of price action would suggest strength from buyers and a likely continuation to the upside.
💎In that case, it’s wiser to stay patient and wait for a cleaner setup at a better price. Rushing into a trade at this stage, especially in a moment of indecision, is not how pros operate.
If you want to be consistently profitable, you need to be extremely patient and always wait only for the best, highest probability trading opportunities.
MyCryptoParadise
iFeel the success🌴

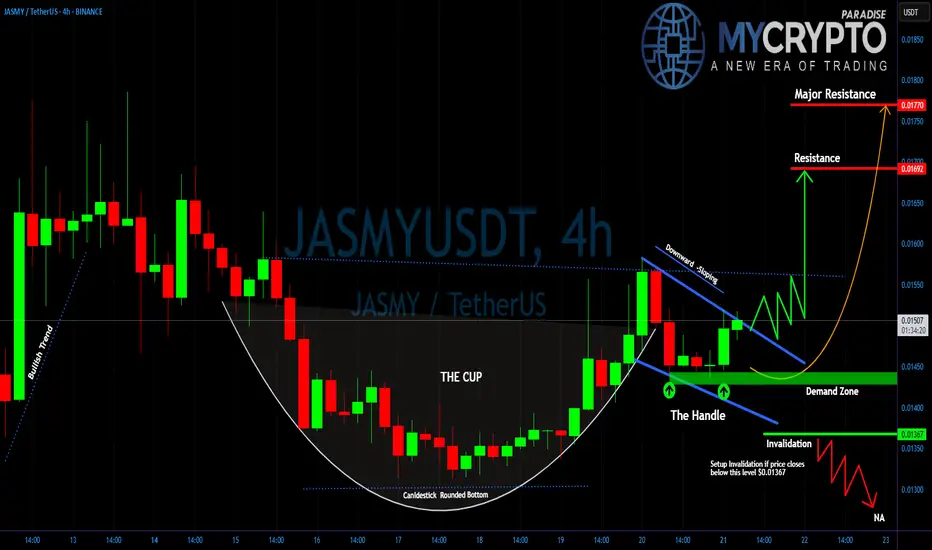
JASMY: Will You Catch the Breakout or Get Caught in the Trap?Yello Paradisers, did you catch the textbook pattern quietly forming on JASMY while most of the market remains distracted? Because what comes next could catch the majority off guard.
💎#JASMYUSDT is currently forming a classic Cup and Handle pattern. After a strong impulsive move, the price retraced in a rounded bottom structure, completing what now looks like the cup. The current consolidation has created the handle a downward-sloping corrective move that’s showing early signs of exhaustion.
💎What adds even more strength to this setup is that the price is now trading above both the 50 EMA and 200 EMA on the 4H timeframe. This signals a solid bullish bias and confirms that the overall momentum remains in favor of the bulls. When the price holds above both moving averages during a consolidation phase, it often indicates that a strong continuation move is brewing.
💎The price is also respecting a well-defined demand zone between 0.01430 and 0.01450. As long as this area holds, the probability of a bullish breakout remains high. A break above the descending handle resistance will be the first true confirmation.
💎If that breakout is supported by volume and sustained price action, we expect a move toward the first resistance at 0.01698. Beyond that, the final target for this pattern lies at the major resistance zone around 0.01785, where significant selling pressure could return. However, discipline is key. If JASMYUSD breaks below 0.01367, the handle structure would be invalidated.
Stay focused, Paradisers. Be the hunter, not the hunted
MyCryptoParadise
iFeel the success🌴
APT Is Squeezing Into a Reversal Pattern at a Key Weekly Level!Yello, Paradisers! Is #APT quietly gearing up for one of the cleanest reversal plays we’ve seen in weeks?
💎After a long, relentless downside trend, APT is now starting to show signs of life. The price action is compressing inside a classic falling wedge pattern, and more importantly, this is happening right at a weekly key level — the kind of setup that usually leads to significant shifts when confirmed.
💎What’s adding more weight here is the emergence of a bullish divergence on the indicators, suggesting that while price has been making new lows, momentum has already begun to turn. That’s often one of the first early signs of a coming reversal and it’s starting to gain strength.
💎#APTUSDT is now pressing against a decisive resistance zone. The price is testing the 12-hour EMA-50, currently sitting around $5.33, and just slightly above that, the wedge breakout trendline stands at approximately $5.45. These two levels are acting as the immediate gatekeepers for a bullish shift.
💎Breaking through both of these zones will be crucial. If the bulls succeed, we can expect a push toward the $7.00 – $7.35 region — a zone where short-term traders may look to take profits. However, if the momentum continues, the bigger step lies ahead.
💎A sustained breakout could carry APT to the pattern target of $8.75 – $9.25 area. This is a strong resistance zone and this is where things get more challenging. The resistance in this range is reinforced by multiple technical confluences, including the 50% Fibonacci retracement, which often acts as a magnet but also a serious barrier during recoveries.
💎On the flip side, support remains solid. Immediate support is at $4.95, while beneath that, APT sits on a major structural base that has historically held firm. Sellers will need serious volume to crack below this foundation and for now, that pressure isn’t there.
Paradisers, strive for consistency, not quick profits. Treat the market as a businessman, not as a gambler.
MyCryptoParadise
iFeel the success🌴

FARTCOIN/USDT.P – Smells Like a Clean Short Entry’s cooking, and this setup is dripping with RR juice. Let's break it down:
📍 Entry Gameplan:
Short Zone: 1.0660 – 1.0710
SL: 1.1195 (tight and right above the wick)
TP1: 1.025
TP2: 0.9835
TP3: 0.9055 (send it 💨)
Why I Like This Setup:
That choch ➝ BOS combo? Chef's kiss.
Price tapped into supply and reacted fast = strong sellers present
Beautiful RR — no overcomplications, just structure, imbalance, and timing
This thing's been cooking sideways long enough. Now that it’s broken structure and filled its pockets with early buyers, we might finally see a solid dump.
Let’s see if FART delivers the gas.

FINAL LEG OF THE ZIGZAG CORRECTION ?Yello, Paradisers! Are we about to see the end of this correction, or is there still one more shakeout coming? Let’s break it down.
💎The market is currently unfolding within a Zigzag Correction (A-B-C) pattern, and we appear to be in Wave C the final leg of this structure. Wave A has already played out with a sharp downward move, followed by Wave B, which acted as a countertrend rally. Now, Wave C is in progress, forming the last phase of this corrective cycle.
💎Since this is a 5-3-5 Zigzag Correction, the third wave of Wave C has already developed, meaning the market is nearing a critical Demand Zone at 4.0283. This level is a strong support zone where a potential reversal could occur. If the price reacts positively from this area, it could mark the end of the correction and signal the beginning of a new bullish phase, starting Wave 1 of the next uptrend.
💎However, if the price remains trapped between the Moderate Support and Moderate Resistance zones, we may see an extended period of sideways consolidation before any decisive move. A key confirmation to watch is the RSI approaching oversold conditions, which would indicate that downward pressure is weakening and the probability of a bullish reversal is increasing.
As always, Paradisers, the key to profiting in this market is waiting for high-probability setups. If this correction is indeed ending, the next move could be explosive. Stay sharp, stay disciplined, and trade smart!
MyCryptoParadise
iFeel the success🌴

Is #XLM Setting Up for a Bull Trap Before a Major Drop?Yello, Paradisers! Is XLMUSD gearing up for a breakout, or is this just a classic liquidity grab before the next major dump? Let’s break it down.
💎Right now, #XLMUSDT is testing a minor resistance at $0.28464, a level where price has repeatedly struggled to push higher. While there is a possibility of a breakout, the presence of strong liquidity around the unmitigated supply zone at $0.31917 suggests that any move higher could be a trap before a significant drop. If price does manage to break above this resistance, traders should be cautious it’s likely just a liquidity grab before a larger move to the downside.
💎Once the price reaches the unmitigated supply zone, a rejection is expected, leading to a downward move toward the key support zone at $0.22699. This level has historically been a strong demand area where buyers could step in, potentially causing a temporary bounce or consolidation before any further downside.
💎As CRYPTOCAP:XLM moves lower, it’s crucial to watch volume activity. If the decline happens with high volume, it will confirm strong selling pressure and increase the likelihood of a deeper drop. However, if the price approaches $0.22699 with low volume, it could indicate a lack of seller conviction, leading to a short-term bounce before resuming the downtrend.
💎The EMA 200 continues to act as dynamic resistance, reinforcing the bearish outlook. As long as price fails to hold above $0.28464 or gets rejected from the supply zone, the bearish setup remains intact. In that case, a move toward $0.22699 and potentially even $0.19151 becomes highly probable. Watching volume reactions at these key levels will be essential to confirm the next move.
💎The only scenario that could invalidate this bearish setup is a strong close above $0.36172 with high volume. That would signal a potential shift in market structure and could indicate renewed bullish momentum.
Paradisers, patience and precision are key in this market. Let the levels guide you, trade strategically, and stay disciplined. Avoid emotional decisions this market punishes the impatient and rewards those who stay focused.
MyCryptoParadise
iFeel the success🌴

MAGIC Sell/Short Setup (1D)The symbol MAGIC has started a strong momentum towards the Supply zone. Since there haven't been significant pullbacks during this powerful move, and the supply zone is fresh and untouched, a price rejection is expected. If the price reaches the supply zone, we anticipate a rejection and will be looking for sell/short positions within the supply zone.
Targets are marked on the chart.
A daily candle closing above the invalidation level will negate this outlook.
For risk management, please don't forget stop loss and capital management
When we reach the first target, save some profit and then change the stop to entry
Comment if you have any questions
Thank You

SOLUSDT Breakdown WarningYello Paradisers! Have you spotted what’s happening with SOLUSDT right now? A major breakdown just played out, and this could be the beginning of a much deeper bearish move that many are underestimating.
💎SOLUSDT has broken down from a rising wedge pattern—an important bearish structure that often signals upcoming downside pressure. Before the drop, it swept liquidity, a typical smart money move, and has now confirmed a bearish Change of Character (CHoCH). This combination significantly increases the probability of further decline.
💎If we see a pullback into the resistance zone—it could offer a strong short opportunity with good risk-to-reward ratio. That’s where professional traders start looking to position themselves carefully.
💎However, this bearish idea has a clear invalidation point. If price breaks out and closes a candle above that invalidation level, then the bearish outlook becomes void. In such a case, it’s wiser to stay patient and wait for more precise, high-probability setups to develop.
🎖Strive for consistency, not quick profits. Treat the market as a businessman, not as a gambler. Stay disciplined, Paradisers, and wait only for the cleanest, most reliable trading opportunities. That’s how you make it in this game.
MyCryptoParadise
iFeel the success🌴

ETH Tests The $1,623 Level as SupportFenzoFx—ETH rebounded at the $1,623 support level, indicating potential for an uptrend toward $1,755.
If ETH/USD drops below $1,623, it may test the 50-period SMA near $1,600, aligned with the 50% Fibonacci retracement.
>>> No Deposit Bonus
>>> %100 Deposit Bonus
>>> Forex Analysis Contest
All at FenzoFx Decentralized Forex Broker

VOXEL/USDT – The Trap Has Been Set! Short From Smart Money ZoneA clean structure-based short setup with clear risk and reward levels. Wait for bearish confirmation on entry zone if not already in position.
Trade Details:
• Entry: 0.124
• Stop Loss: 0.132
• Targets: 0.112 – 0.100 – 0.0828
• Leverage: Cross 10x – 15x
Key Confluences:
• ChoCH confirmation
• Price tapped into FVG + 0.5–0.618 Fib zone
• Bearish reaction expected from supply area
A clean structure-based short setup with clear risk and reward levels. Wait for bearish confirmation on entry zone if not already in position.

GMTUSDT – Trendline Breakout, and Potential for Continuation!GMT has finally shown signs of strength after a prolonged downtrend. The pair has broken out of its descending trendline, a key structure that had been capping price action for weeks. This breakout is more than just a technical event — it signals a potential shift in market sentiment 🧠.
One of the most important developments is the break above the previous lower high, which confirms a short-term bullish market structure. With this structure change, bulls have gained the upper hand — at least for now 🐂.
Currently, we are seeing what looks like a re-accumulation phase just above the breakout zone. This consolidation is healthy and typical after a strong impulse move. If GMT manages to hold above this area, we could be looking at the early stages of a bullish continuation, targeting the strong resistance zone around 0.074 🔥.
However, it’s also important to be prepared for a possible pullback. If that happens, the demand zone between 0.0487 and 0.0533 will be crucial. A retest of this zone could act as a springboard for the next upward move. 📈
🔍 Key Technical Highlights:
📉 Demand Zone: 0.0487 – 0.0533
📈 Next Target: 0.074 (Strong Resistance Area)
Final Thoughts:
Momentum is building, but confirmation is key. Watching how price reacts in the coming sessions — especially around the consolidation and demand zones — will be crucial for spotting the next big move. If bulls maintain control, we could see GMT pushing toward new short-term highs in the coming days. Patience and proper risk management are your best friends here.

Threshold Network(T) Analysis: From Bear Trap to Bullish TrendAs long as Bitcoin ( BINANCE:BTCUSDT ) and Ethereum ( BINANCE:ETHUSDT ) are in a range, it is a good opportunity to take advantage of the movement of other tokens and take a look at their charts.
Today, I want to analyze the Threshold( BINANCE:TUSDT ) project for you, which has increased by +70% .
What Is the Threshold Network?
Threshold Network is a decentralized protocol that combines cryptography and privacy to power secure, permissionless applications. It enables users to protect their digital assets through threshold cryptography—where no single party has full control—supporting use cases like private key custody, privacy-preserving smart contracts, and tokenized Bitcoin on Ethereum (via tBTC).
Reasons for Price Increase:
Token Buybacks : Threshold Network is actively buying back T tokens from the market, potentially increasing demand and positively impacting the token's price.
Halting Treasury Sales : The project has stopped selling T tokens from its treasury, signaling confidence in the token's future value and reducing potential market supply.
BitcoinWorld
Reducing Operational Expenses : By streamlining operations to save costs, the project aims for long-term sustainability in the volatile crypto landscape.
-----------------------------------------------------
Technical Analysis:
Now let's take a look at the Threshold(T) chart on the Daily timeframe .
Can we still take advantage of the increase in the price of T Token or not!? Please Stay with me.
The Threshold(T) project is moving near the Heavy Support zone($0.0189-$0.0147) and has managed to break the Resistance lines with a high-volume candle , which could be good news for the continuation of the T token's bullish trend .
The Threshold(T) Project also created a Bear Trap , which basically moves in the opposite direction of the Trap after traps on the price chart with high momentum , which is what happened here as well.
In terms of Elliott Wave theory , the T token is currently completing 5 impulsive waves after completing a Zigzag Correction(ABC/5-3-5) , which seems like we should wait for the main wave 4 and then a re-increase .
I expect the T token to start rising again from the Potential Reversal Zone(PRZ) and give us at least +30% profit opportunity .
Note: If the T token goes below $0.016, we should expect further decline and possibly a break of the Heavy Support zone($0.0189-$0.0147).
Please respect each other's ideas and express them politely if you agree or disagree.
Threshold Analyze (TUSDT), Daily time frame.
Be sure to follow the updated ideas.
Do not forget to put a Stop loss for your positions (For every position you want to open).
Please follow your strategy and updates; this is just my Idea, and I will gladly see your ideas in this post.
Please do not forget the ✅' like '✅ button 🙏😊 & Share it with your friends; thanks, and Trade safe.

Profitable Short Opportunity on RATS (6H)The RATS token is bearish in both the larger and internal structures. There is a liquidity pool below the current price, and it's expected to collect sell orders from a strong supply zone before sweeping this liquidity pool.
If the price reaches the red box, we will enter a short position.
Targets are marked on the chart.
A daily candle closing above the invalidation level will invalidate this setup.
For risk management, please don't forget stop loss and capital management
When we reach the first target, save some profit and then change the stop to entry
Comment if you have any questions
Thank You
