TRUMP/USD – Watching Key Support at 12.45–12.15 for Potential ReThe TRUMP/USD pair is consolidating near the strong horizontal support zone at 12.45–12.15, aligning with the 61.8% Fibonacci retracement of the previous bullish leg.
🔹 Key Levels & Scenario:
Support zone: 12.45–12.15 – price has repeatedly tested and held this area
Upside targets:
50% retracement at 14.096
78.6% retracement at 15.134
The pair is showing early signs of stabilization, suggesting a potential rebound toward these Fibonacci levels if the support holds.
📉 Invalidation:
A decisive daily close below 12.15 would invalidate the bullish bias and open the door for deeper retracement.
📌 Trading Plan:
Watching for price action signals (candlestick reversal or breakout) above 12.45
Targets: 14.096 and 15.134
SL: Below 12.15 for a conservative risk management approach
This idea focuses on the potential for a short-term reversal in a larger consolidation phase, supported by clear Fibonacci and horizontal confluence.
Cryptosignals

QNT BreakoutTraders,
As you can see from the BINANCE:QNTBTC pairing, that QNT looks to be ready to breakout.
As well as on the CRYPTO:QNTUSD Chart on the right hand side, we are about to see a breakout of this trend pattern which looks to be a Symmetrical Triangle. We have many other indications that this market is soon to start moving on some of these top alt coins.
This is a simple chart posted to show areas of interest when QNT moves forward toward price discovery. It is very possible to see the final target depicted on the chart on the right by the end of this alt coin season that we firmly believe started last month. Meaning we saw the bottom of the markets for the alt coins that are looking ready to start moving within the next 6-8 weeks.
Stay profitable folks,
Savvy

How To Spot The Next Big Algorand Crypto Move!In the fast-paced world of crypto trading, many traders gravitate toward intraday and scalping strategies, chasing quick profits while often ignoring the powerful signals presented by higher timeframes. Yet, the smart money — institutional players, whales, and seasoned swing traders — operate differently. They focus on bigger timeframe supply and demand imbalances to enter high-probability trades with calculated risk and substantial reward potential. One such opportunity is currently setting up in Algorand ( BINANCE:ALGOUSDT ).
Why Higher Timeframes Matter in Crypto Trading
Most crypto traders operate on the 1-minute to 15-minute charts. While this can be effective, especially with crypto intraday strategies, it often leads to overtrading and emotional decision-making. In contrast, higher timeframes — such as the daily and weekly charts — provide clearer market structure, show major supply and demand imbalances, and are less noisy.
These timeframes reveal where whales and institutions place large orders, creating impulsive moves that leave behind clues for patient traders. Ignoring these clues is akin to trading blind.
The Weekly Demand Imbalance on BINANCE:ALGOUSDT
BINANCE:ALGOUSDT is currently showcasing a textbook example of a solid and strong weekly demand imbalance around the $0.1380 level. A few months ago, this zone sparked a massive bullish impulse — a series of consecutive large-bodied white candlesticks that broke through resistance with conviction.
Such moves don’t happen randomly. They’re often the result of institutional accumulation — smart money stepping in with size. These large players create imbalances where demand far outweighs supply, causing prices to rally aggressively. The key for retail traders is to identify the origin of these moves and wait patiently for the price to return.

This Hidden Altcoin Could Explode—But Only If THIS Level Holds!Yello Paradisers, have you seen what’s quietly brewing on REZUSDT? A high-probability bullish reversal setup is forming, and if this level holds, it could lead to one of the cleanest altcoin plays we’ve seen recently. This isn’t just about one signal—REZUSDT is showing a rare confluence of bullish indicators that deserve your full attention.
💎Currently, REZUSDT is moving within a descending channel while printing a bullish divergence on momentum indicators. At the same time, a textbook W-pattern has just formed, and what makes this even more significant is that it’s happening right at a support zone. This triple confluence—descending channel, bullish divergence, and W-pattern at support—is increasing the probability of a bullish breakout in the coming sessions.
💎From an entry perspective, those looking for more favorable risk-to-reward (RR) could benefit from a deeper pullback. That would offer a higher probability setup and tighter risk management. However, for aggressive or short-term traders, the current level still offers a 1:1 RR, which, while not optimal, is acceptable under strict trade management and position sizing.
💎That said, there’s a critical invalidation point that must be respected. If the price breaks down and closes a full candle below the support zone, it would invalidate the entire bullish structure. In such a case, the only professional move is to stay out and wait for cleaner confirmation or a better-developed setup. There is no room for hope in trading—only strategy and discipline.
🎖Strive for consistency, not quick profits. Trade smart, Paradisers. This setup could be a gift for the patient and a trap for the impulsive. The key is always the same—discipline, patience, and strategic execution. Stay sharp, stay focused, and keep protecting your capital.
MyCryptoParadise
iFeel the success🌴

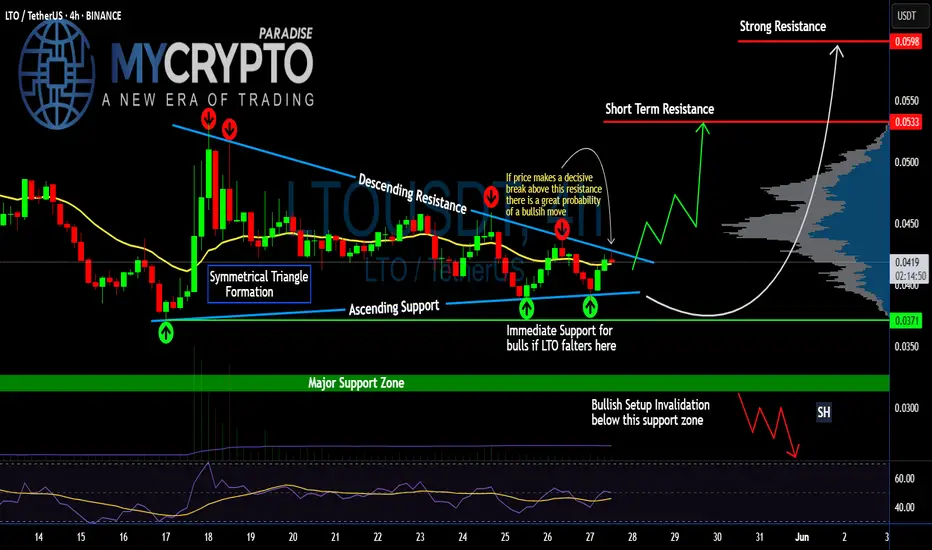
Is #LTO Ready for an Explosive Move or Another Trap Ahead? Yello Paradisers! Are you watching how #LTO is quietly tightening within a triangle while the rest of the market looks away? This might just be the last moment of silence for #LTONetwork:
💎#LTOUSDT is currently consolidating within a clean symmetrical triangle, wedged tightly between a descending resistance and an ascending support trendline. This pattern has already seen multiple touches on both edges, suggesting price is nearing the point of decision.
💎What makes this formation more compelling is how #LTOUSD is holding just above the immediate support at the $0.0371 zone and 20EMA is also acting as support. This area has acted as a launchpad twice already, keeping bullish hopes alive. Price is once again pressing against the upper boundary of the triangle, increasing the odds of a breakout on the next attempt.
💎If bulls manage to push above the descending resistance and we see a confirmed breakout with strong volume, the first upside target sits at $0.0533, which is a key short-term resistance level. From there, momentum could carry the price toward $0.0598, where a strong historical resistance lies based on the volume profile.
💎However, the bullish structure is clearly invalidated on a break below $0.0321. Any decisive move under this support zone would shift the short-term outlook in favor of the bears, potentially opening a path toward lower support.
Discipline, patience, robust strategies, and trading tactics are the only ways you can make it long-term in this market.
MyCryptoParadise
iFeel the success🌴
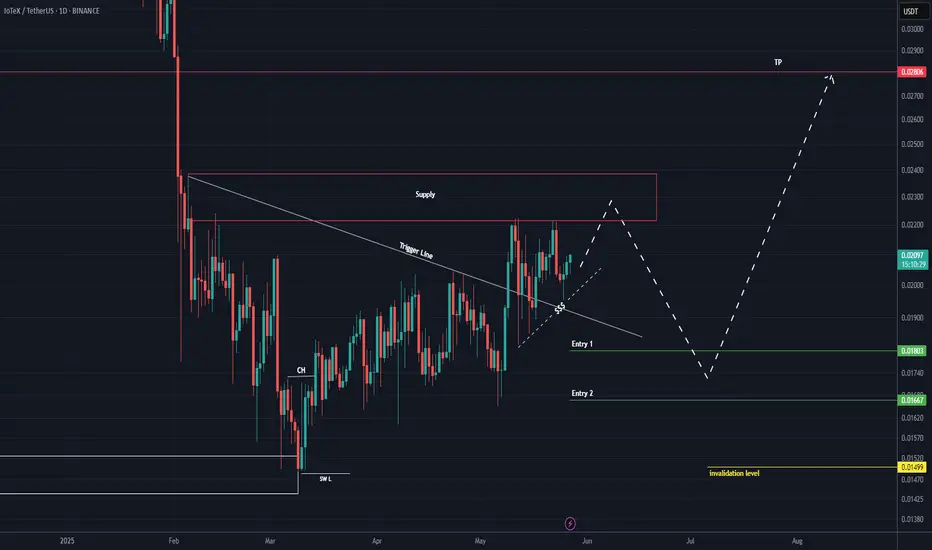
IOTX buy/long setup (1D)An important trigger line has been broken, and the price has been moving sideways for a while.
There is also a bullish CH on the chart.
It is expected that the price will make a pullback to the support zone and then move toward the supply zones higher on the chart. We are looking for buy positions at the entry points.
A daily candle closing below the invalidation level will invalidate this analysis.
For risk management, please don't forget stop loss and capital management
When we reach the first target, save some profit and then change the stop to entry
Comment if you have any questions
Thank You
Bullish Momentum Building, $112K Breakout on the Horizon?Hey Realistic Traders!
Can BINANCE:BTCUSDT Break Past $112K and Set a New All-Time High? Let’s Break It Down...
Trend Analysis
On the H4 timeframe, BTCUSDT has consistently traded above the EMA-90 line, confirming the continuation of a bullish trend. Within this trend, a falling wedge pattern formed, which is typically considered a bullish reversal signal. This pattern was followed by a breakout marked by a bullish Marubozu candle, further strengthening the bullish outlook.
In addition, a bullish crossover appeared on the oscillator, providing additional confirmation of upward momentum. Based on these technical signals, the price is expected to continue its upward move toward the first target at 113,613, with a potential extension to the second target at 117,968.
The outlook remains valid as long as the price stays above the key stop-loss level at 105,681.
Support the channel by engaging with the content, using the rocket button, and sharing your opinions in the comments below.
Disclaimer: "Please note that this analysis is solely for educational purposes and should not be considered a recommendation to take a long or short position on Bitcoin.

BONK About to Explode or Fakeout? Key Levels Are UnfoldingYello, Paradisers! Is #BONK gearing up for a face-melting rally, or is this just another trap designed for emotional traders?
💎BONKUSDT has recently formed a double bottom, a key reversal pattern that often appears before significant bullish momentum kicks in. This comes after a sustained bearish trend, and we’re now seeing signs of strength re-entering the market.
💎What’s even more interesting, a lookalike of skewed triangle pattern is starting to emerge. These often signal continuation of strength, and when paired with an already bullish reversal, it paints a potentially explosive short-term picture.
💎#BONKUSDT is currently sitting on ascending support around the $0.00001980 level. This zone is further bolstered by the EMA-50, adding extra technical significance. If BONK can continue to hold this level, the price is well-positioned to push higher toward the $0.00002470 mark, a moderate resistance zone that could serve as the next stepping stone in this bullish scenario.
💎If BONK clears this resistance with conviction, momentum could pick up rapidly, opening the doors for an aggressive move toward the $0.00003100 to $0.00003400 region. This is a critical profit-taking zone, not only because of historical resistance but also due to a dense confluence of technical barriers.
💎Zooming into the 12-hour timeframe, BONK has just entered a golden cross formation. This bullish crossover is acting as dynamic support, with the $0.00001800 level becoming an important defensive area for price stability moving forward.
Paradisers, strive for consistency, not quick profits. Treat the market as a businessman, not as a gambler.
MyCryptoParadise
iFeel the success🌴

UNIUSDT: A Massive Bullish Move Loading… or a Trap?Yello, Paradisers! Is UNIUSDT finally gearing up for a major breakout, or is this just another fake move before a deeper correction? Let’s break it down.
💎UNIUSDT is currently trading within a descending channel, increasing the probability of an upcoming bullish move. The key support zone is holding strong, and we might be witnessing the early signs of a double-bottom formation—a classic reversal pattern.
💎However, confirmation is everything in trading. To increase the probability in our favor, we need to see: Bullish divergence, Bullish I-CHoCH (Internal Change of Character), Bullish reversal patterns such as a W-pattern or inverse head and shoulders from our support zone.
💎If UNIUSDT retraces further, we expect a bounce from the strong support zone—but again, we must wait for clear bullish confirmations before taking any positions.
💎The invalidation level? If price breaks and closes candle below the strong support zone, the entire bullish setup gets invalidated. In that case, we wait patiently for better price action before considering any new trades.
🎖Patience and discipline are key, Paradisers. Many traders will get trapped in bad positions, but those who wait for the right confirmations will be the ones making money. Trade smart & stick to high-probability setups only.
MyCryptoParadise
iFeel the success🌴

Is SUSHIUSDT About to Bounce or Break? Yello, Paradisers! SUSHIUSDT is setting up an intriguing scenario after reacting to a key resistance trendline. Let’s break this down:
💎If SUSHIUSDT shows a bullish I-CHoCH (Internal Change of Character) from the key support zone—previously a resistance level—it could signal a higher probability of a bounce. However, patience is key here; we need to wait for confirmation of a bullish I-CHoCH on lower timeframes to take action.
💎On the flip side, if the price experiences further drops or shows signs of panic selling, the best approach would be to wait for it to reach a stronger support zone. At that point, we’d need to look for bullish patterns such as A W formation or An Inverse Head and Shoulders on lower timeframes to stack the odds in our favor.
💎If the price breaks down and closes a candle below the strong support zone, it will invalidate the bullish thesis entirely. In that case, it’s smarter to wait for a clearer structure to develop before considering any entries.
🎖 Remember, Paradisers, disciplined trading is the only way to achieve long-term success. Avoid impulsive decisions and always prioritize confirmation over speculation. The market rewards patience and preparation—stay sharp, stay focused.
MyCryptoParadise
iFeel the success🌴

ADA Is Approaching a Trap Zone ? Yello Paradisers, are you watching how ADA is slowly coiling up near a crucial level while pretending nothing’s happening? Don’t be fooled — this is the calm before the storm, and the next move could wipe out the unprepared.
💎#ADAUSDT is currently respecting a well-established ascending channel. We’ve already seen three meaningful reactions at the ascending support, each triggering fresh bullish momentum. At the same time, the price is pressing just above a key demand zone around the $0.73–$0.74 region. This level remains absolutely critical for the bulls to defend if the structure is to remain intact.
💎What adds strength to this setup is #ADA’s current trading position above both the 50 EMA and 200 EMA on the daily timeframe. This reinforces the short-to-mid-term bullish bias. The 50 EMA is starting to slope upward, signaling that momentum could be gradually building, while the 200 EMA sits well below as solid structural support.
💎As long as the price continues to respect the ascending support line and stays above the demand zone, we expect a continuation move toward the $0.8728 moderate resistance. A successful break and close above that could open up the next leg toward $1.0011, where a strong supply zone sits waiting.
💎The real danger lies below $0.6495. A daily close under this level would not just invalidate the current setup it would completely shift market structure and expose ADA to deeper downside, likely towards the $0.60 area or lower.
Discipline, patience, robust strategies, and trading tactics are the only ways you can make it long-term in this market.
MyCryptoParadise
iFeel the success🌴

BTC/USD Long-Term Channel Targeting 120,721 – 136,849Bitcoin continues to trade within a well-defined ascending channel on the weekly timeframe. After a healthy corrective phase, price action is rebounding strongly off the channel’s lower boundary, aligning with the ongoing long-term bullish trend.
🔹 Wave Structure and Fibonacci Extensions:
The corrective structure suggests a completed ABC pattern, with the current move potentially initiating a new bullish impulse.
Key Fibonacci extension levels:
161.8% at 120,721
200% at 130,246
224% at 136,849
These levels correspond to the upper channel boundary, providing potential long-term upside targets.
🔹 Oscillator Confirmation:
The DTOsc indicator is rebounding from oversold territory, suggesting renewed bullish momentum.
📌 Trade Idea:
Long-term bias: Bullish, targeting upper Fibonacci levels within the channel
Invalidation: A weekly close below the channel’s lower boundary (~85,000) would challenge this scenario
This chart supports a patient, long-term bullish view for BTC/USD, with significant upside targets over the coming months.

ETH/USD – Key Support Holding, Eyes on 3000 for Upside TargetEthereum is maintaining a strong bullish structure within a clearly defined ascending channel. Recent price action shows a successful retest of the lower channel boundary and the horizontal support zone around 2477 – 2450.
🔹 Support & Trendline Confluence:
The support zone at 2477–2450 is aligned with the lower boundary of the rising channel.
Multiple successful retests of this trendline indicate strong demand in this area.
🔹 Bullish Scenario:
As long as the 2477–2450 support zone holds, ETH/USD has a good chance to resume its upward move.
The next target for bulls is the 161.8% Fibonacci extension level at 2997.24, which coincides with the upper channel boundary.
📌 Plan:
Long positions are favored as long as price holds above 2450.
Targeting 2997, with intermediate steps of confirming higher lows.
📉 Invalidation:
A break and daily close below 2450 would invalidate this bullish scenario and suggest further downside.
This is a classic “buy-the-dip” scenario within an established uptrend, offering a favorable risk/reward opportunity.

C98 Buy Setup (1D)Based on the 3D pattern formed at the bottom and the breakout of the trigger line, it seems that the origin zones of the move may contain enough orders to trigger a trend reversal for C98.
A double bottom is expected to form, and the price may attempt to attack the marked supply zone.
The support zone and supply area are marked on the chart.
A daily candle closing below the invalidation level will invalidate this analysis.
For risk management, please don't forget stop loss and capital management
When we reach the first target, save some profit and then change the stop to entry
Comment if you have any questions
Thank You

SNX About to Explode or Collapse?Yello Paradisers, are you watching SNXUSDT closely? Because if not, you might be missing one of the cleanest opportunities for bulls in this current market cycle. The setup is forming right at a critical decision point — and how price reacts here could define the next major move.
💎SNXUSDT is currently showing a bullish internal CHoCH (Change of Character) while trading directly inside a strong support zone. This zone isn’t just standing alone — it’s backed by the powerful 200 EMA and a well-respected support trendline. This confluence of support significantly increases the probability of a bullish bounce from this level, making it a high-reward setup for those paying attention.
💎Zooming out to the higher timeframe, the structure becomes even more interesting. SNXUSDT appears to be forming a bull flag pattern — a bullish continuation signal that often precedes explosive upside moves. When such a formation aligns with key support zones, it suggests that the market is simply consolidating before the next leg up.
💎However, traders must proceed with caution. If price breaks down and closes below the current support zone, this would invalidate the entire bullish scenario. In such a case, it’s best to step aside and wait for better confirmation rather than rushing into a compromised setup. Emotional decisions are the fastest way to ruin sound trading strategies.
🎖Strive for consistency, not quick profits. Treat the market as a businessman, not as a gambler. Discipline, patience, and strategic entries will always outperform emotional trades. Stay focused, Paradisers — the opportunity will always favor those who are prepared.
MyCryptoParadise
iFeel the success🌴

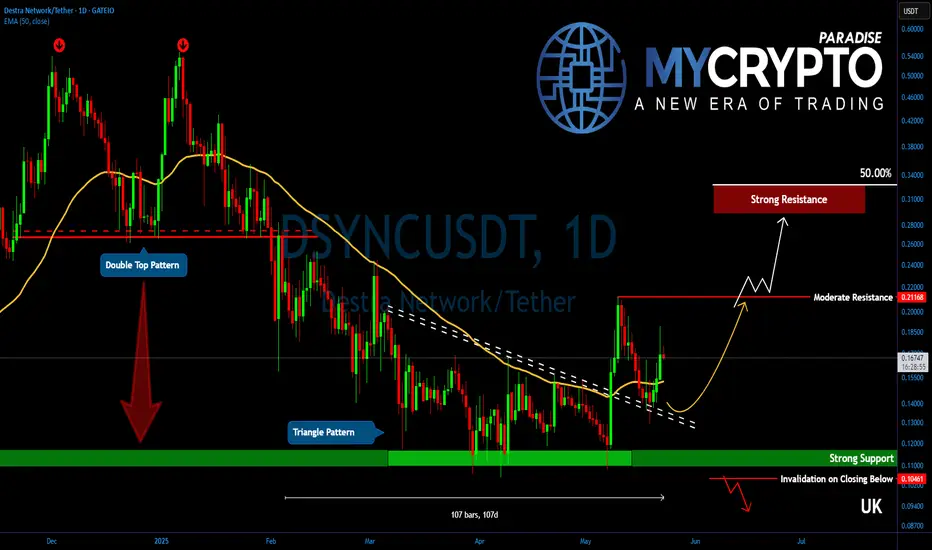
DSYNC Reversal Loading? What Happens Next Could Shock Traders!Yello, Paradisers! Have you been watching #DSYNC quietly build pressure? A major trend reversal may already be underway, and the market is only just starting to catch on.
💎After completing the full breakdown targets from its double top pattern, DSYNC is showing early signs of strength and structure. The price has broken out of a contracting triangle formation, and this breakout confirms a potential shift in trend direction. Importantly, the breakout wasn’t just technical noise rather price came back to retest the broken trendline and reacted strongly, reinforcing that this move carries weight.
💎With momentum shifting, #DSYNCUSDT is now expected to advance toward the $0.210 level. This area marks a moderate resistance and also aligns with the EMA-200, a historically significant barrier that often defines short- to mid-term market control.
💎Acceptance above $0.210 will be the green light for bulls to push towards the next major zone of $0.300 to $0.3200. This upper target range corresponds to the 50% Fibonacci retracement zone. It’s a critical area where momentum often stalls and where reversals can also emerge. Traders should treat this level with caution, as it could offer both opportunity and risk depending on how price reacts once it gets there.
💎On the downside, DSYNC remains well-protected. The EMA-50, currently sitting around $0.1520, has now flipped from resistance to support. This level has consistently acted as a major trend enforcer during bearish phases and is now working in favor of the bulls. As long as price holds above this dynamic support, the bullish bias remains intact.
💎Additionally, there is a deep and long-held base between the $0.12 and $0.11 levels. This zone has held for over 100 days without failure, and now serves as the final defense line for the bulls. If this base remains untouched, DSYNC is likely preparing for a broader upside recovery, one that could catch many traders by surprise.
Paradisers, strive for consistency, not quick profits. Treat the market as a businessman, not as a gambler.
MyCryptoParadise
iFeel the success🌴
TRUMPPPPPPPPPPPPPPPPPPPHello friends
Considering the good growth we had, you can see that the price formed a flag and corrected after reaching its ceiling.
Now, with the price correction, there is a good opportunity to buy in stages and with capital management and move towards the specified goals.
*Trade safely with us*

DOGS : be carefulHello friends
As you can see, after the price growth we had, the price has fallen. Given the severity of the fall, we recommend that you buy in stages, manage your risk and capital, and move with it to the specified goals.
*Trade safely with us*

Be prepared for everything...Hello dears
Given the recent growth, the price is stuck in a range and now that it has reached the bottom of the range, there are two options:
1_The price grows from here and hits our target.
2_The price continues to fall and falls to the support area below and our second buying step is activated and grows from there.
Buy a step and be ready for anything.
*Trade safely with us*

Should You Invest in Uniswap $UNI Crypto Right Now?Grab your popcorn, or whatever you vibe with—because today I will analyze Uniswap. Yep, the decentralized trading protocol that lets you swap tokens like Pokémon cards, but without asking mom for permission.
So, what is Uniswap? Simple. It’s like the vending machine of the crypto world. Wanna swap your Ethereum CRYPTOCAP:ETH for some Shiba Inu? Go ahead. No sign-up. It’s peer-to-peer, decentralized.
Remember those juicy monthly demand levels at $3.868 and $4.750 we discussed at the Set and Forget Trading Community? Yeah, those weren't just random numbers pulled from a bingo machine. That’s where big buyers stepped in, creating a supply and demand imbalances. Translation: There were way more people wanting to buy than sell, which made the price go UP. Magic? No. Just basic market dynamics, people.
And guess what? Those levels played out beautifully. Buyers showed up, price popped, and if you were patient, you got paid. If you weren’t… well, you can enjoy your bag of regrets.
Now, here’s where it gets interesting. The daily timeframe is now trending UP. We’ve officially seen the creation of a fresh imbalance at $5.19. That’s our new price level for buying Uniswap. But are we buying right now? NOPE.
Because here’s the golden rule of trading and investing: Patience is key. I know, I know—it’s boring. Waiting feels like watching paint dry… but on the blockchain. But trust me, the market doesn’t care about your feelings or my feelings.
We're waiting for price to pull back into $5.19, where the last big buyers left a footprint the size of a crypto whale. When will it get there? We don't know. THEN we’ll look to repurchase. Not before.
So remember—Uniswap is a beast in the DeFi world. Supply and demand is your best friend. And above all, don’t chase the pump. Let it come to you. Like a well-trained dog… or a well-behaved altcoin.

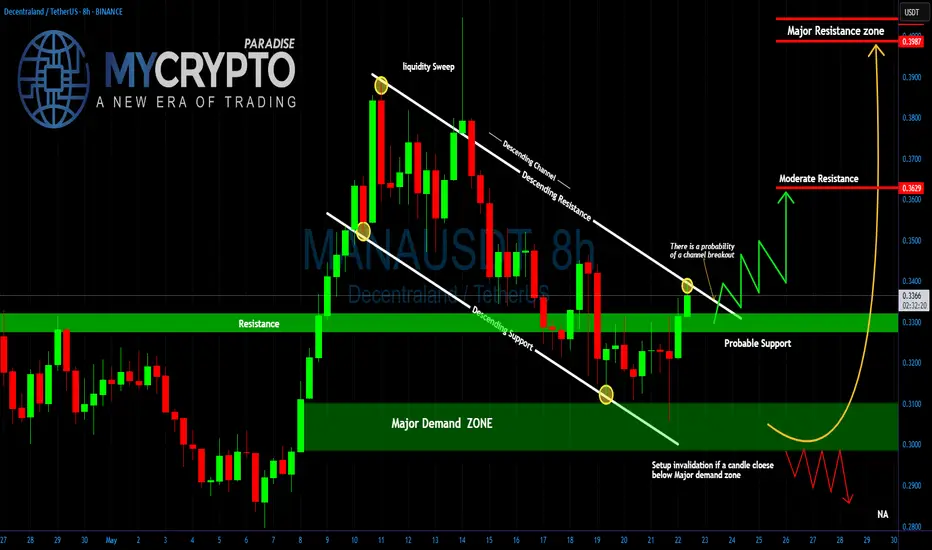
Is MANA About to Break Out?Are You Ready for It?Yello Paradisers, can you feel the calm before the storm? MANAUSDT is quietly setting up for what could become a major breakout move and most traders won’t see it coming until it’s already too late. That’s exactly the kind of opportunity we love to prepare for in advance.
💎#MANAUSDT has been consolidating inside a clearly defined descending channel, marked by consistent lower highs and lower lows since its liquidity sweep above $0.39. This cooling-off phase has allowed the market to reset after that aggressive move, but now, the structure is starting to shift.
💎What’s important here is the price action around the horizontal resistance-turned-support level near $0.33. Price is currently hovering just above this zone, and early signs of a breakout are beginning to show. A clean candle close above the descending resistance of the channel will be the confirmation signal that many smart traders are waiting for and it could set off a wave of FOMO driven momentum.
💎Below the structure, we see a well-defined major demand zone between $0.2950 and $0.3100. This is where buyers stepped in aggressively after the channel lows were tested. As long as price stays above this zone, the bullish setup remains valid. However, if we get a confirmed candle close below that demand zone, the entire structure becomes invalidated, and further downside becomes likely.
It’s not about catching every move it’s about catching the right ones with proper validation and risk control. Trade smart, Paradisers.
MyCryptoParadise
iFeel the success🌴
TRX/USDT Breakout Setup – Eyes on 0.298–0.332 Fibonacci TargetsTRON (TRX) is showing a bullish continuation structure within an ascending channel, following a breakout from a falling wedge pattern.
Currently, the price is consolidating inside a small bullish pennant, indicating a potential breakout to the upside. If this breakout materializes, it could trigger a rally toward the Fibonacci extension levels.
📌 Key Targets:
0.29849 (200% Extension)
0.31102 – 0.31222 (224% Cluster)
0.33207 (261.8% Extension)
📈 Technical Confluences:
Price is trending steadily within an ascending channel
Previous breakout from a falling wedge pattern confirms bullish sentiment
Higher lows structure remains intact
The pennant pattern typically resolves in the direction of the prevailing trend
📉 Invalidation Level:
A breakdown below the lower trendline and 0.258 support would invalidate the bullish scenario.
This chart setup offers a favorable risk/reward opportunity if the breakout is confirmed with strong volume.

BTC/USD Facing Key Resistance – Watch for Daily Close ConfirmatiBitcoin is currently testing a critical resistance zone between 107,150 and 107,800, which has previously acted as a strong supply area. For the bullish trend to continue, we need to see a daily close above this resistance range.
Until a confirmed breakout occurs, the price is vulnerable to a pullback toward the rising trendline, which has been supporting the uptrend since April.
📌 Key Points:
Strong horizontal resistance at 107,150–107,800
Rising wedge structure could signal exhaustion
A daily candle close above 107,800 is required for further upside continuation
Failure to break this resistance increases the probability of a correction toward the ascending trendline support
This is a critical area to monitor for both breakout traders and those looking for potential short-term reversal setups.
