Major Coins and Crypto Stocks Pump — Thank Landmark GENIUS BillBitcoin BITSTAMP:BTCUSD making ATHs? Old news. But Coinbase NASDAQ:COIN and Robinhood NASDAQ:HOOD hitting those record-high notes? And XRP BITSTAMP:XRPUSD dangerously close to eclipsing its own peak, while Ethereum keeps chugging along toward $4,000? Now we’re talking.
In a market-friendly twist, President Trump signed the GENIUS Act into law on Friday — a sweeping legislative win for crypto. Short for Guiding and Establishing National Innovation for US Stablecoins, the GENIUS Act marks the first major federal framework for digital assets and, more importantly for traders, triggered a firestorm of price action across the space.
Flanked by crypto executives, Republican lawmakers, and a few NFT bros in suits, Trump called the stablecoin-focused bill “perhaps the greatest revolution in financial technology since the birth of the internet.” Bold claim. But judging by what the market’s doing — he might actually be onto something.
The bill, passed 308 to 122 in the House, lays the groundwork for US banks to issue their own stablecoins and create a regulatory moat that finally separates innovation from legal whack-a-mole.
But wait, that’s not all. The House also passed the CLARITY Act and the Anti-CBDC Surveillance State Act. The first one will help determine if cryptos will be considered securities and the second one bans the Federal Reserve from issuing its own coin.
🚀 Crypto Market Cap Hits $4 Trillion
As the bill cleared Congress and Trump picked up the pen, the entire crypto market cap exploded past $4 trillion for the first time in history with the orange coin holding more than 60% of the market .
It wasn’t just Bitcoin BITSTAMP:BTCUSD making noise (although it did quietly retest $120,000 boasting a $2.4 trillion valuation, or more than that of Google parent Alphabet NASDAQ:GOOGL ).
The real momentum was coming from the stocks and altcoins — especially those with exposure to the suddenly green-lit US regulatory scene.
📈 Coinbase: To the Moon and Beyond
Let’s talk about Coinbase, ticker symbol NASDAQ:COIN , and now also, apparently, ticker symbol 🚀.
Shares surged over 8% on Friday to hit a new record session high of $445, giving the US-based exchange a market cap of over $100 billion. Not bad for a company that spent most of 2022 playing dodgeball with the SEC.
The GENIUS Act (and its siblings) cleared a path for institutional crypto adoption — and no one stands to gain more than Coinbase. It’s the go-to exchange for institutional custody and compliance. And now, with banks dipping their toes into stablecoin waters, guess who gets to facilitate those flows? Exactly.
Coinbase has now rallied over 63% year-to-date, putting it back into market darling territory — and giving early bulls a solid reason to post their PnLs again.
📊 Robinhood: Meme Stock No More?
Wait, what’s that clamor? It’s the “HOOD to $100” crowd dusting off their 2021 hats.
Robinhood NASDAQ:HOOD also saw a serious lift from the legislative push — hitting an all-time session high of $113 on Friday. The shares are up 180% in 2025 alone.
While most remember Robinhood for its meme stock legacy, the app has quietly built a towering crypto trading platform in the US. And now, with Congress cracking open the stablecoin lane and clearing legal fog, it’s suddenly a real contender in the digital asset arms race.
Add to that Trump’s pledge to dismantle crypto-hostile policies from the previous administration (many of which affected Robinhood’s crypto operations), and it’s no wonder the stock is flying.
💰 Stablecoins: Boring Coins Are Now Big Biz
You’d be forgiven for snoozing through most stablecoin headlines. After all, they don’t moonshot or do anything but sit idle.
But make no mistake — this is where the real money’s watching. JPMorgan CEO Jamie Dimon, not known for casual crypto endorsements, said last week his bank will now be “involved in both JPMorgan deposit coin and stablecoins.”
That’s a seismic shift. For years, traditional banks sat on the sidelines while Circle CRYPTOCAP:USDC and Tether CRYPTOCAP:USDT built billion-dollar stablecoin empires. Now, thanks to the GENIUS Act, the door is open for regulated banks to issue digital dollars backed by FDIC-level trust — and potentially eat into the DeFi-native players’ lunch.
Boring’s about to get very profitable.
💥 XRP: Return of the Ripple?
You know it’s a bull market when XRP BITSTAMP:XRPUSD shows up uninvited and still gets the VIP booth.
The one-time courtroom drama token surged over 60% in the past two weeks, hitting $3.50 and inching dangerously close to its all-time high. Ripple’s comeback arc may finally be getting its payoff.
With legal pressure fading and Congress setting new guardrails for digital assets, XRP’s regulatory risks just got a lot less scary. Plus, institutions looking for faster cross-border rails may find XRP’s network a bit more attractive when Washington’s no longer breathing down its neck.
🐂 Ethereum: Quietly Eyeing $4,000
Ethereum BITSTAMP:ETHUSD might not be making headlines like Bitcoin or XRP, but don't let the quiet confidence fool you.
ETH has been rising steadily, gaining almost 50% in the last two weeks, and Monday morning was trading just shy of $3,800. With regulatory uncertainty waning, and the market treating Ether more like an investment than a utility token, it’s slowly reclaiming its 2025 highs.
Factor in the growing number of ETH-based ETFs , tokenized real-world assets (hello, Treasury bills onchain), and the boom in stablecoins running on Ethereum rails… and you’ve got a slow-burn bull case building brick by brick.
🦅 Washington, WAGMI?
So, what’s the takeaway?
For the first time, Congress passed crypto legislation that didn’t come with a hidden poison pill. The GENIUS Act, along with the CLARITY Act, have made more legislative progress in a week than years of courtroom wrangling and ETF lobbying combined.
Trump, with his pro-crypto stance and deep industry ties (after all, he did launch his own coin not too long ago), just turned crypto into a political weapon — and a market darling. Is 2025 shaping up to be the year Washington went full Web3?
Let’s hear it from you : Drop your thoughts in the comments and let’s spin up the discussion.
Cryptostocks

MicroStrategy ($MSTR) – Bitcoin Proxy Setting Up AgainMicroStrategy Incorporated NASDAQ:MSTR remains the definitive institutional proxy for Bitcoin exposure, uniquely combining its enterprise software operations with a high-conviction, leveraged Bitcoin accumulation strategy. Its $1.42B BTC purchase in April 2025 further cements this thesis, making MSTR a prime vehicle for traders seeking amplified BTC exposure via equities.
Since our May 5th analysis, MSTR has rallied ~14.61%. We’re now eyeing a re-entry opportunity on a pullback to the $394–$387 zone, aligning with technical support and previous consolidation.
🎯 Bullish targets remain unchanged: $490.00–$500.00, backed by Bitcoin strength and MicroStrategy’s unwavering strategy.
🔁 Re-entry: $394–$387
🟩 Targets: $490–$500
#MSTR #Bitcoin #CryptoStocks #BTC #StockMarket #TechnicalAnalysis #MicroStrategy #HighBeta #CryptoExposure #TradingSetup

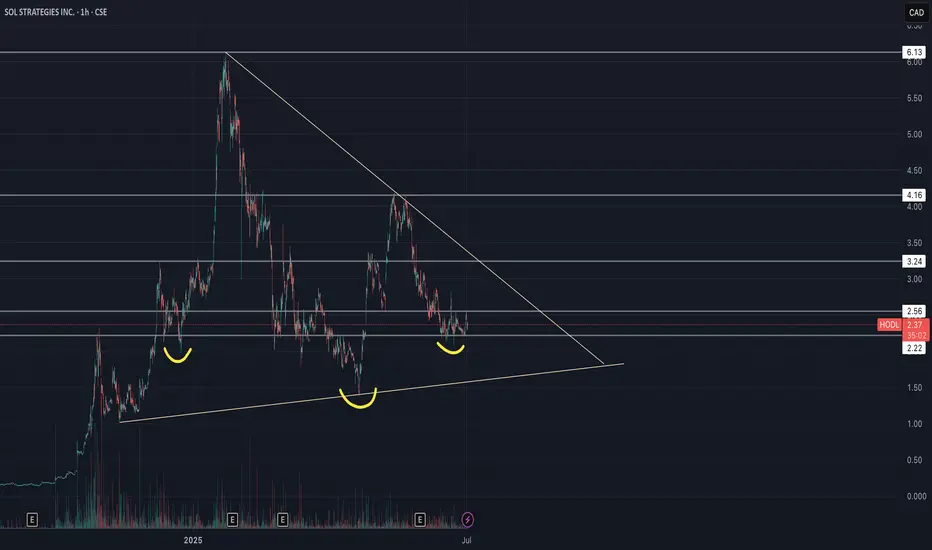
Sol Strategies Inc (HODL) - Inverse H&S🚀 SOL Strategies (HODL) – Public Market Gateway to Solana Yield
SOL Strategies (CSE: HODL) is a publicly traded company laser-focused on the Solana ecosystem. With nearly 395,000 SOL held (most of it staked) and over 3.7 million SOL delegated to their validators, they generate consistent income through staking rewards and validator commissions.
Their business model is simple:
📌 Accumulate SOL → Stake it → Run institutional-grade validators → Earn yield
📌 Expand through partnerships (3iQ, Neptune, BitGo, Pudgy Penguins)
📌 Hold strategic Solana ecosystem tokens like JTO and jitoSOL
📌 Operate with SOC 2-certified infrastructure and pursue a Nasdaq listing
SOL Strategies is not just holding crypto – they are building core infrastructure for Solana, giving equity investors direct exposure to staking economics in one of the fastest-growing blockchain networks.
📊 For traders: HODL stock offers a pure-play vehicle for Solana exposure, with an income-generating twist.
⚠️ Always do your own investment research and make your own decisions before investing.
SharpLink Gaming Inc (SBET) - Falling Wedge & Inverse H&S🚀 SharpLink Gaming ( NASDAQ:SBET ) – Ethereum, Joe Lubin & a Bullish Setup
SharpLink Gaming has undergone a bold transformation: the company is now the largest public holder of Ethereum (ETH), with ~198,000 ETH acquired since June 2025. Over 95% of it is staked, already earning 200+ ETH in rewards – turning ETH into a yield-bearing treasury asset.
Driving this shift is Joe Lubin, co-founder of Ethereum and CEO of ConsenSys, who recently became Chairman of SharpLink. Under his leadership, SBET is betting big on Ethereum as “digital capital”, aiming to merge iGaming and Web3.
📊 Technical Setup:
SBET is forming a falling wedge and an inverse head and shoulders – both classic bullish reversal patterns. After a post-announcement retracement, the chart suggests growing potential for a breakout as fundamentals strengthen.
🧠 My thesis: This is MicroStrategy playbook 2.0 – but with ETH instead of BTC. SharpLink gives equity exposure to Ethereum + staking yield + visionary leadership.
🔔 Worth watching closely.
⚠️ Always do your own investment research and make your own decisions before investing.

Bullish Gann chart $CLSKNASDAQ:CLSK will be pusing much higher ones it brakes the arc First target around $30.

MY BEST TRADE - CRCLCRCL. A beautiful retest on liquidity zone. The stock retraced to exact marked levels and grabbed all the liquidity two times near 102 to 104.
UP 31% till now.

COINBASE: 3rd Bollinger Squeeze is a pullback buy signalCoinbase is bullish on its 1D technical outlook (RSI = 65.834, MACD = 21.140, ADX = 19.909) as it is extending the bullish wave following the S1 rebound. The Bollindger Bands are now expriencing a squeeze, which is the 3rd since the bottom. The 2024 bullish wave also had three Bollinger Squeezes with the 3rd being the last that made the 349.50 High but not before a pullback to the Bollinger bottom. If that takes place, it will be a signal to go even stronger on the bullish side and target the R1 level (TP = 348.50).
## If you like our free content follow our profile to get more daily ideas. ##
## Comments and likes are greatly appreciated. ##

COINBASE and ALTS going hand in hand! Massive break-out expectedCoinbase (COIN) and the Crypto Total Market Cap (excluding top 10) are going hand in hand in this Cycle as their patterns since the November 08 2021 High have been virtually identical.
Right now we are on a strong rebound which was initiated on both after breaching below the 1W MA200 (orange trend-line). That is basically a Double Bottom, aiming at a break-out above their respective Resistance levels, which is expected to be massive.
Notice how even their 1W RSI patterns are similar, both Falling Wedges. Also their Bull Cycles both started on an Inverse Head and Shoulders pattern, so there is every reason to expect that the two will continue hand in had until their very peaks of the Cycles.
-------------------------------------------------------------------------------
** Please LIKE 👍, FOLLOW ✅, SHARE 🙌 and COMMENT ✍ if you enjoy this idea! Also share your ideas and charts in the comments section below! This is best way to keep it relevant, support us, keep the content here free and allow the idea to reach as many people as possible. **
-------------------------------------------------------------------------------
💸💸💸💸💸💸
👇 👇 👇 👇 👇 👇

COIN – Base Breakout + Earnings Gap Reversal SetupNASDAQ:COIN – Base Breakout + Earnings Gap Reversal
NASDAQ:COIN – Base Breakout + Earnings Gap Reversal Setup
Coinbase ( NASDAQ:COIN ) is setting up for a powerful move, and I’m watching two key catalysts driving this setup:
🔹 Earnings Gap Down Reversal (Primary Setup)
Despite a sharp gap down post-earnings, buyers stepped in fast, pushing price back up.
This is a classic earnings gap down reversal — a bullish signal of aggressive buying strength.
🔹 Base Breakout Pattern
NASDAQ:COIN has formed a solid base, with a breakout zone around $212 - $214.
Bitcoin ( CRYPTOCAP:BTC ) is ripping to $104,000, and NASDAQ:MSTR has been trending for a month — bullish sector sentiment could fuel NASDAQ:COIN ’s breakout.
🔹 My Trading Plan:
1️⃣ Anticipatory Entry: Looking to build a position near $212 - $214, the breakout zone.
2️⃣ Confirmation Entry: If NASDAQ:COIN breaks and holds above $214 with volume, I’ll size up.
3️⃣ Stop Loss: Placing stops just below yesterday’s low to control risk.
🔹 Why I Love This Setup:
Dual setup = Base Breakout + Earnings Gap Reversal — powerful combo.
Sector strength (BTC & MSTR) adds confidence.
Tight risk with a clear invalidation level (yesterday’s low).

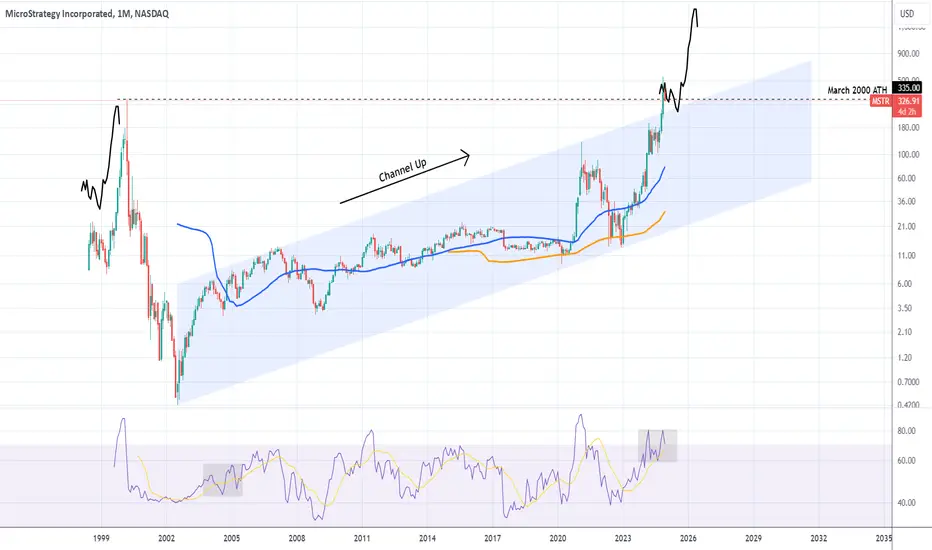
MICROSTRATEGY Can $2000 be its next High?Microstrategy (MSTR) followed the exact trading pattern we suggested on our last analysis (December 27 2024, see chart below) as it made its technical correction December through March and rebounded aggressively in April:
Back then we called this a shift to a new paradigm and is no different than the April 1999 bounce than led to the eventual massive rally that made the Dotcom Bubble burst.
Since the recent All Time High (ATH) broke above the (blue) 23-year Channel Up, we applied the Fibonacci Channel levels all the way from its March 2000 Dotcom High. The fractal we mentioned before shows that the stock's next Target, and possibly this Cycle's High, can be on the 0.618 Fib at $2000.
-------------------------------------------------------------------------------
** Please LIKE 👍, FOLLOW ✅, SHARE 🙌 and COMMENT ✍ if you enjoy this idea! Also share your ideas and charts in the comments section below! This is best way to keep it relevant, support us, keep the content here free and allow the idea to reach as many people as possible. **
-------------------------------------------------------------------------------
💸💸💸💸💸💸
👇 👇 👇 👇 👇 👇

COINBASE Can the 1D MA50 catapult it to $400?Coinbase (COIN) has been trading within a Fibonacci Channel Up ever since the Bull Cycle started on the January 06 2023 market bottom. The price made a Double Bottom on April 07 following the correction from its most recent High in early December.
That is a strong long-term market Support and a clear Demand Level as the stock's immediate rebound showed. The fact that it has currently flipped the 1D MA50 (blue trend-line) into a Support and is consolidating is a clear signal of a Re-accumulation Phase.
A break above its 1D MA200 (orange trend-line) will technically confirm the extension of the new Bullish Leg. The previous High was on the 0.786 Fibonacci Channel level and the one before that on the 1.0 Fib. If this declining rate continues, we should be expecting the next High to just hit the 0.618 Fib.
As a result, we have $400 as a medium-term Target, slightly above the stocks previous All Time High (ATH) at $370.
-------------------------------------------------------------------------------
** Please LIKE 👍, FOLLOW ✅, SHARE 🙌 and COMMENT ✍ if you enjoy this idea! Also share your ideas and charts in the comments section below! This is best way to keep it relevant, support us, keep the content here free and allow the idea to reach as many people as possible. **
-------------------------------------------------------------------------------
💸💸💸💸💸💸
👇 👇 👇 👇 👇 👇

MSTR–Institutional Bitcoin Proxy with Conviction and Leverage ₿Company Snapshot:
MicroStrategy NASDAQ:MSTR remains the largest corporate holder of Bitcoin, positioning itself as a leveraged equity proxy for BTC exposure—while still operating a profitable enterprise software business.
Key Catalysts:
Massive Bitcoin Treasury Strategy 💰
Recently acquired $1.42 billion in BTC, reinforcing commitment
Total holdings exceed 200,000 BTC, making it the most visible and transparent institutional crypto holder
Acts as a high-beta vehicle for Bitcoin bulls, especially as ETF flows drive demand
Financial Engineering = Firepower for More BTC 🚀
$722 million in refinanced fixed-income notes, lowering costs and extending maturity
Provides capital flexibility to accumulate BTC at opportunistic levels
Reflects strong capital market access and investor confidence
BTC ETF Tailwind + Institutional Validation ✅
Bitcoin ETFs provide broader adoption and liquidity, indirectly benefiting MSTR
MSTR offers a regulated, equity-based alternative to direct BTC ownership
Ideal for funds restricted from holding digital assets directly
Dual Business Model Stability ⚙️
Core enterprise software business contributes revenue and operational stability
Reduces perceived risk relative to pure-play crypto companies
Investment Outlook:
✅ Bullish Above: $325.00–$326.00
🚀 Upside Target: $490.00–$500.00
🔑 Thesis: High-conviction BTC accumulation + balance sheet optimization = leveraged upside for Bitcoin-focused investors
📢 MSTR: The go-to equity for institutional Bitcoin exposure—with built-in leverage and transparency.
#Bitcoin #MSTR #CryptoStocks #DigitalAssets #MichaelSaylor #InstitutionalCrypto

COINBASE This is the time to buy and target $400Coinbase Global (COIN) has been trading within a Channel Up pattern since the March 25 2024 High, so effectively a whole year. In the past 10 days it has been consolidating on top of the 1W MA100 (red trend-line), which is the natural long-term Support of the market.
During the same time it entered the Mayer Multiple Bands (MMB) Buy Zone, consisting of the 3 SD (green trend-line) and 2 SD (blue trend-line) below levels, which has given the ultimate buy signals since the January 2023 market bottom. Practically, the stock is consolidating within the 2 SD below and 1W MA100, a tight buy range.
Given the symmetry of the Channel Down Bearish Legs (both -48.39%), we expect a similar symmetry on its Bullish Legs too. Since the previous one reached the 1.236 Fibonacci extension, we are confidently targeting $400 before this Cycle tops. That would also make a perfect entry within the MMB Sell Zone that consists of the Mean MM (black trend-line) and 1 SD above (grey trend-line).
Notice also how the 1W RSI touched the Support of the September 06 2024 Low.
-------------------------------------------------------------------------------
** Please LIKE 👍, FOLLOW ✅, SHARE 🙌 and COMMENT ✍ if you enjoy this idea! Also share your ideas and charts in the comments section below! This is best way to keep it relevant, support us, keep the content here free and allow the idea to reach as many people as possible. **
-------------------------------------------------------------------------------
💸💸💸💸💸💸
👇 👇 👇 👇 👇 👇

MARA ($MARA) Q4—$214.4M HAUL STUNS MARKETMARA ( NASDAQ:MARA ) Q4—$214.4M HAUL STUNS MARKET
(1/9)
Good Morning, TradingView! MARA Holdings ( NASDAQ:MARA ) smashed Q4 ‘24 with $ 214.4M revenue, up 37% YoY 🌍 Bitcoin hoard hits $ 3.94B—let’s unpack this mining beast! 💰
(2/9) – REVENUE SURGE
• Q4 Take: $ 214.4M, 37% up from $ 156.8M 📈
• Net Income: $ 528.3M, 248% leap 🌟
• BTC Price: 132% boost adds $ 119.9M 💸
NASDAQ:MARA ’s cashing in—halving? What halving?
(3/9) – BLOCKS BUZZ
• Blocks Won: 703, up 25% from 562 🚗
• Hashrate: 53.2 EH/s, 115% jump 🔧
• EPS: $ 1.24, beats $ 0.32 loss call 🌞
NASDAQ:MARA ’s grinding—blocks stack, stock pops!
(4/9) – BTC HOARD
• Stash: 45,659 BTC, $ 3.94B haul 🌍
• Growth: 197% since Jan ‘24—22,065 bought 💼
• Bitdeer: $ 532M loss—ouch 😕
NASDAQ:MARA ’s stacking—rival’s stumbling!
(5/9) – RISKS IN SIGHT
• Costs: $ 127.4M energy, up 70% ⚠️
• Volatility: BTC swings sting 🐻
• Halving: $ 64.2M output hit 🔒
NASDAQ:MARA ’s hot—can it dodge the chill?
(6/9) – SWOT: STRENGTHS
• Haul: $ 214.4M, profit beast 💪
• Blocks: 25% more—mining grit 🏋️
• Hoard: $ 3.94B BTC—stack king 🌱
NASDAQ:MARA ’s tough—built to last!
(7/9) – SWOT: WEAKNESSES & OPPORTUNITIES
• Weaknesses: Energy costs bite 🙈
• Opportunities: BTC price, AI pivot—zing 🌏
Can NASDAQ:MARA vault past the snags?
(8/9) – NASDAQ:MARA ’s $ 214.4M Q4, what’s your vibe?
1️⃣ Bullish, $ 20+ stacks up 😎
2️⃣ Neutral, Solid, risks linger 🤷
3️⃣ Bearish, Costs clip it 😞
Vote below! 🗳️👇
(9/9) – FINAL TAKEAWAY
NASDAQ:MARA ’s $ 214.4M Q4 and $ 3.94B BTC pile stun—mining hauler Costs creep, but grit shines—gem or bust?

COINBASE about to start a rally to $550Coinbase (COIN) broke above its 1D MA50 (blue trend-line) again yesterday, but is practically still consolidating around it for the past 2 weeks. Still, it has already broke above December's Channel Down, which on the wider, long-term bullish trend, is nothing but a Bull Flag pattern, similar to January 2024.
As you can see, both patterns were initiated after previously a Falling Wedge broke upwards and above the 1D MA50 and on all occasions, the price increase has been significant, with the smallest being +139.50%.
As a result, being also on a 1D MACD Bullish Cross, we expect the stock to kick-start the new Bullish Leg soon. Expecting to register at least another +139.50% Leg from the recent Low, our Target is $550.
-------------------------------------------------------------------------------
** Please LIKE 👍, FOLLOW ✅, SHARE 🙌 and COMMENT ✍ if you enjoy this idea! Also share your ideas and charts in the comments section below! This is best way to keep it relevant, support us, keep the content here free and allow the idea to reach as many people as possible. **
-------------------------------------------------------------------------------
💸💸💸💸💸💸
👇 👇 👇 👇 👇 👇

COINBASE approaching the 1W MA50 and turns into a Buy again.Coinbase (COIN) has gone a long way since our September 09 buy signal (see chart below):
Even though it marginally missed the $360 Target, the pattern served in an excellent way those investors who bought at the bottom of its dominant 2-year Channel Up. The September - December Bullish Leg was by a narrow margin, the shortest (+141.45%) of Coinbase's total 5 major rallies within this pattern.
As the price is yet again approaching the 1W MA50 (blue trend-line), it is gradually turning into a Buy opportunity again. Even though the shortest Bearish Leg has been -38.74% and that currently places the projected bottom level a little over $215, the 1W RSI has already broken below its MA (yellow trend-line), which has been the ultimate buy signal on all previous technical corrections with the exception of last April.
As a result, there are more probabilities to see COIN resume the 2-year bullish trend, with the Risk/ Reward Ratio (RRR) turning favorable again. A Dollar-cost-averaging strategy is also suited for those seeking less risk.
Our Target from now on is $500, which represents a +141.45% rise (as mentioned above, the shortest within the Channel Up).
-------------------------------------------------------------------------------
** Please LIKE 👍, FOLLOW ✅, SHARE 🙌 and COMMENT ✍ if you enjoy this idea! Also share your ideas and charts in the comments section below! This is best way to keep it relevant, support us, keep the content here free and allow the idea to reach as many people as possible. **
-------------------------------------------------------------------------------
💸💸💸💸💸💸
👇 👇 👇 👇 👇 👇

MICROSTRATEGY Is it shifting towards a new paradigm?Microstrategy (MSTR) is defying all odds during this bull run and recently it achieved perhaps its most important one: it broke above its All Time High (ATH) of $335.00 registered in March 2000. This historic feat took place on the same month (November) that it broke and closed above its historical Channel Up pattern, which has been dictating its trend since the bottom of the Dotcom Bubble correction in 2002.
This is perhaps ushering a new era for the company. Along with Bitcoin it may be shifting to a new paradigm and the uptrend may be accelerated in a similar way as it did in 1998 - 2000. Technically we will be in a position to know that if the current pull-back bounces of the top of the former historic Channel Up.
-------------------------------------------------------------------------------
** Please LIKE 👍, FOLLOW ✅, SHARE 🙌 and COMMENT ✍ if you enjoy this idea! Also share your ideas and charts in the comments section below! This is best way to keep it relevant, support us, keep the content here free and allow the idea to reach as many people as possible. **
-------------------------------------------------------------------------------
💸💸💸💸💸💸
👇 👇 👇 👇 👇 👇
MICROSTRATEGY: Hit the 1D MA50 and bounced, but is it a buy now?MSTR has made a rapid turn from overbought to neutral on its 1D technical outlook (RSI = 48.944, MACD = 14.210, ADX = 17.986) as it reached today a -40% decline from its ATH but eventually hit the 1D MA50 and rebounded. This is the first contact with the 1D MA50 since September 19th. Even though it seems like a strong technical buy opportunity, Microstrategy has had its best buy entries in the last 2 years, under the 1D MA50. As this chart shows there have been 8 such buy signals, so even though the current rebound is tempting, we ideally want to see the price under the 1D MA50 and $300 before issuing a buy signal. Once this is filled, we can target the December 5th High minimum (TP = 400).
## If you like our free content follow our profile to get more daily ideas. ##
## Comments and likes are greatly appreciated. ##

COINBASE Strong buy signal on Inverted Head and ShouldersCoinbase / COIN has formed an Inverted Head and Shoulders pattern, bottoming at 274.30.
The bullish signal is confirmed as the price not only crossed over the Falling Resistance of the downtrend that started yesterday, but also above the 5minute MA50.
The standard target of such pattern is the 2.0 Fibonacci extension.
Buy and target 306.00.
Previous chart:
Follow us, like the idea and leave a comment below!!

COINBASE Ahead of an enormous bullish break-out.In recent times, we have focused on Coinbase's (COIN) long-term potential on higher time-frames (1W) like the one below (September 09) where we gave a great buy signal on the absolute bottom of the 2-year Channel Up:
On today's analysis we look into the 1D time-frame as Coinbase is about to test its longest 2024 Resistance, the Lower Highs trend-line that started after the March 25 2024 High. With added bullish pressure by the 1D MACD Bullish Cross formed 2 days ago, if this Lower Highs trend-line breaks, we can technically have a very aggressive rally.
The September 06 bottom can be seen as the start of the Head of an Inverse Head and Shoulders (IH&S) pattern, which has a standard Target on the 2.0 Fibonacci extension. That is just above $340. As a result, if the Lower Highs trend-line breaks, you can take additional buys to target $340.
-------------------------------------------------------------------------------
** Please LIKE 👍, FOLLOW ✅, SHARE 🙌 and COMMENT ✍ if you enjoy this idea! Also share your ideas and charts in the comments section below! This is best way to keep it relevant, support us, keep the content here free and allow the idea to reach as many people as possible. **
-------------------------------------------------------------------------------
💸💸💸💸💸💸
👇 👇 👇 👇 👇 👇

COINBASE Enormous upside from this point. $360 minimum Target.Coinbase (COIN) has staged a strong bullish turnaround since our last analysis (September 09, see chart below) and it appears that we caught the perfect bottom buy:
The stock has been trading within a long-term Channel Up since the first week of January 2023 (22 months). Within this time span, it has seen 4 corrections with the latter being the longest as we haven't seen a new High since the week of March 25 2024. The current correction is almost the same (-48.50%) as the January - April 2023 (-47.15%), while the other two have been around -39%.
The key for now is to close a 1W candle above both the 1W MA50 (blue trend-line) and the 1D MA50 (red trend-line). That will be the last confirmation for this Bullish Leg. This on its own is a very pessimistic development, with the presence of only the 1W MA100 (green trend-line) remaining to offer support long-term.
Now as for the upside, the minimum % rise of a Bullish Leg within this Channel Up has been +146.82% (two times). As a result, as long as the 1W RSI closes this week above its MA trend-line (yellow), a bullish signal that emerged on all previous 4 bottoms of the Channel, we can expect the new Bullish Leg to rise on a minimum +146.82% from its bottom, which gives us a $360.00 Target.
-------------------------------------------------------------------------------
** Please LIKE 👍, FOLLOW ✅, SHARE 🙌 and COMMENT ✍ if you enjoy this idea! Also share your ideas and charts in the comments section below! This is best way to keep it relevant, support us, keep the content here free and allow the idea to reach as many people as possible. **
-------------------------------------------------------------------------------
💸💸💸💸💸💸
👇 👇 👇 👇 👇 👇

COINBASE at the bottom of the 20month Channel. Will it go lower?Coinbase (COIN) has been trading within a long-term Channel Up since the first week of January 2023 (almost 20 months). Within this time span, it has seen 4 corrections with the latter being the longest as we haven't seen a new High since the week of March 25 2024.
Last Friday saw the week close on the strongest red 1W candle (-20%) since the 2022 Bear Cycle, as it failed to rebound on the 1W MA50 (blue trend-line). This on its own is a very pessimistic development, with the presence of only the 1W MA100 (green trend-line) remaining to offer support long-term.
However, this Friday closing made an exact Higher Low at the bottom of the Channel Up, something we hadn't seen since the June 05 2023 1W candle. That was the candle that completed the longest (until the current one) correction on Coinbase. Both Bearish Legs have similar declines (-47% then and -48% now). The minimum % rise of a Bullish Leg within this Channel Up has been +146.82% (two times).
As a result, as long as we close this week inside the Channel Up and ideally the 1W RSI remains above the 30.00 oversold barrier, we can expect a long-term bullish reversal on COIN with the start of the Channel's new Bullish Leg, with a minimum expectation being at $360.00 (+146.82% rally).
-------------------------------------------------------------------------------
** Please LIKE 👍, FOLLOW ✅, SHARE 🙌 and COMMENT ✍ if you enjoy this idea! Also share your ideas and charts in the comments section below! This is best way to keep it relevant, support us, keep the content here free and allow the idea to reach as many people as possible. **
-------------------------------------------------------------------------------
💸💸💸💸💸💸
👇 👇 👇 👇 👇 👇

COINBASE rebounded on its 1W MA50. Next target = $390Coinbase (COIN) hit (and even broke) last week its 1W MA50 (blue trend-line) for the first time in more than 1 year (since the week of June 26 2023) and posted an incredibly bullish reaction by almost recovering all of the weekly losses.
At the same time, that drop almost touched the bottom of the 1.5 year Channel Up that started after the 2022 market bottom. All similar bottoms registered at least +146.82% rallies on the Bullish Legs that followed, so we expect the stock to have a minimum $390 Target, which will also reach the 0.786 Fibonacci Channel level, that is always hit during such rallies.
-------------------------------------------------------------------------------
** Please LIKE 👍, FOLLOW ✅, SHARE 🙌 and COMMENT ✍ if you enjoy this idea! Also share your ideas and charts in the comments section below! This is best way to keep it relevant, support us, keep the content here free and allow the idea to reach as many people as possible. **
-------------------------------------------------------------------------------
💸💸💸💸💸💸
👇 👇 👇 👇 👇 👇
