COOKIE/USDT Short Setup Loading - High-Probability DropPrice recently pumped into a premium zone and gave us a clear Change of Character (ChoCh) — a classic signal that momentum is shifting from bullish to bearish. Now, we’re seeing a pullback into the 0.5–0.618 Fibonacci retracement zone, which often acts as a key area for entries.
📍 Trade Plan
Entry: 0.182 USDT
Stop-Loss: 0.191 USDT (above recent high / invalidation point)
Target: 0.173 - 0.1657 - 0.153
🔎 Why This Setup Stands Out:
✅ ChoCh Confirmed – Momentum has shifted, suggesting the bulls are losing control.
✅ Fibonacci Confluence – Price is pulling back right into the golden zone (0.5–0.618), offering a textbook short entry.
✅ Clean Risk/Reward – With a tight stop and a defined target, the setup offers solid R:R potential.
💭 Final Thought:
Now it’s all about confirmation. If we see a solid rejection in the zone, this setup could play out with strength. Patience is key — let the market come to you.
Cryptotrader

SHIBUSDT Is Flashing Major Bearish Warnings – Are You Ready??Yello Paradisers, Have you been keeping an eye on SHIBUSDT? If not, now is the time. The market is showing clear signs of weakness that could lead to a significant bearish move, and many traders may not be prepared for what’s coming.
💎SHIBUSDT is currently looking bearish after forming a clear bearish Change of Character (CHoCH) on the higher timeframe. Adding to this, the price action on the lower timeframe is showing an internal Change of Character (I-CHoCH) originating from a 4-hour bearish Order Block (OB). This setup substantially increases the probability of a continuation to the downside.
💎What we are focusing on now is the potential pullback. If SHIBUSDT pulls back to fill the Fair Value Gap (FVG) or develops a bearish pattern from the Order Block, it would provide a strong short opportunity with an excellent risk-reward profile.
💎However, it is crucial to remain cautious: if the price breaks out and closes a candle above the identified Order Block, it would completely invalidate the bearish idea, and we would need to step aside from any short positions.
Remember, Paradisers, sustainable trading success comes from patience and disciplined execution. There is no need to rush. Waiting for confirmation will always keep you on the winning side. Be smart, wait for the right setup, and always trade like a professional. This is the only way you will make it far in your crypto trading journey.
MyCryptoParadise
iFeel the success🌴

ETH Rejection Incoming? Don’t Fall for This Bull TrapYello Paradisers, are you watching how ETH is reacting right now at this key zone? This could either turn into a textbook bearish setup… or catch everyone off guard. Let’s break it down 👇
💎ETHUSDT is currently hovering at a critical resistance area, perfectly aligned with both a key Fibonacci retracement zone and the 200 EMA—classic confluence. What makes it even more concerning is the bearish divergence, which is strengthening the probability of a downside rejection from this level.
💎To add fuel to the fire, the price action has just taken liquidity (inducement) above the previous highs, another bearish signal that supports the idea of a potential reversal from here.
💎However, this bearish bias will be fully invalidated if ETH manages to break and close a candle above the resistance zone. That kind of price action would suggest strength from buyers and a likely continuation to the upside.
💎In that case, it’s wiser to stay patient and wait for a cleaner setup at a better price. Rushing into a trade at this stage, especially in a moment of indecision, is not how pros operate.
If you want to be consistently profitable, you need to be extremely patient and always wait only for the best, highest probability trading opportunities.
MyCryptoParadise
iFeel the success🌴

SOLUSDT Breakdown WarningYello Paradisers! Have you spotted what’s happening with SOLUSDT right now? A major breakdown just played out, and this could be the beginning of a much deeper bearish move that many are underestimating.
💎SOLUSDT has broken down from a rising wedge pattern—an important bearish structure that often signals upcoming downside pressure. Before the drop, it swept liquidity, a typical smart money move, and has now confirmed a bearish Change of Character (CHoCH). This combination significantly increases the probability of further decline.
💎If we see a pullback into the resistance zone—it could offer a strong short opportunity with good risk-to-reward ratio. That’s where professional traders start looking to position themselves carefully.
💎However, this bearish idea has a clear invalidation point. If price breaks out and closes a candle above that invalidation level, then the bearish outlook becomes void. In such a case, it’s wiser to stay patient and wait for more precise, high-probability setups to develop.
🎖Strive for consistency, not quick profits. Treat the market as a businessman, not as a gambler. Stay disciplined, Paradisers, and wait only for the cleanest, most reliable trading opportunities. That’s how you make it in this game.
MyCryptoParadise
iFeel the success🌴

ZRO: Altcoin hero?If you find this information inspiring/helpful, please consider a boost and follow! Any questions or comments, please leave a comment!
ZRO is worth keeping on the radar. Out of most altcoins it arguably has the cleanest setup for a potential bullish reversal—at least structurally.
While it could be done here, I’m leaning on the idea that the Y wave still needs one more leg down. That’s typically the behavior we see: Y waves tend to be slower and more drawn out compared to the W wave. If that holds true again, the ideal target zone falls between $2.12 and $1.88. That would allow for a proper test of structure while staying within the bounds of the larger corrective patterns most likely target.
This is still a bullish interpretation—but only after one more low and a meaningful reaction from it.
That said, both the bull and bear counts are pointing down in the near-term. My personal invalidation sits above the (c) wave high. If ZRO clears that, this setup likely needs to be re-evaluated. Until then, any move beyond the orthodox end of wave A of the Y leg should be considered “enough” from a pattern swing perspective.
Patience here could pay off—especially if price enters the key zone and shows strength.
Trade safe, trade smart, trade clarity.

BTCUSD - $100k soon? [UPDATE]MARKET UPDATE.
Price broke out of the Descending Trendling and has pulled back to retest the Trendline and a Key Demand zone.
Stacked Confluences:
1. Trendline Break & Retest.
2. Liquidity sweep below support.
3. BOS after price reacted from the Demand.
I’m watching for continuation towards $85.8k and beyond.
If bullish step in here this could be the next bullish leg up.
Let’s see how it plays out.
What are your thoughts on BTC this week let me know what you think in the comments.

DOT About to Break Down? Don’t Fall for the TrapYello Paradisers! Could this "bullish" pump on DOTUSDT be leading traders straight into a bear trap?
💎DOTUSDT is currently forming an ascending channel, which is historically a bearish pattern. These setups often lure in breakout traders before reversing sharply, shaking out weak hands and triggering stop-losses.
💎The price is now approaching a critical resistance zone, where the Fibonacci golden pocket overlaps with the 200 EMA — a powerful confluence. If DOTUSDT grabs liquidity above the recent highs, it would significantly increase the probability of a bearish reversal from that region.
💎For safer, more conservative traders, the best strategy here is to wait for confirmation of a bearish pattern within this area. That would offer a stronger risk-to-reward ratio while allowing more control over trade execution. Patience pays, especially when the market tempts you with low-conviction breakouts.
💎However, if price breaks out and closes decisively above the invalidation level, then the entire bearish idea becomes invalid. At that point, it’s essential to step back and reassess the structure rather than forcing a trade.
Discipline is what separates professionals from gamblers. This setup demands patience, a level head, and an understanding of risk management.
MyCryptoParadise
iFeel the success🌴

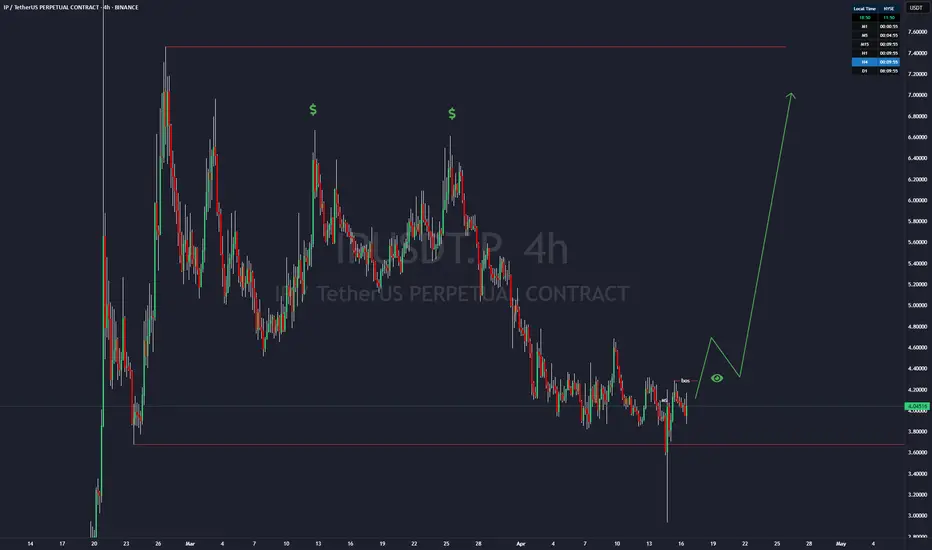
Is crypto dead? NO! IP might save the day!Price Action Analysis
NYSE:IP recently declined to the $3.67 level, effectively sweeping external liquidity by triggering stop-loss orders below key support. This move was followed by a strong recovery, with price fully absorbing the bearish momentum and closing within the global trading range. This price action resulted in a Market Structure Shift (Change of Character, or ChoCH), indicating a potential reversal from bearish to bullish sentiment. The ChoCH suggests institutional buying interest, as the market rejected further downside and reestablished bullish structure.
However, caution is warranted. Bitcoin ( CRYPTOCAP:BTC ), a key market driver, may experience a corrective move lower, potentially influencing NYSE:IP ’s price action. As such, immediate entries are premature without further confirmation of bullish momentum.
Key Levels and Trade Setup
Break of Structure (BoS) at $4.28
The $4.28 level on the daily timeframe is pivotal, representing a potential Break of Structure (BoS). A decisive close above this level would confirm bullish continuation, signaling the start of a significant upward move. Should this occur, NYSE:IP is likely to target the following resistance zones:
$6.61: Initial target, likely aligning with prior swing highs or liquidity pools.
$6.98: Secondary target, potentially coinciding with a Fair Value Gap (FVG) or institutional sell-side liquidity.
$7.46: Final target, representing a high-probability zone for profit-taking.
Entry Confirmation
To ensure a high-probability trade, the following conditions must be met:
Daily BoS Confirmation: A clean break and close above $4.28 on the daily chart, supported by elevated trading volume.
4-Hour Timeframe Validation: A breakout above $4.28 on the 4-hour (4H) or higher timeframe, ideally accompanied by a bullish Fair Value Gap (FVG). An FVG forming on the 4H chart post-breakout would serve as an optimal entry zone, minimizing risk by aligning with institutional order flow.
Pullback to FVG: Post-breakout, a retracement to a 4H bullish FVG (e.g., $4.20–$4.25) that holds as support would confirm the setup for a long position.
Trade Execution
Set Alerts: Configure price alerts at $4.28 to monitor for a daily or 4H breakout. Ensure alerts trigger on a candle close above this level to confirm BoS.
Risk Management: Risk no more than 1–2% of trading capital per trade. Position size should be calculated based on a stop-loss placed below the FVG or recent swing low (e.g., $4.00–$4.10), targeting a minimum risk-reward ratio of 5:1.
Exit Strategy: Take partial profits at $6.61 (50–70% of position) and trail stops for the remaining position toward $6.98 and $7.46, monitoring for signs of rejection or bearish structure at these levels.
Bitcoin Correlation
Given CRYPTOCAP:BTC ’s influence on altcoin price action, monitor its key levels closely. A potential corrective move in CRYPTOCAP:BTC could lead NYSE:IP to retest lower supports (e.g., $3.85 or $3.67). Set a secondary alert at $3.85 to watch for a bounce in case of a broader market pullback. Conversely, a stabilization or bullish breakout in CRYPTOCAP:BTC would enhance the likelihood of NYSE:IP ’s bullish setup materializing.
Conclusion
NYSE:IP presents a compelling technical setup, with a ChoCH at $3.67 signaling a potential bullish reversal and $4.28 as the critical level for BoS confirmation. Traders should set alerts at $4.28, await a clean 4H or daily breakout with FVG formation, and execute entries with disciplined risk management. Monitoring CRYPTOCAP:BTC ’s price action is essential to avoid adverse market-wide corrections. This setup offers a high-probability opportunity for significant upside, provided the outlined conditions are met.
ADA Is Setting Up for a Trap? Watch This Level CloselyYello Paradisers– is ADA walking straight into a trap at resistance? The current structure is raising red flags, and traders should stay sharp.
💎ADAUSDT is moving within an ascending channel, which often signals a potential loss of bullish momentum—especially when price approaches a strong resistance area. Right now, it’s nearing a major zone that’s reinforced by the 200 EMA, acting as dynamic resistance. On top of that, a clear bearish divergence is forming, which further increases the likelihood of a downside move.
💎If price sweeps the highs to take liquidity and then prints a bearish reversal pattern from this zone, it could offer a strong short opportunity with an attractive risk-to-reward setup. This is the type of trade setup that disciplined traders focus on.
💎However, if ADA breaks out above the resistance and closes a candle above the invalidation zone, the bearish thesis is off the table. In that case, it’s smarter to stay patient and wait for cleaner price action rather than reacting emotionally.
🎖Strive for consistency, not quick profits. Treat the market as a businessman, not as a gambler.
MyCryptoParadise
iFeel the success🌴

Is PEPE About to Crash from Here? Key Bearish SignalsYello, Paradisers — have you been watching PEPE closely? Because if not, you might be walking right into a trap. We warned about this bearish setup in advance, and right now, PEPEUSDT is flashing multiple red flags that every serious trader needs to be aware of.
💎PEPE is currently sitting under heavy pressure at a confluence of resistance — the 200 EMA, the Fibonacci golden pocket, and a major supply zone. And here’s the critical part: it has just printed a bearish CHoCH (Change of Character), significantly increasing the probability of a deeper move down.
💎On top of that, the daily timeframe is showing bearish divergence, a classic warning sign that momentum is fading, while price tries to push higher. These conditions are aligning to suggest that the bulls may be running out of fuel.
💎If we do get a pullback, there’s potential for a high-probability short entry around the breaker block and the Fair Value Gap (FVG) zones — so keep a close eye there.
💎But be careful — this setup isn’t bulletproof.
💎If PEPE breaks out and closes a candle above our invalidation level, the entire bearish bias gets invalidated. In that case, the best move will be to stay on the sidelines and wait for stronger confirmation. Never force trades — especially in this kind of volatile setup.
🎖Strive for consistency, not quick profits. Treat the market as a businessman, not as a gambler. Our focus remains on executing only the highest-probability setups with proper risk management.
MyCryptoParadise
iFeel the success🌴

Can #AAVE Bulls Sustain the Current Momentum? Key Levels Yello, Paradisers! #AAVE looks bullish on the surface—but is this setup quietly setting up for a brutal dump? Here's the key level that will trigger the next big move:
💎#AAVEUSD is currently trading around $143.66, holding inside a clear ascending channel on the 4H timeframe. The price action of #AAVE has been respecting both the ascending support and resistance trendlines, forming higher lows and higher highs—but momentum is fading.
💎A bearish divergence on the momentum oscillator is signaling early weakness despite the price climbing higher. This divergence usually marks the beginning of a bull trap, where the price appears strong just before a sharp reversal.
💎The immediate resistance to watch is in the $156. This is where price was recently rejected, near the upper channel trendline. Above that, $156 remains the key Bearish Setup Invalidation level. A breakout and hold above this would invalidate any bearish structure and could lead to a push toward $170+.
💎However, if AAVE breaks below the ascending support, currently near $140, it opens the door for a sharp drop. The first target is the $126.10 support zone, followed by the $114.35 level, which aligns with a strong historical demand area.
Play it safe, respect the structure, and let the market come to you. Discipline, patience, and strategy are what separate long-term winners from short-term gamblers
MyCryptoParadise
iFeel the success🌴

STX Bulls Beware: Is This the Calm Before a Massive Drop?Yello, Paradisers! Are you seeing what we’re seeing on STXUSDT? If not, now’s the time to pay attention—our recent predictions on bearish setups are starting to unfold again, and this one might catch many off guard. Let’s break it down.
💎Currently, STXUSDT is flashing some serious warning signs. We’re spotting a clear bearish Change of Character (CHoCH) in play, which is being reinforced by a Head and Shoulders pattern—a combination that significantly increases the probability of a downside move.
💎To make things worse for the bulls, there’s an unfilled Fair Value Gap (FVG) sitting just below the current price. This acts like a magnet and could drag the price downward as liquidity gets targeted.
💎However, if STXUSDT manages to bounce from current levels, we’ll be closely watching the Order Block (OB) and Fibonacci Golden Zone as potential entry points. These could offer an excellent risk-to-reward (RR) setup if the bearish scenario gets temporarily rejected.
💎But here’s the key invalidation point: if price breaks and closes above the OB zone, the entire bearish thesis falls apart. In that case, we’ll step aside and wait for stronger confirmation before jumping back in. No need to rush—better opportunities always come with clear setups.
🎖Trade smart, Paradisers. The market doesn't care about your bias—it rewards only patience, precision, and discipline. Stick to your trading plan, and don’t let FOMO or fear drive your decisions.
MyCryptoParadise
iFeel the success🌴

Is DOGE About to Crash Hard From This Trap Zone? Read Before LONYello Paradisers — could this be the perfect bull trap setting up before a bigger drop? Our previous analyses warned about these kinds of setups, and once again, DOGEUSDT is flashing multiple signals that suggest a high-probability reversal could be just around the corner.
💎Currently, DOGEUSDT is trading right inside the golden Fibonacci retracement zone, a level that often acts as a powerful area of rejection. What makes this zone even more significant is the confluence of additional bearish indicators aligning at the same point. Both the 100 and 200 EMAs are present, reinforcing dynamic resistance, and there are clear Fair Value Gaps (FVGs) visible on both the 4H and Daily timeframes. On top of that, a bearish divergence has now formed, signaling early exhaustion in bullish momentum and further reinforcing the potential for a downside move.
💎When these elements align, the probability of a rejection increases substantially. However, we’re not jumping in blindly. If DOGEUSDT starts to bounce from here and shows weakness—such as stalling below resistance—then we’ll be closely watching for confirmation patterns like a double top or a head and shoulders. These would not only validate the bearish narrative but also offer significantly better risk-to-reward ratios for short setups.
💎That said, every setup has its invalidation. If price breaks and closes candle above our invalidation level, then the entire bearish scenario must be considered void. In that case, the best approach would be to stand aside and wait for a cleaner structure to form before taking any action. There’s no reason to force a position in uncertain conditions.
If you want to be consistently profitable, you need to be extremely patient and always wait only for the best, highest probability trading opportunities.
MyCryptoParadise
iFeel the success🌴

Will #SHIB Continue Pumping or a Bull Trap is Waiting for Bulls?Yello, Paradisers! Will #SHIBUSDT continue flying, or are we about to witness a brutal rejection straight into the demand abyss? Let’s break it down.
💎#SHIB has recently broken out of a Descending Broadening Wedge Formation on the 4H chart, a pattern that historically signals potential bullish reversals. This breakout was strong, but the price has now hit a critical Supply Zone between 0.00001530 – 0.00001650, and has already shown signs of rejection from this area.
💎The structure shows #SHIBUSD facing Strong Resistance just below 0.00001711—a level that acts as Bearish Setup Invalidation. If the price closes decisively above this zone, bears will lose control, and we could see a sharp squeeze up toward 0.00001900.
💎However, the more probable scenario for now is a retest and rejection from the supply zone, followed by a deeper pullback. Based on volume profile and historical price behavior, the Support Zone around 0.00001181 is a key level to watch for a possible bounce. If this level is lost, SHIB could fall to sweep the swing low (SH) at 0.00001081 to complete a liquidity grab before resuming any bullish trend.
💎RSI is currently near overbought territory, suggesting SHIB may be due for a short-term correction or consolidation. This lines up with the visual expectation of a potential ABC correction back into support, where Wave A has started and Wave B might complete soon.
Patience and precision are key in these conditions wait for strong confirmation before making your moves.
MyCryptoParadise
iFeel the success🌴

Is TAOUSDT About to Dump Hard? Yello, Paradisers! Are you paying close attention to this subtle shift on TAOUSDT? Because what we’re seeing right now could easily trap late bulls before the real drop even begins…
💎TAOUSDT is currently displaying clear signs of a potential bearish reversal. We’ve observed a bearish Change of Character (CHoCH) developing from the 1H Fair Value Gap (FVG), which is a strong early indication of weakening bullish momentum. To add to this, price has also broken down below the 50 EMA, a technical signal that increases the probability of further downside movement. When both of these elements align, it’s often a precursor to a more significant pullback.
💎If TAOUSDT revisits the recent Fair Value Gap, the trade setup becomes even more attractive, offering a stronger risk-to-reward ratio. That would be the optimal level for entry. However, even from current price levels, the trade still offers a 1:1 risk-to-reward opportunity. While not ideal, it remains viable for more aggressive traders.
💎That said, the entire bearish setup becomes invalid if the price breaks out and closes a candle above the current resistance zone. In such a scenario, it would be wise to step back and wait for more reliable price action to develop before making any further decisions.
Strive for consistency, not quick profits. Treat the market as a businessman, not as a gambler.
MyCryptoParadise
iFeel the success🌴

PEPE Ready to Dump? This Key Zone Could Trigger a Sharp ReversalYello Paradisers — did you catch the recent shift on PEPEUSDT? If not, now’s the time to zoom in, because the setup is looking primed for a big move, and you don’t want to be caught on the wrong side.
💎PEPEUSDT has broken out of Ascending Channel & shown a clear bearish CHoCH (Change of Character), confirming a shift in market structure. Following that, we’ve now seen a proper pullback. Currently, the price is sitting right at a critical resistance zone.
💎What makes this zone especially significant is the confluence of technical factors stacked at the same level — the 200 EMA, a Fair Value Gap (FVG), and the Fibonacci Golden Zone are all present. This combination significantly increases the probability of a bearish move from here.
💎If PEPE breaks out and closes a candle above our invalidation level, the entire bearish idea gets invalidated.
🎖Paradisers; the next 6–9 months will be juicy for some and painful for others. Discipline, patience, robust strategies, and trading tactics are the only ways you can make it long-term in this market.
MyCryptoParadise
iFeel the success🌴

APEUSDT: Will This Major Resistance Trigger a Sharp Rejection?Yello Paradisers, have you spotted what’s brewing on APEUSDT? We’re sitting at a critical zone—one that could either trigger a steep drop or trap late shorts before a breakout. Here's why this level demands your full attention.
💎APEUSDT is showing strong bearish potential, currently trading inside a rising wedge pattern accompanied by bearish divergence. What's even more crucial is that this price action is unfolding right at a key resistance zone, reinforced by both the 0.618 Fibonacci level and the 200 EMA. This confluence of technical factors significantly increases the probability of a bearish rejection from here.
💎If APEUSDT consolidates around this level and begins forming clear bearish structures—such as an M-pattern, a bearish CHoCH (Change of Character), a Head & Shoulders, or even an Inverse Cup & Handle—the bearish case strengthens further. This would also allow for a tighter risk setup, improving the risk-to-reward ratio for traders who are patient and precise.
💎On the flip side, if the price breaks and closes decisively above the invalidation level, this will invalidate the bearish setup entirely. In that scenario, the smart move would be to wait for a new structure or a clean retest before making any trading decisions.
🎖This is the only way you will make it far in your crypto trading journey. Be a professional—stick to your plan, reduce your risk, and never chase the market. Timing and discipline are what separate consistent traders from the rest. Stay sharp, Paradisers.
MyCryptoParadise
iFeel the success🌴

Warning: BCHUSDT Is Approaching a Dangerous Trap ZoneYello, Paradisers! Are you ready for what could be the next classic fakeout setup? BCHUSDT is heading straight into a high-probability reversal zone, and if you’re not paying attention, this could turn into another painful reminder of how quickly things change in crypto…
💎BCHUSDT is currently showing signs of weakness as it moves toward a major resistance zone. This area is reinforced by a 4H Fair Value Gap (FVG) and the critical 0.618 Fibonacci retracement level — both of which have historically acted as strong reversal points.
💎Adding to the confluence, we’re spotting clear bearish divergence on the chart, which further increases the likelihood of a downward move from this level.
💎If BCHUSDT taps into our resistance zone, we’ll be monitoring for bearish price action confirmation.
💎Ideal patterns to validate the setup include: M-formation, Head & Shoulders, Inverse Cup & Handle.
💎These patterns can help us reduce our stop-loss exposure and improve the overall risk-to-reward ratio — patience will be key here.
💎On the flip side, if price breaks out and closes above our invalidation level, the bearish setup will be completely invalidated. In that scenario, it’s smarter to wait for new, more favorable price action before making any trading decisions.
🎖This is the kind of moment that separates disciplined traders from the emotional ones. Don’t rush in blindly — timing, confirmation, and strategic entries are everything if you want to win consistently in this game.
MyCryptoParadise
iFeel the success🌴

SOLANA (SOLUSD): Bullish Reversal Confirmed
It looks like Solana is ready to return to a bullish trend.
We see multiple strong price action confirmations after
a test of a significant daily support.
The price formed the ascending triangle on that, and violated
both its neckline and a resistance line of a falling wedge pattern.
Looks like the market can reach 180 level easily soon.
❤️Please, support my work with like, thank you!❤️

ADAUSDT Flashing Bearish Signals – Is a Drop Incoming?Yello, Paradisers! Are we about to see a strong rejection on ADAUSDT? Let’s break it down.
💎ADAUSDT has filled the Fair Value Gap (FVG) and formed a double top with bearish divergence. Notably, the right top is slightly above the left, signaling a liquidity grab. Following this, we’ve seen a Change of Character (CHoCH) to the bearish side, increasing the probability of a downside move.
💎If ADAUSDT retraces from this level, it will strengthen a high-probability bearish setup from the 1-hour FVG, where the 0.5 Fibonacci level aligns—offering an attractive risk-to-reward (RR) opportunity for shorts.
💎However, if price breaks and closes above the 0.786 Fibonacci level, our bearish outlook will be invalidated. In that case, it would be best to step back and wait for stronger confirmation before taking action.
🎖 Patience and discipline win the game, Paradisers! Don’t chase—wait for the best setups and protect your capital like a pro.
MyCryptoParadise
iFeel the success🌴

Levels in LINK: Breakdown or Breakout?If you find this information inspiring/helpful, please consider a boost and follow! Any questions or comments, please leave a comment!
### **Technical Overview**
- **Current Price**: $14.35 (approx.)
- **Trend Structure**: Elliott Wave count suggests Wave 3 has wrapped up. Wave 4 and 5 are likely next.
---
### **Key Observations**
- **Impulse Invalidation Level**: $19.190
→ A break above this invalidates the current bearish impulse.
- **Bullish Barriers**:
- *Minor Resistance*: $15.002
- *Major Resistance*: $17.677
These are the key spots bulls need to reclaim to regain control.
- **Crucial Support**: $12.426
→ If this breaks, expect more downside—likely toward the final Wave 5 zone.
- **Bearish Target**: $9.283
→ Probable landing spot for Wave 5 (of C). Could shape up as a longer-term accumulation zone.
---
### **Elliott Wave Context**
- A possible running or expanded flat scenario is in play, with Wave (B) topping around the 1.382 extension.
- Wave 3 appears to have completed near the 1.618 extension, a textbook zone for this kind of move.
---
### **Potential Scenarios**
1. **Bullish Reversal Case**:
- Price reclaims $15.00 and ideally $17.677.
- The bearish count falls apart.
2. **Bearish Continuation Case**:
- Price stalls under resistance.
- A break of $12.426 sets the stage for continuation down to $9.283.
3. **Neutral Scenario**:
- Choppy consolidation between $12.5–$15 while the market sorts itself out.
---
### **Strategic Considerations**
- **Short-term Bulls**: Watch $15–$17.6. Any strong reclaim could offer clean long setups.
- **Bears & Shorts**: Prime fade zone if price gets rejected near resistance.
- **Long-term Investors**: If we hit $9.283, that’s a potential loading zone for the next cycle.
Trade safe, trade smart, trade clarity.

PIUSDT : Head & Shoulders Signals a Major Drop Incoming!Yello, Paradisers! PIUSDT is flashing strong bearish signals! The price has formed a Head & Shoulders pattern right on the resistance trendline of a descending channel—this combination significantly increases the probability of a sharp move to the downside.
💎PIUSDT breaks below the neckline and closed a candle which validates the bearish setup, increasing the likelihood of further downside.
💎However, We have to wait for the proper retest of the neckline, patience is key for the right entry.
💎On the flip side, if PIUSDT breaks above the resistance zone and closes candle above it, the bearish setup will be invalidated.
Stay disciplined and wait for confirmation, Paradisers. A fakeout could trap impatient traders—don’t be one of them! 🎖
MyCryptoParadise
iFeel the success 🌴

AVAXUSDT Breakdown Alert – Are Lower Lows Coming Next?Yello, Paradisers! Is AVAXUSDT gearing up for a bigger drop? Let’s break it down.
💎AVAXUSDT has turned bearish after breaking below its key support trendline. A Change of Character (CHoCH) confirms the shift to the downside, and right now, the price is rejecting from a critical 4H Fair Value Gap (FVG) and the 200 EMA resistance zone. Adding to the bearish pressure, we also see a 4H bearish divergence, making a downside move highly probable.
💎Moreover, AVAXUSDT is in the process of forming a Head & Shoulders pattern, which increases the risk-to-reward (RR) potential for short trades. On top of that, there’s liquidity resting below, which could act as a magnet, pulling the price further down.
💎However, if the price breaks out and closes a candle above the 200 EMA resistance zone, this bearish outlook will be invalidated. In that case, it’s better to wait for clearer price action before making any moves.
🎖Patience is key, Paradisers. Stick to the strategy, avoid emotional trading, and let the market come to you. The best setups will always present themselves to those who wait!
MyCryptoParadise
iFeel the success🌴
