BAKE/USDT it required to bounce for back to upward movement!💎 Paradisers, the recent market activity surrounding #BAKE has indeed captured attention. Currently positioned within the bullish OB area, there's potential for BAKE to find support and initiate an upward trajectory.
💎 Should this materialize, BAKE may test resistance levels, with a breakout signaling bullish sentiment and potentially leading to further upward movement toward our target strong resistance area.
💎However, should BAKE falter in its attempt to breach resistance and face rejection, it could indicate weakening momentum, prompting a retreat back towards the Bullish OB area.
💎 Should BAKE's attempt to find support in the OB area fail, it may trigger further downward movement, extending the current bearish trend.
MyCryptoParadise
iFeel the success🌴
Cryptotraders

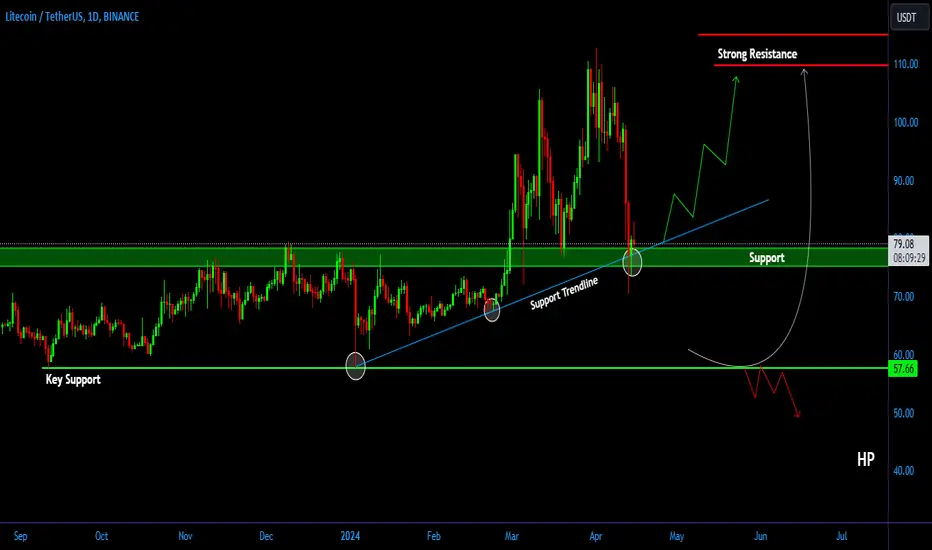
LTC/USDT in the crucial area need to bounce for back to upward!💎 Paradisers, the recent market movements of #LTC have certainly drawn attention. LTC finds itself at a critical juncture, teetering on crucial support.
💎 A successful bounce from this support could reignite upward momentum, potentially leading to a retest of strong resistance areas.
💎 However, should LTC fail to find support and breach both the critical support level and the support trendline, it would signal a concerning shift toward downward momentum. Such a scenario could prompt a descent towards key support areas to establish a new trajectory.
💎 Upon reaching these critical support levels, a decisive bounce is imperative for LTC to reclaim ground and reignite upward momentum. Reclaiming the price above the $80 support area would be pivotal for LTC to resume its upward trajectory toward our target.
💎 Should this scenario falter and LTC breach the key support level, it would likely prolong downward momentum, leading to further declines.
MyCryptoParadise
iFeel the success🌴
SKL/USDT it required to break the resistance to continue upward!💎 Paradisers, the recent market movements of #SKL have caught our attention. Currently, SKL is encountering resistance, with a breakout needed to reignite upward momentum.
💎 A successful breakout could propel SKL towards our target area within the supply zone.
💎 However, if SKL faces rejection at this resistance level, a retreat to test the support trendline is likely, creating new momentum.
💎 Should SKL fail to hold the support trendline and break below it, it would mark a significant shift in the bullish trend. Testing the Bullish OB area becomes crucial in such a scenario, as a bounce from here could reignite attempts to break above the resistance.
💎 However, a breakdown below the Bullish OB would confirm a bearish trend, potentially leading to further downward movement.
MyCryptoParadise
iFeel the success🌴

OP/USDT A break the resistance, will indicating back to bullish.💎 Paradisers, it's intriguing to see the recent market dynamics of #OP. With the bounce from the demand area and now testing the resistance, the next moves are critical.
💎 If #OP manages to break above the resistance, it could signal a bullish reversal, paving the way for further upward movement, and potentially testing the strong resistance area.
💎 However, if #OP faces rejection at the resistance, it may retreat to test the demand area for renewed momentum.
💎 Bouncing from the demand area is crucial for sustaining bullish momentum. Failure to do so, resulting in a breakdown, could signify bearish sentiment, leading to further downward movement.
MyCryptoParadise
iFeel the success🌴

GRT/USDT bullish turnaround from demand? 👀 🚀GRT analysis💎 Paradisers, direct your attention to #GRTUSDT for an intriguing trading opportunity that hints at a potential bullish surge emerging from a key demand level.
💎 Over recent times, #GRT has consistently adhered to a descending channel pattern. As the price approaches the demand level, maintaining momentum here could significantly enhance the chances of a bullish ascent, aiming to overcome the formidable overhead supply zone.
💎 Should the momentum for JSE:GRT begin to waver, we stand ready to seek a vigorous rebound from the crucial support level just before the demand zone, currently situated at $0.2110.
💎 However, a breach below the critical demand level of $0.2110 would necessitate an in-depth reassessment of our trading approach. Such a development would signal challenges in sustaining bullish momentum, prompting strategic adjustments to align with the evolving market landscape.
MyCryptoParadise
iFeel the success🌴

RNDR/USDT planning for bullish move? 👀 🚀 RNDR Today analysis💎 Paradisers, let’s delve into the #RNDRUSDT analysis! An intriguing shift has occurred as it breaks free from its descending channel, setting the stage for an exciting potential bullish surge.
💎 Over an extended period, #RNDR has meticulously traced the contours of a descending channel. Currently, the price is testing a critical support level at $7.947. Our confidence in its ability to embark on a bullish trajectory remains steadfast, challenging the overhead resistance.
💎 However, prudent preparation is crucial: should the price dip below the pivotal support zone, we may witness a pronounced bearish downturn. In such a scenario, our focus shifts to anticipating a bullish rebound from the lower support level at $6.541.
💎 Remember to employ sound trading strategies and implement proper stop-loss measures! Stay vigilant, monitor market movements, and eagerly await further insights.
MyCryptoParadise
iFeel the success🌴

TRX/USDT assessing key support? 👀🚀TRON analysis💎 Attention, Paradisers! Keep a close eye on #TRXUSDT. It’s currently showing a promising upward trend from a critical support zone at $0.10921.
💎 Historically, #TRON has adhered to a descending channel pattern, consistently forming lower lows and lower highs. Right now, it’s positioned at a crucial support level of $0.10921. If the price maintains its momentum here, we could be on the verge of a significant bullish surge.
💎 As prudent traders, we need to be prepared for various scenarios. While a bullish rebound from a lower support level at $0.10017 remains a possibility, dipping below this level could trigger a marked bearish downturn.
💎 Stay adaptable with your strategies and make well-informed decisions, Ladies and Gentlemen of ParadiseClub. Your ParadiseTeam is diligently monitoring the market to navigate these opportunities effectively.
MyCryptoParadise
iFeel the success🌴

ASTR/USDT Showing a bounce this will be indicating bullish!💎 Paradisers, #ASTR has recently demonstrated significant market dynamics. After bouncing from the support area, ASTR is now facing the challenge of breaking out above the resistance trendline.
💎 A successful breakout would likely signal further upward movement, with the potential to reach the next target at the strong resistance area.
💎 However, if ASTR fails to break out above the resistance trendline and experiences rejection, there is a possibility of a downward movement toward the support area, which is located around $0.118 - $0.108.
💎 This could provide another opportunity for ASTR to gather momentum for another breakout attempt.
💎 ASTR must bounce from the support area to confirm a continuation of the upward movement. However, if ASTR breaks below the support area, it could indicate a bearish scenario, leading to further downward movement.
MyCryptoParadise
iFeel the success🌴

FTM/USDT planning for bullish move? 👀 🚀 FTM Today analysis💎 Paradisers, let’s dive into the #FTMUSDT analysis! A fascinating shift has unfolded as it breaks free from its descending channel, creating an exciting stage for a potential bullish surge.
💎 Over an extended period, #FANTOM has meticulously traced the contours of a descending channel. Presently, the price is testing a critical support level at $0.9116. Our confidence in its potential to embark on a bullish trajectory remains unwavering, challenging the overhead bearish order block (OB).
💎 However, prudent preparation is essential: should the price dip below the pivotal support zone, we may witness a pronounced bearish downturn. In such a scenario, our focus shifts to anticipating a bullish rebound from the lower support level at $0.8536.
💎 Remember to employ sound trading strategies and implement proper stop-loss measures! Stay vigilant, monitor market movements, and eagerly await further insights.
MyCryptoParadise
iFeel the success🌴

FLM/USDT is need breakout the resistance for confirm to bullish!💎 Paradisers, #FLM has recently shown significant market dynamics. Currently, FLM is encountering resistance.
💎 If FLM successfully breaks out above this resistance, it could signal bullish momentum and lead to further upward movement, possibly reaching the strong resistance area.
💎 However, if FLM fails to break out of the resistance and experiences rejection, there is a possibility of a downward movement towards the support area around $0.11. This could allow FLM to gather momentum for another breakout attempt.
💎 When FLM reaches the support area, it needs to bounce to maintain bullish momentum and attempt to break out of the resistance again. However, if FLM fails to bounce from the support and breaks below it, it could indicate a bearish trend continuation, leading to further downward movement.
MyCryptoParadise
iFeel the success🌴

PUNDIX/USDT A successful break the key resistance will bullish!💎 Paradisers, #PUNDIX has recently exhibited significant market dynamics. Currently, PUNDIX is attempting to move upward and break out of the key resistance area.
💎 However, it has faced rejection multiple times in the past when trying to break out. If PUNDIX successfully breaks above the resistance area this time, it could potentially continue its upward movement and reach our target area at the strong resistance level.
💎 On the other hand, if PUNDIX fails to break out of the resistance area once again, there is a possibility of it retracing back to the support area around $0.76 to gather momentum for another attempt.
💎 At the support area, it is crucial for PUNDIX to bounce and resume its upward movement in order to make another breakout attempt. However, if PUNDIX breaks below the support, it could confirm a bearish trend continuation, leading to further downward movement.
MyCryptoParadise
iFeel the success🌴

VET/USDT bullish momentum from demand? 👀🚀Vechain analysis💎 Paradisers, let’s delve into the intriguing movement of #VETUSDT. Currently, it’s retracing and meticulously retesting a critical demand level at $0.04248. This level holds immense importance, and its ability to transition from a retest to a firm support could be a bullish signal.
💎 After successfully breaking out of a descending channel, the price of #VeChain is now confidently approaching the key demand level at $0.04248. If the price sustains its momentum at this level, we can anticipate a bullish reversal. With sustained upward momentum, the target lies above the formidable resistance at $0.061831.
💎 However, should the price of NYSE:VET dip below this pivotal zone, it’s crucial to adapt our strategy. We foresee a bullish rebound from the secondary support level at $0.03791. Failing to regain ground here could potentially lead to further declines. Stay vigilant and agile as we navigate these market fluctuations!
MyCryptoParadise
iFeel the success🌴

MATIC/USDT assessing key support? 👀🚀Polygon analysis💎 Paradisers, pay close attention to #MATICUSDT. It’s currently displaying a promising sign of an upward trend, having recently broken above its descending trendline. This sets the stage for a potential bullish move
💎 Historically, #POLYGON has adhered to a descending channel pattern, consistently showing lower lows and lower highs. At present, it’s positioned at a crucial support level of $0.9296. If the price maintains its momentum here, we’re on the brink of a significant bullish surge.
💎 As prudent traders, we must be prepared for various outcomes. While a bullish rebound from a lower support level at $0.8335 remains a possibility, dipping below this level could trigger a marked bearish downturn.
💎 Keep your strategies versatile and your decisions well-informed, Ladies and Gentlemen of ParadiseClub. Your ParadiseTeam is diligently monitoring the market to navigate these opportunities effectively
MyCryptoParadise
iFeel the success🌴

FARM/USDT Breakout alert!! It's bullish momentum for FARM.💎 Paradisers, #FARM has recently demonstrated significant market dynamics, particularly with a breakout above a key resistance level accompanied by strong volume and bullish candlesticks.
💎 There's potential for FARM to undergo a retesting phase on the support area around $68 - $60 before continuing its upward movement and possibly back testing the strong resistance area.
💎 However, if FARM fails to bounce during the retesting phase at the support area, it could indicate a weakness in the bullish momentum. In such a scenario, there's a risk of a breakdown below the support level, potentially leading to a decline towards the Bullish OB area.
💎 FARM must bounce from the Bullish OB area and reclaim the price above the $68 support level to maintain bullish momentum. Failure to do so may result in continued downward movement.
MyCryptoParadise
iFeel the success🌴

COTI/USDT Showing a bouncing, bullish momentum for back to up?💎 Paradisers, #COTI has recently exhibited notable market dynamics, particularly with a bounce from the support area.
💎 Historically, when COTI hits this support level, it tends to sustain and rebound, suggesting a similar pattern may unfold now. There's potential for the price to test the strong resistance area if this pattern continues.
💎 However, a breakdown below the support area could signify a bearish trend, leading to further downward movement towards the $0.11 support level.
💎 It's crucial for COTI to bounce from the support and reclaim the price above it. Failure to do so could result in continued downward movement.
MyCryptoParadise
iFeel the success🌴

ALGO/USDT bullish reversal from support ? 👀🚀ALGO analysis💎 Paradisers, let’s delve into the intriguing movement of #ALGOUSDT. Currently, it’s retracing and meticulously retesting a critical support level at $0.2162. This level holds immense importance, and its ability to transition from a retest to a firm support could be a bullish signal.
💎 After successfully breaking out of a descending channel, the price of #ALGO is now confidently approaching the key support level at $0.2162. If the price sustains its momentum at this level, we can anticipate a bullish reversal. With sustained upward momentum, the target lies above the formidable resistance at $0.3277.
💎 However, should the price of EURONEXT:ALGO dip below this pivotal zone, it’s crucial to adapt our strategy. We foresee a bullish rebound from the secondary support level at $0.1939. Failing to regain ground here could potentially lead to further declines. Stay vigilant and agile as we navigate these market fluctuations!
MyCryptoParadise
iFeel the success🌴

FIL/USDT Shows a Bullish momentum for continue upward movement!💎 Paradisers, #FIL has recently displayed notable market dynamics, particularly as it approaches the resistance trendline of the bullish pennant pattern.
💎 If FIL successfully breaks out of this pattern, it could signal a continuation of the downward movement, possibly testing the bearish OB and supply area.
💎 However, there's also the possibility of FIL retracing back to the support area for another bounce and potential upward movement.
💎 On the other hand, if FIL breaks below the support, it could confirm a bearish momentum, leading to further downward movement.
MyCryptoParadise
iFeel the success🌴

TFUEL/USDT ascending trendline bullish horizon?👀🚀TFUEL💎 Paradisers! Get ready for an exciting trading opportunity with #TFUELUSDT! The price action is beautifully following an ascending trendline consecutively, and our optimism is high. We anticipate that the price will tap this trendline for the third time, setting the stage for a bullish trajectory.
💎 Reflecting on the past, SEED_DONKEYDAN_MARKET_CAP:TFUEL encountered challenges in surpassing the resistance at $0.10454, leading to a bearish sentiment. However, the tides seem to be turning. The price is steadily approaching the trendline, and there’s a significant probability of a bullish continuation if it successfully regains momentum at this level.
💎 As savvy traders, we always have a Plan B. Should #TFUEL dip below the ascending trendline, we’re strategically positioned to capitalize on a bullish rebound from a lower support level around $0.07678. But exercise caution—breaching this additional support could signal a deeper decline.
💎 Stay adaptable in your strategies and keep a close eye on the charts, fellow Paradisers. Your ParadiseTeam is here to guide you through these market waves with expert insight. Happy trading!
MyCryptoParadise
iFeel the success🌴

SAND/USDT Shows a bouncing from the support, Back to upward ??💎 Paradisers, #SAND has recently exhibited notable market dynamics, demonstrating resilience with a bounce from the support area.
💎 The historical pattern suggests that when SAND reaches this level, it tends to bounce, indicating strong support. If SAND also manages to break out of the bullish pennant pattern, it could signal a continuation of the upward movement toward the strong resistance area.
💎 However, if SAND breaks below the support area, it could signify a bearish momentum, potentially leading to further downward movement towards the next support level at $0.464.
💎 It's crucial for SAND to bounce from the support area and reclaim the price above this level to maintain its upward trajectory. Failure to do so could result in continued downward movement.
MyCryptoParadise
iFeel the success🌴

ANKR/USDT bullish momentum? 👀🚀ANKR Analysis
💎 Attention, Paradiser’s!#ANKRUSDT pair has caught our eye with its intriguing dynamics. Currently, it’s hovering near a crucial weekly support zone, suggesting a high probability of a bullish trajectory.
💎 Recent Developments: #ANKR is diligently tracing both high and low trajectories. At present, it’s steadily maintaining momentum around the weekly support level of $0.05901. The upward thrust aims to breach the weekly resistance.
💎 Bullish Continuation: If #ANKR sustains this momentum, it could initiate a bullish trend from the demand level at $0. 04672.However, a break below this demand level might signal a bearish downturn.
💎 Remember, while some newcomers may be tempted to go long, it’s essential to stay vigilant and anticipate market moves. Being one step ahead can make all the difference!
MyCryptoParadise
iFeel the success🌴

OP/USDT Bullish Reversal on the Horizon? 👀🚀OP Analysis💎 Paradiser, get ready for an exciting trading opportunity with #OPUSDT! The current setup suggests a bullish turnaround from its support and FVG.
💎 Reflecting on the past, $OPTIMISM faced challenges in surpassing its previous high, resulting in a bearish sentiment. However, the tides appear to be shifting. At the support level of $2.619, which has already piqued buying interest, there’s a strong chance of a bullish shift targeting the significant supply zone at $4.803.
💎 As savvy traders, we always have a Plan B. If #OP dips below our critical support at $2.619, we’re poised to capitalize on a bullish rebound from a lower support and the Bullish OB at $2.116. But exercise caution, as breaching this additional support could indicate a deeper decline.
💎 Stay adaptable in your strategies and keep a close eye on the charts, fellow Paradisers. Your ParadiseTeam is here to guide you through these market waves with expert insight.

SasanSeifi 💁♂BITCOIN Daily BINANCE:BTCUSDT 🪙 In the daily timeframe, the trend is moving between the ranges of $73,700 and $60,700 in a fluctuating manner. As you can see, the price has experienced a slight increase, and after the increase, it faced a negative reaction from the price range of $71,400 and is currently trading at $65,100.
🔺One scenario we can consider in the daily timeframe is that the price may experience some corrections until the lower range of the box, around $64,800/$62,900. Then, if confirmed in lower timeframes, we can expect a positive reaction from the price around these areas. To better understand the continuation of the trend, we need to see how the price reacts to these areas.❗️
🔺Additionally, if the price faces selling pressure and breaks below the $60,700 price range, the probability of a further correction to $59,000 increases. In case the correction continues, the next targets are also indicated in the image above.✌️
This is not financial advice, though❗ Do research before making investment decisions.
Sure, if you have any more questions or need further clarification, feel free to ask. I'm here to help!✌
if you found my analysis helpful, I would appreciate it if you could show your support by liking and commenting. Thank you!🙌

EGLD /USDT Ascending Trendline and Support Level? 👀🚀EGLD💎 Paradisers #EGLD is currently aligning itself along an ascending trendline. This trendline intersects with a critical support level at $46.76.The confluence of these factors raises the probability of bullish horizons. If #EGLD can maintain momentum at this level, we might witness a delightful upward surge.
💎 Our keen-eyed observations reveal that #EGLD has recently formed a double-top pattern, followed by a subsequent downward trend.However, there’s hope on the horizon. The price is now approaching the strong support level of $46.76, which coincides with the ascending trendline.The fact that the price has already respected this level twice, coupled with sustained upward momentum, suggests a potential bullish movement.
💎 As savvy traders, we’re always prepared for different scenarios. If #EGLD doesn’t rally as expected and this bullish setup falters, let’s keep our eyes on another critical level.Our Point of Interest (POI) shifts to the lower demand zone at $0.3467. A bullish rebound from this point could be in the cards.
💎 However, a word of caution: breaking below this point might signal a significant downward trend. Stay vigilant, adapt your strategies, and may the crypto winds be ever in your favor!
