ETH Rejection Incoming? Don’t Fall for This Bull TrapYello Paradisers, are you watching how ETH is reacting right now at this key zone? This could either turn into a textbook bearish setup… or catch everyone off guard. Let’s break it down 👇
💎ETHUSDT is currently hovering at a critical resistance area, perfectly aligned with both a key Fibonacci retracement zone and the 200 EMA—classic confluence. What makes it even more concerning is the bearish divergence, which is strengthening the probability of a downside rejection from this level.
💎To add fuel to the fire, the price action has just taken liquidity (inducement) above the previous highs, another bearish signal that supports the idea of a potential reversal from here.
💎However, this bearish bias will be fully invalidated if ETH manages to break and close a candle above the resistance zone. That kind of price action would suggest strength from buyers and a likely continuation to the upside.
💎In that case, it’s wiser to stay patient and wait for a cleaner setup at a better price. Rushing into a trade at this stage, especially in a moment of indecision, is not how pros operate.
If you want to be consistently profitable, you need to be extremely patient and always wait only for the best, highest probability trading opportunities.
MyCryptoParadise
iFeel the success🌴
Cryptotraders

JASMY: Will You Catch the Breakout or Get Caught in the Trap?Yello Paradisers, did you catch the textbook pattern quietly forming on JASMY while most of the market remains distracted? Because what comes next could catch the majority off guard.
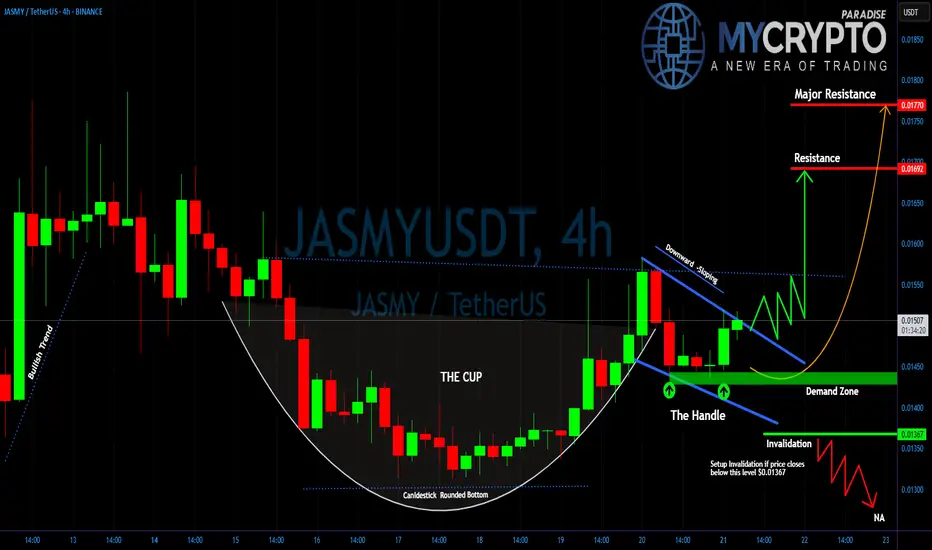
💎#JASMYUSDT is currently forming a classic Cup and Handle pattern. After a strong impulsive move, the price retraced in a rounded bottom structure, completing what now looks like the cup. The current consolidation has created the handle a downward-sloping corrective move that’s showing early signs of exhaustion.
💎What adds even more strength to this setup is that the price is now trading above both the 50 EMA and 200 EMA on the 4H timeframe. This signals a solid bullish bias and confirms that the overall momentum remains in favor of the bulls. When the price holds above both moving averages during a consolidation phase, it often indicates that a strong continuation move is brewing.
💎The price is also respecting a well-defined demand zone between 0.01430 and 0.01450. As long as this area holds, the probability of a bullish breakout remains high. A break above the descending handle resistance will be the first true confirmation.
💎If that breakout is supported by volume and sustained price action, we expect a move toward the first resistance at 0.01698. Beyond that, the final target for this pattern lies at the major resistance zone around 0.01785, where significant selling pressure could return. However, discipline is key. If JASMYUSD breaks below 0.01367, the handle structure would be invalidated.
Stay focused, Paradisers. Be the hunter, not the hunted
MyCryptoParadise
iFeel the success🌴
FINAL LEG OF THE ZIGZAG CORRECTION ?Yello, Paradisers! Are we about to see the end of this correction, or is there still one more shakeout coming? Let’s break it down.
💎The market is currently unfolding within a Zigzag Correction (A-B-C) pattern, and we appear to be in Wave C the final leg of this structure. Wave A has already played out with a sharp downward move, followed by Wave B, which acted as a countertrend rally. Now, Wave C is in progress, forming the last phase of this corrective cycle.
💎Since this is a 5-3-5 Zigzag Correction, the third wave of Wave C has already developed, meaning the market is nearing a critical Demand Zone at 4.0283. This level is a strong support zone where a potential reversal could occur. If the price reacts positively from this area, it could mark the end of the correction and signal the beginning of a new bullish phase, starting Wave 1 of the next uptrend.
💎However, if the price remains trapped between the Moderate Support and Moderate Resistance zones, we may see an extended period of sideways consolidation before any decisive move. A key confirmation to watch is the RSI approaching oversold conditions, which would indicate that downward pressure is weakening and the probability of a bullish reversal is increasing.
As always, Paradisers, the key to profiting in this market is waiting for high-probability setups. If this correction is indeed ending, the next move could be explosive. Stay sharp, stay disciplined, and trade smart!
MyCryptoParadise
iFeel the success🌴

Is #XLM Setting Up for a Bull Trap Before a Major Drop?Yello, Paradisers! Is XLMUSD gearing up for a breakout, or is this just a classic liquidity grab before the next major dump? Let’s break it down.
💎Right now, #XLMUSDT is testing a minor resistance at $0.28464, a level where price has repeatedly struggled to push higher. While there is a possibility of a breakout, the presence of strong liquidity around the unmitigated supply zone at $0.31917 suggests that any move higher could be a trap before a significant drop. If price does manage to break above this resistance, traders should be cautious it’s likely just a liquidity grab before a larger move to the downside.
💎Once the price reaches the unmitigated supply zone, a rejection is expected, leading to a downward move toward the key support zone at $0.22699. This level has historically been a strong demand area where buyers could step in, potentially causing a temporary bounce or consolidation before any further downside.
💎As CRYPTOCAP:XLM moves lower, it’s crucial to watch volume activity. If the decline happens with high volume, it will confirm strong selling pressure and increase the likelihood of a deeper drop. However, if the price approaches $0.22699 with low volume, it could indicate a lack of seller conviction, leading to a short-term bounce before resuming the downtrend.
💎The EMA 200 continues to act as dynamic resistance, reinforcing the bearish outlook. As long as price fails to hold above $0.28464 or gets rejected from the supply zone, the bearish setup remains intact. In that case, a move toward $0.22699 and potentially even $0.19151 becomes highly probable. Watching volume reactions at these key levels will be essential to confirm the next move.
💎The only scenario that could invalidate this bearish setup is a strong close above $0.36172 with high volume. That would signal a potential shift in market structure and could indicate renewed bullish momentum.
Paradisers, patience and precision are key in this market. Let the levels guide you, trade strategically, and stay disciplined. Avoid emotional decisions this market punishes the impatient and rewards those who stay focused.
MyCryptoParadise
iFeel the success🌴

SOLUSDT Breakdown WarningYello Paradisers! Have you spotted what’s happening with SOLUSDT right now? A major breakdown just played out, and this could be the beginning of a much deeper bearish move that many are underestimating.
💎SOLUSDT has broken down from a rising wedge pattern—an important bearish structure that often signals upcoming downside pressure. Before the drop, it swept liquidity, a typical smart money move, and has now confirmed a bearish Change of Character (CHoCH). This combination significantly increases the probability of further decline.
💎If we see a pullback into the resistance zone—it could offer a strong short opportunity with good risk-to-reward ratio. That’s where professional traders start looking to position themselves carefully.
💎However, this bearish idea has a clear invalidation point. If price breaks out and closes a candle above that invalidation level, then the bearish outlook becomes void. In such a case, it’s wiser to stay patient and wait for more precise, high-probability setups to develop.
🎖Strive for consistency, not quick profits. Treat the market as a businessman, not as a gambler. Stay disciplined, Paradisers, and wait only for the cleanest, most reliable trading opportunities. That’s how you make it in this game.
MyCryptoParadise
iFeel the success🌴

DOT About to Break Down? Don’t Fall for the TrapYello Paradisers! Could this "bullish" pump on DOTUSDT be leading traders straight into a bear trap?
💎DOTUSDT is currently forming an ascending channel, which is historically a bearish pattern. These setups often lure in breakout traders before reversing sharply, shaking out weak hands and triggering stop-losses.
💎The price is now approaching a critical resistance zone, where the Fibonacci golden pocket overlaps with the 200 EMA — a powerful confluence. If DOTUSDT grabs liquidity above the recent highs, it would significantly increase the probability of a bearish reversal from that region.
💎For safer, more conservative traders, the best strategy here is to wait for confirmation of a bearish pattern within this area. That would offer a stronger risk-to-reward ratio while allowing more control over trade execution. Patience pays, especially when the market tempts you with low-conviction breakouts.
💎However, if price breaks out and closes decisively above the invalidation level, then the entire bearish idea becomes invalid. At that point, it’s essential to step back and reassess the structure rather than forcing a trade.
Discipline is what separates professionals from gamblers. This setup demands patience, a level head, and an understanding of risk management.
MyCryptoParadise
iFeel the success🌴

RAYSOL/USDT – READY TO BLAST OFF? PRIME LONG SETUPThis is where smart money is likely to reaccumulate before pushing price higher.
We're targeting internal liquidity levels and prior highs with a clean risk-reward structure.
Confirmation can come from a bullish reaction or engulfing candle within the zone.
Entry Zone: 2.25 – 2.28
Targets:
TP1: 2.365
TP2: 2.485
TP3: 2.660
Stop Loss: 2.151
DYOR:
This idea is for educational purposes and reflects a personal trading plan.
Always do your own research, use strict risk management, and wait for confirmation before executing.
#RAYDIUM #RAY #RAYSOL #RAYUSDT

XLM Is About to Trap Thousands of Traders ?Yello Paradisers are you prepared for the next major move on XLM, or are you walking straight into the bull trap? We’re now approaching a critical decision point on XLMUSD that could shake out a lot of traders who are only reacting instead of planning. Here's exactly how we're playing it, step by step.
💎#XLMUSDT is currently trading inside a descending channel. As of now, we see a high-probability scenario where the price gets rejected from the descending resistance, setting up an ideal short opportunity with the current structure still favoring sellers. Should this rejection play out, we expect a breakdown of the moderate support level, with our target set at the $0.1970 zone.
💎Adding more weight to this bearish outlook is the fact that XLM is trading below both the 50 EMA and 200 EMA. This technical alignment confirms broader weakness in the trend and reinforces that any breakout attempts at this stage are likely to be reactive rather than sustainable simply small retracements within a dominant bearish macro setup.
💎However, if price fails to respect the descending resistance and pushes higher, our next major decision area is the supply zone at $0.2537. At that point, as always, we’ll wait with full discipline for confirmation. We’ll be watching closely for clear bearish reversal patterns, such as an Evening Star or a Shooting Star, before taking action. Only a strong and confirmed breakout above the $0.2537 level would invalidate our bearish outlook and shift the market structure into bullish territory.
Stay focused, Paradisers. Be the hunter, not the hunted.
MyCryptoParadise
iFeel the success🌴

ADA Is Setting Up for a Trap? Watch This Level CloselyYello Paradisers– is ADA walking straight into a trap at resistance? The current structure is raising red flags, and traders should stay sharp.
💎ADAUSDT is moving within an ascending channel, which often signals a potential loss of bullish momentum—especially when price approaches a strong resistance area. Right now, it’s nearing a major zone that’s reinforced by the 200 EMA, acting as dynamic resistance. On top of that, a clear bearish divergence is forming, which further increases the likelihood of a downside move.
💎If price sweeps the highs to take liquidity and then prints a bearish reversal pattern from this zone, it could offer a strong short opportunity with an attractive risk-to-reward setup. This is the type of trade setup that disciplined traders focus on.
💎However, if ADA breaks out above the resistance and closes a candle above the invalidation zone, the bearish thesis is off the table. In that case, it’s smarter to stay patient and wait for cleaner price action rather than reacting emotionally.
🎖Strive for consistency, not quick profits. Treat the market as a businessman, not as a gambler.
MyCryptoParadise
iFeel the success🌴

Is PEPE About to Crash from Here? Key Bearish SignalsYello, Paradisers — have you been watching PEPE closely? Because if not, you might be walking right into a trap. We warned about this bearish setup in advance, and right now, PEPEUSDT is flashing multiple red flags that every serious trader needs to be aware of.
💎PEPE is currently sitting under heavy pressure at a confluence of resistance — the 200 EMA, the Fibonacci golden pocket, and a major supply zone. And here’s the critical part: it has just printed a bearish CHoCH (Change of Character), significantly increasing the probability of a deeper move down.
💎On top of that, the daily timeframe is showing bearish divergence, a classic warning sign that momentum is fading, while price tries to push higher. These conditions are aligning to suggest that the bulls may be running out of fuel.
💎If we do get a pullback, there’s potential for a high-probability short entry around the breaker block and the Fair Value Gap (FVG) zones — so keep a close eye there.
💎But be careful — this setup isn’t bulletproof.
💎If PEPE breaks out and closes a candle above our invalidation level, the entire bearish bias gets invalidated. In that case, the best move will be to stay on the sidelines and wait for stronger confirmation. Never force trades — especially in this kind of volatile setup.
🎖Strive for consistency, not quick profits. Treat the market as a businessman, not as a gambler. Our focus remains on executing only the highest-probability setups with proper risk management.
MyCryptoParadise
iFeel the success🌴

TAO/USDT – Bullish Reversal Setup Taking Shape#TAOUSDT is showing early signs of a potential trend reversal following a prolonged downtrend. Price has recently rebounded from a key major support zone between $164 and $192, where a bullish divergence with the RSI has emerged—indicating a possible shift in momentum.
A well-defined descending trendline has been acting as dynamic resistance since the November 2024 high. Currently, price is approaching a critical resistance level around $284.7. A confirmed breakout above this area would be a strong signal that the market structure is beginning to shift in favor of the bulls.
If price breaks and holds above this resistance, the next upside targets are:
$468
$480
$495.9, in line with previous supply zones and structural highs.
Momentum is also improving, with RSI crossing back above the 50 level, supporting the bullish case. However, a clean breakout with sustained volume will be key to validating this setup.
Levels to Watch:
Support: $192.8 and $164.1
Resistance: $284.7, followed by $468–$495.9
Until we see a confirmed breakout, caution is warranted. Failure to clear the trendline may lead to another retest of support.
Summary:
#TAO is setting up for a potential bullish reversal, but confirmation above $284.7 is critical. A move beyond that level could open the door for a significant upside continuation. As always, manage risk accordingly and wait for confirmation.

FLUX About to Explode or Break Your Portfolio? Yello Paradisers — are you ready for the next breakout play, or are you blindly walking into a trap? FLUXUSDT is showing signs of a major decision point, and it could catch most traders off guard if they're not prepared. Here's exactly how we're planning it.
💎#FLUXUSD is currently trading within a wedge formation, and we're seeing a high probability of an upside breakout, especially if price is able to surpass the key resistance at $0.2291. In such a case, the next magnet is the internal supply zone at $0.2650 this is where we’ll start monitoring for potential trade setups.
💎This internal supply is a critical reaction zone. If price respects it and starts pulling back, we expect a retracement toward the support level at $0.1646. The high time frame structure remains bearish, which adds more weight to this retracement scenario being likely after tagging the internal supply.
💎Also, Flux is trading below both the 50 EMA and 200 EMA, confirming broader weakness in trend structure and making any short-term breakout more of a reactive move inside the macro bearish bias.If price doesn’t reject at the internal supply zone and breaks through it cleanly, we’ll be looking for a strong reversal from the Ultra TF supply zone at $0.3115. That’s the higher level of confluence we trust more in the bigger picture.
💎At this level, we’ll wait patiently as always and look for clear bearish reversal patterns like an Evening Star or a Shooting Star. Only a confirmed breakout above $0.3115 would change the game entirely by shifting the overall market structure and invalidating this current bearish setup.
Stay focused, Paradisers. Be the hunter, not the hunted.
MyCryptoParadise
iFeel the success🌴

STX Bulls Beware: Is This the Calm Before a Massive Drop?Yello, Paradisers! Are you seeing what we’re seeing on STXUSDT? If not, now’s the time to pay attention—our recent predictions on bearish setups are starting to unfold again, and this one might catch many off guard. Let’s break it down.
💎Currently, STXUSDT is flashing some serious warning signs. We’re spotting a clear bearish Change of Character (CHoCH) in play, which is being reinforced by a Head and Shoulders pattern—a combination that significantly increases the probability of a downside move.
💎To make things worse for the bulls, there’s an unfilled Fair Value Gap (FVG) sitting just below the current price. This acts like a magnet and could drag the price downward as liquidity gets targeted.
💎However, if STXUSDT manages to bounce from current levels, we’ll be closely watching the Order Block (OB) and Fibonacci Golden Zone as potential entry points. These could offer an excellent risk-to-reward (RR) setup if the bearish scenario gets temporarily rejected.
💎But here’s the key invalidation point: if price breaks and closes above the OB zone, the entire bearish thesis falls apart. In that case, we’ll step aside and wait for stronger confirmation before jumping back in. No need to rush—better opportunities always come with clear setups.
🎖Trade smart, Paradisers. The market doesn't care about your bias—it rewards only patience, precision, and discipline. Stick to your trading plan, and don’t let FOMO or fear drive your decisions.
MyCryptoParadise
iFeel the success🌴

GRASS/USDT –Trend Confirmation & Profit Target StrategyTrading Setup: GRASS/USDT Perpetual Contract
Entry Point: $1.61
Stop Loss: $1.5198
Take Profit Targets:
TP1: $1.7163
TP2: $1.7895
TP3: $1.8853
Strategy Overview
Trend Confirmation: Monitor price action for Break of Structure (BOS) or Change of Character (ChoCH) for entry validation.
Risk Management: Position size adjusted to maintain optimal risk-to-reward ratio..
This setup ensures a structured trade approach while managing risk efficiently. If you need refinements or additional indicators, let me know!

BANDUSDT Breakdown or Reversal?
Yello, Paradisers. Have you been watching #BAND lately? The setup is tightening, and it’s only a matter of time before a major move plays out one that could trap both early bulls and stubborn bears. The key now is preparation, not prediction.
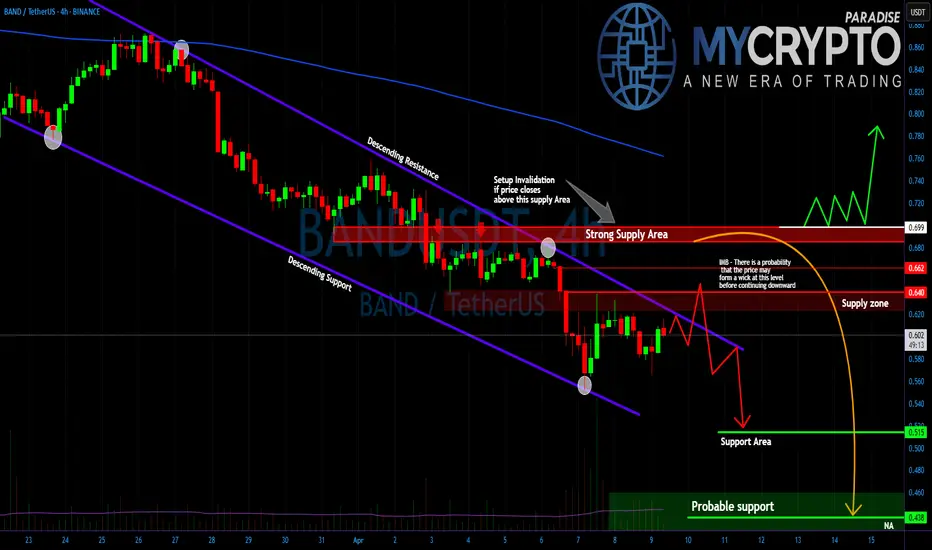
💎#BANDUSDT continues to move within a clean descending channel, respecting both trendline resistance and support. The broader structure shows a clear downtrend, and at this stage, there's a strong probability that price may first push upward with a wick to fill an existing imbalance only to reject and continue lower. These kinds of deceptive moves are common during market weakness and are often designed to trap breakout traders before the real direction is confirmed.
💎#BAND price remains firmly below both the 50 and 200 exponential moving averages, which confirms that the larger trend is still bearish. The 50 EMA is currently acting as dynamic resistance, capping any short-term upside attempts. Meanwhile, the 200 EMA adds further weight to the bearish case, as price has consistently failed to reclaim or hold above it.
💎The most important level to the upside is 0.699. This is a clear supply zone, and unless the price can break and sustain above this level and reclaim both EMAs there will be no real shift in market sentiment. On the downside, 0.515 remains a critical support level. If price holds here, a short-term bounce is possible. However, if 0.515 breaks with momentum, the next key downside target becomes 0.438, marking a deeper markdown phase.
Stay focused, Paradisers. Be the hunter, not the hunted.
MyCryptoParadise
iFeel the success🌴
Is DOGE About to Crash Hard From This Trap Zone? Read Before LONYello Paradisers — could this be the perfect bull trap setting up before a bigger drop? Our previous analyses warned about these kinds of setups, and once again, DOGEUSDT is flashing multiple signals that suggest a high-probability reversal could be just around the corner.
💎Currently, DOGEUSDT is trading right inside the golden Fibonacci retracement zone, a level that often acts as a powerful area of rejection. What makes this zone even more significant is the confluence of additional bearish indicators aligning at the same point. Both the 100 and 200 EMAs are present, reinforcing dynamic resistance, and there are clear Fair Value Gaps (FVGs) visible on both the 4H and Daily timeframes. On top of that, a bearish divergence has now formed, signaling early exhaustion in bullish momentum and further reinforcing the potential for a downside move.
💎When these elements align, the probability of a rejection increases substantially. However, we’re not jumping in blindly. If DOGEUSDT starts to bounce from here and shows weakness—such as stalling below resistance—then we’ll be closely watching for confirmation patterns like a double top or a head and shoulders. These would not only validate the bearish narrative but also offer significantly better risk-to-reward ratios for short setups.
💎That said, every setup has its invalidation. If price breaks and closes candle above our invalidation level, then the entire bearish scenario must be considered void. In that case, the best approach would be to stand aside and wait for a cleaner structure to form before taking any action. There’s no reason to force a position in uncertain conditions.
If you want to be consistently profitable, you need to be extremely patient and always wait only for the best, highest probability trading opportunities.
MyCryptoParadise
iFeel the success🌴

Is This the Final Drop Before a Major Reversal? Read This NOW! Yello, Paradisers! Are we about to witness the final leg of this move, or is one last shakeout coming before a massive reversal? Let’s break it all down using Elliott Wave principles.
💎Wave 1 initiated the downtrend, marking a strong sell-off from higher price levels. Volume surged during this phase, signaling institutional selling and overall market panic. This aggressive downward move set the foundation for the corrective Wave 2.
💎Wave 2 began as the price rebounded after hitting the local low at $1.406. This move aligns with a typical Elliott Wave correction, often retracing 50%–61.8% of Wave 1. The recovery phase pushed the price back up, potentially reaching as high as $1.964 before the next major move.
💎Wave 3, the strongest and longest in the sequence, started once the price failed to sustain above $1.964. This move could extend all the way down to $0.809, a critical level where selling pressure is expected to peak. Historically, volume is highest during Wave 3, indicating aggressive selling and potential accumulation zones forming.
💎Wave 4 might be unfolding right now, forming a short-term recovery. If the price retraces toward $1.392 but fails to break above it, the bearish wave count remains intact. It’s crucial to note that Wave 4 must NOT enter the price range of Wave 2—if it does, the entire Elliott Wave structure is invalidated, suggesting an alternative pattern like an ending diagonal or a larger correction.
💎Wave 5 is the final impulse wave. If Wave 4 faces rejection below $1.392 and consolidates, the market could see the beginning of Wave 5, pushing price toward the $0.746 support zone. This phase typically marks the last exhaustion move before a potential market reversal or a shift in structure.
Patience and strategy win the game, Paradisers! The market is designed to shake out weak hands before the real move happens.
MyCryptoParadise
iFeel the success🌴

ARBUSDT: What Happens Next Could Shock ManyYello, Paradisers! Are you watching this key level hold by a thread? The market is giving us signals, but most traders are too distracted to see them. If you're not careful here, you’ll be on the wrong side of the next big move.
💎ARBUSDT is currently trading below both the 50 EMA and the 200 EMA, confirming a strong bearish bias in the market. The trend remains in a clear markdown phase, with price action continuing to respect the descending channel, and no clear signs of bullish reversal just yet.
💎We’re approaching a moderate resistance level around $0.32 has already shown signs of weakness if price fails again at this area, it will likely confirm that sellers are still dominating, increasing the probability of a renewed leg down.
💎If the market rejects at current levels, the first key support to watch is around $0.2847, which could be hit quickly. However, the real danger lies below. A breakdown beneath the $0.2847 zone would expose the market to significant downside pressure, opening the path for a much deeper correction.
💎With ARB trading below the 200 EMA, we must remain cautious. The trend remains bearish, and any short term rally into resistance is more likely to present a shorting opportunity than a bullish breakout.
💎Still, if the market manages to close decisively above the $0.35 mark, it could shift the structure and momentum, targeting $0.37 and higher in the short term. Until then, the bias remains with the bears.
Stay focused, Paradisers. Be the hunter, not the hunted.
MyCryptoParadise
iFeel the success🌴

SUSHI is Bleeding Out — Is This the Calm Before the Final Dump? Yello, Paradisers! Have you been ignoring SUSHI lately? That might be a mistake — because the price action is showing signs that a deeper drop could be just around the corner, and those not paying attention could get caught off guard. Let’s break it down.
💎#SUSHIUSDT is still trading below both the 50 EMA and the 200 EMA, a clear confirmation that the broader market structure remains decisively bearish. The 50 EMA continues to act as dynamic resistance, repeatedly rejecting price during short-lived pullbacks, while the 200 EMA sits significantly higher, further emphasizing the strength of the existing downtrend.
💎Adding to the bearish pressure, there’s a strong supply zone between $0.620 and $0.640. This zone has capped every bullish attempt, confirming heavy distribution at these levels. Until this zone is broken with volume and conviction, upside potential remains extremely limited.
💎One key level to watch in the short-term is the 50% Fibonacci retracement at $0.586, which has turned into a reliable interim rejection level. We expect the price to tap this level again before any meaningful downside continuation is likely to unfold.
💎As long as price fails to close above the $0.568 level, the structure will remain under pressure. A breakdown below the moderate support at $0.522 would likely trigger a move into the $0.485–$0.451 major support zone, where we could see more aggressive buyers or a potential reversal setup.
💎The only scenario that would invalidate this bearish outlook is a clean breakout and sustained close above $0.640, which would reclaim the supply zone and force shorts to cover. Until then, the path of least resistance remains to the downside.
Stay focused, Paradisers. Be the hunter, not the hunted.
MyCryptoParadise
iFeel the success🌴

ATOMUSDT – Accumulation Phase with Bullish Breakout Potential!ATOM is currently trading within a key accumulation zone, showing signs of potential reversal after a liquidity sweep below the 2024 bottom support level around 3.63 USDT. This move may indicate the presence of strong demand at lower levels.
As long as ATOM holds above the 3.63 USDT level on a daily closing basis, the bullish scenario remains valid. A sustained move above the 5.15 USDT resistance may confirm the start of a bullish breakout, with potential upside targets at 7.76 and 9.30 USDT.
However, a daily close below 3.63 USDT would invalidate the bullish bias and suggest further downside pressure.
Key Levels to Watch:
Support: 3.63 (bottom support of 2024)
Resistance: 5.15 (accumulation zone breakout level)
Bullish Targets: 7.76 and 9.30
The structure remains bullish unless invalidated by a breakdown below support. Always manage risk accordingly.
#ATOM #COSMOS #ATOMUSDT

Is TAOUSDT About to Dump Hard? Yello, Paradisers! Are you paying close attention to this subtle shift on TAOUSDT? Because what we’re seeing right now could easily trap late bulls before the real drop even begins…
💎TAOUSDT is currently displaying clear signs of a potential bearish reversal. We’ve observed a bearish Change of Character (CHoCH) developing from the 1H Fair Value Gap (FVG), which is a strong early indication of weakening bullish momentum. To add to this, price has also broken down below the 50 EMA, a technical signal that increases the probability of further downside movement. When both of these elements align, it’s often a precursor to a more significant pullback.
💎If TAOUSDT revisits the recent Fair Value Gap, the trade setup becomes even more attractive, offering a stronger risk-to-reward ratio. That would be the optimal level for entry. However, even from current price levels, the trade still offers a 1:1 risk-to-reward opportunity. While not ideal, it remains viable for more aggressive traders.
💎That said, the entire bearish setup becomes invalid if the price breaks out and closes a candle above the current resistance zone. In such a scenario, it would be wise to step back and wait for more reliable price action to develop before making any further decisions.
Strive for consistency, not quick profits. Treat the market as a businessman, not as a gambler.
MyCryptoParadise
iFeel the success🌴

SOL/USDT May SOL lose the weekly support? Key Level to buy!Hey traders! 👋 Let’s dive into the weekly chart for SOLUSDT.
📊 Current Price Action:
SOL is trading at $112.20, down 10.96% on the weekly chart. The price has been consolidating in a "Buying Zone" between the weekly support levels of $110.17 and $131.68. This zone has historically acted as a strong base, with the price bouncing from this area multiple times since late 2023.
🟢 Buying Zone and Support:
The current price is sitting in a critical "Buying Zone" between $110.17 and $131.68. This area has acted as a springboard for previous rallies, and if SOL holds above $110.17, it could be a good opportunity for accumulation. A break below $110.17, however, might lead to further downside toward the next support at $80.18 or even $54.00.
🎯 Target:
If SOL manages to break through the $195.71 resistance, the next major target is its previous ATH at $260. I’ve projected a potential move to $295.71, which would be a 95.71% increase from the current price of $112.20. This target aligns with the historical price structure and Fibonacci extensions.
⚠️ Risk Management:
Keep an eye on the $110.17 support. A weekly close below this level could signal bearish momentum, potentially driving the price toward lower supports. On the upside, watch for a strong breakout above $195.71 with high volume to confirm the bullish scenario.
What do you think about SOL’s setup? Are you bullish or bearish on Solana? Let’s discuss in the comments!
#SOLUSD #Solana #Crypto #TechnicalAnalysis #Breakout

PEPE Ready to Dump? This Key Zone Could Trigger a Sharp ReversalYello Paradisers — did you catch the recent shift on PEPEUSDT? If not, now’s the time to zoom in, because the setup is looking primed for a big move, and you don’t want to be caught on the wrong side.
💎PEPEUSDT has broken out of Ascending Channel & shown a clear bearish CHoCH (Change of Character), confirming a shift in market structure. Following that, we’ve now seen a proper pullback. Currently, the price is sitting right at a critical resistance zone.
💎What makes this zone especially significant is the confluence of technical factors stacked at the same level — the 200 EMA, a Fair Value Gap (FVG), and the Fibonacci Golden Zone are all present. This combination significantly increases the probability of a bearish move from here.
💎If PEPE breaks out and closes a candle above our invalidation level, the entire bearish idea gets invalidated.
🎖Paradisers; the next 6–9 months will be juicy for some and painful for others. Discipline, patience, robust strategies, and trading tactics are the only ways you can make it long-term in this market.
MyCryptoParadise
iFeel the success🌴
