ROSE/USDT bullish horizon from key support? 🚀Rose Analysis💎Paradisers, get ready for a great chance to make some profit with #ROSEUSDT! It looks like it's about to go up, starting from a really important level.
💎 Looking into #ROSE, after slowing down a bit at the $0.13087 level, we're now looking at a big jump up from the $0.11165 level. This chance is really strong because there's a lot of support there, making it a good spot for a turnaround. Staying strong here could start us on an upward path.
💎 If BCBA:ROSE starts losing steam, we'll look for a big rebound from another strong support and gap at $0.10501. There's a lot of support there too, which makes us think it could really bounce back. But, if it drops below this key spot, it might mean we're heading for a downturn.
Cryptotraders

GMT/USDT Could GMT break the resistance and continue upward ??💎GMT has recently undergone significant market dynamics. Presently, GMT is undergoing an upward climb, with a backtest on the bearish OB underway. However, for GMT to sustain its upward trajectory, it needs to overcome the resistance in this area.
💎 A successful breakout above the resistance would pave the way for further upward movement. Additionally, breaching the Bearish OB would signify a bullish momentum, potentially leading GMT to reach our target strong resistance area.
💎 On the contrary, if GMT faces rejection at the resistance level, it could trigger a downward movement towards the demand area to establish new momentum. It's noteworthy that a Head and Shoulders (HNS) pattern is visible on the chart, indicating a potential reversal.
💎 Therefore, GMT must bounce back to the demand area. Failure to do so and a subsequent breakdown below the demand level would validate the HNS pattern, leading to a significant continuation of the downward movement.

API3/USDT Back test on demand, Indicating Continue the upward!💎API3 has recently exhibited significant market dynamics. Currently, API3 is potentially undergoing a backtest on the demand area, which was previously the key supply area.
💎 If API3 manages to bounce at this demand zone, there's a probability of continuing its upward trajectory and reaching our target area.
💎 However, if API3 fails to bounce and instead consolidates in this region, it could be interpreted as a bearish sign, indicating a potential breakdown. In such a scenario, API3 may face further downside pressure, with the next significant level of support being at the support area.
💎 Upon reaching the support area, API3 must bounce and reclaim the price above the demand zone if it intends to resume its upward movement toward the strong resistance level. Failure to do so could confirm a shift to a bearish trend, resulting in continued downward movement, potentially pushing the price further down.

APT/USDT Keep an eye on the support, If bounce APT will back UP!💎APT has recently shown significant market dynamics. Currently, APT is facing rejection after testing the Bearish OB zone and is now retesting the support area around 10.85 to generate new momentum for a breakout.
💎 If APT successfully breaks above the supply area, its probability could signal a continuation of the upward movement, potentially leading to reaching our target area.
💎 However, if APT fails to maintain the support area and breaks below it, the next critical level is the Bullish OB area. APT must bounce from this area, as failure to do so could result in losing the support trendline.
💎 If this occurs, APT may switch back to a downward trajectory, continuing further downward movement.

BCH/USDT Could BCH Break the key resistance or will be rejected?💎BCH has recently demonstrated significant market dynamics, currently facing a key resistance area.
💎 A successful breakout above this resistance could lead to a significant upward movement, probability reaching our target area.
💎 However, if BCH fails to break this key resistance level, it may face rejection and retreat towards the demand area around $289. This retracement could serve as an opportunity to build new momentum.
💎 If BCH fails to bounce from the demand area and attempts to break the resistance again, it could indicate weakness. In such a scenario, there is a possibility of a breakdown, with BCH returning to test the support of the ascending channel, and potentially moving even lower.

SUSHI/USDT Could Bounce from the support and break the pattern ?💎SUSHI has recently demonstrated noteworthy market dynamics. It is currently positioned on the support trendline of a Bullish pennant pattern, which is typically considered a bullish pattern.
💎 Furthermore, the daily close shows a hammer candlestick, suggesting potential bullish momentum if today's candle closes in the green.
💎 In such a scenario, SUSHI may climb upward toward the resistance of the pattern in an attempt to break out. A successful breakout probability could lead to a test of the strong resistance area.
💎 However, if SUSHI breaks below the support trendline, it will invalidate the Bullish pennant pattern, and there is potential for the price to move downward toward the demand area at 0.87, initiating a new momentum.
💎 The demand area holds significance as it may serve as a potential bounce point for the price, allowing it to reverse and move upward. Nevertheless, if the demand area is breached, this would be a bearish signal, indicating that the price is likely to continue its downward trajectory, ultimately reaching the strong support area.

BNB/USDT Keep an eye on Bullish Flag, Break or rejected ??💎 BNB has recently experienced significant developments in the market. It is currently exhibiting a Bullish flag pattern, which is considered a bullish continuation pattern.
💎 If BNB successfully breaks out of this pattern, there is a probability of a continued upward movement in price, with the potential to reach our target strong resistance area.
💎 However, if BNB fails to break out of the pattern, there is potential for the price to decline and return to retest the support area to establish new momentum. In a more bearish scenario, BNB could even drop back to the demand area around 266.
💎 The demand area is critical and would require a bounce to support the continuation of the upward movement. If BNB remains in a sideways trend with weak volume, this could be a concerning sign, as it may lead to a loss of demand or a breakdown of the area.
💎 In such a scenario, BNB would revert to a downward movement, and the support trendline would also be breached, potentially taking the price back to the strong support area.

CTSI/USDT If Break this resistance, CTSI will continue UP!💎 CTSI has recently witnessed significant developments in the market. Currently, CTSI is encountering a critical resistance area.
💎 If it successfully breaks through this resistance, it could trigger a bullish momentum, leading to a significant upward movement with the probability to reach our target at the strong resistance area.
💎 However, if CTSI fails to break through and shows signs of bearish rejection, similar to previous attempts, there is potential for the price to return to the demand area to establish new momentum.
💎 The demand area is of utmost importance and would require a bounce to maintain its bullish outlook. If CTSI fails to sustain above the demand and breaks below it, this could indicate a shift back to a downward movement, with the potential to return to the strong support area.

GALA/USDT It required GALA break out this area or continue down!💎 GALA's recent market trends have been particularly dynamic. Presently, GALA is exhibiting a rebound from the demand zone, navigating its way back toward a key resistance level that it previously breached.
💎 For GALA to sustain its upward momentum, it is critical for it to break through this resistance barrier. Achieving this breakout could see GALA advancing toward the projected strong resistance area, signifying a bullish progression.
💎 Conversely, if GALA struggles to overcome this resistance level or fails to reclaim its position above it, the likelihood of it reverting to the demand zone increases. In this scenario, GALA may need to gather additional momentum for another attempt at an upward trajectory.
💎 The demand zone's significance cannot be overstated in this context. Should GALA fail to hold its ground in this zone, or if it breaks below it, a bearish shift in the market trend may be triggered. Under these circumstances, GALA's path could lead to a further descent, targeting the next critical support area.

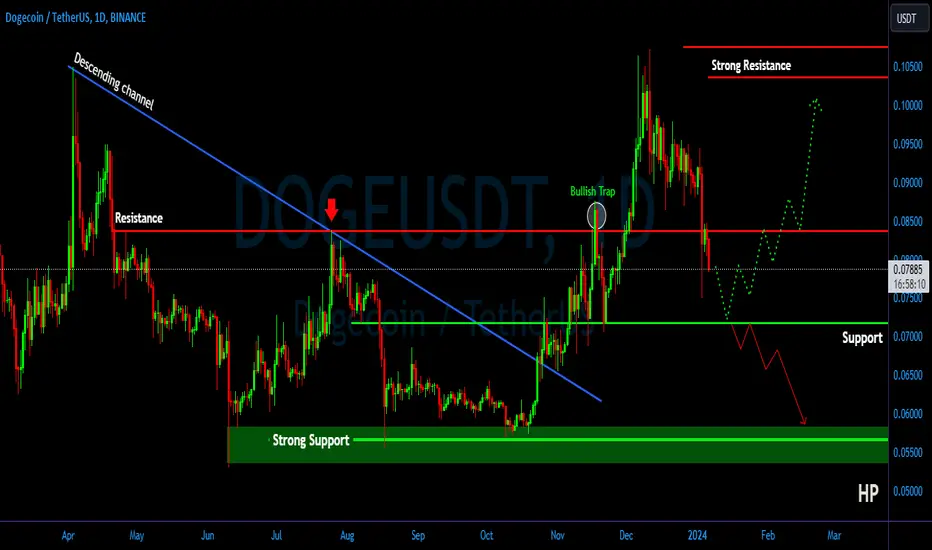
DOGE/USDT Need to reclaim back the resistance or go to support!💎 DOGE has recently experienced a notable downturn, breaching a significant support level that previously served as a resistance barrier. This development suggests a potential further decline in DOGE's value, with the next critical support level at 0.0718 emerging as a key area to watch. Market participants should closely monitor whether DOGE can stabilize and possibly rebound at this support level.
💎 However, if DOGE is unable to find footing and bounces back at the 0.0718 support level, the situation could worsen. A failure to hold this level would indicate a significant loss of bullish momentum, probability leading to a further decline towards the strong support level area.
💎 In the event DOGE manages to regain its strength and break above the resistance it previously breached, this could indicate a reversal of the current bearish trend. A successful reclaiming of this resistance level could pave the way for DOGE to advance towards higher resistance levels.
LPT/USDT Keep an eye! IF Breakout the resistance, PUMP is coming💎LPT has undeniably garnered significant attention in the market. Currently, it is in the process of climbing upward towards a resistance level, and coincidentally, the resistance trendline is also converging in that area.
💎 If LPT successfully breaks out of this resistance, it could trigger a substantial upward movement on the chart, probability reaching our target at the strong resistance area.
💎 Conversely, if LPT fails to break through the resistance, the price may retreat to retest the support bullish trendline. In such a scenario, the price must bounce from the support because a breakdown of the bullish trendline would indicate a shift back to a downward movement, with the support area around 5.95 as a possible target.
💎 Upon reaching the support, LPT needs to bounce from this level. To sustain the upward movement, LPT would need to reclaim the area above the support bullish trendline. Failure to do so could lead to the breakdown of the demand area, resulting in further downward movement in the price, possibly returning to the demand area or even lower.

UNI/USDT Break the key resistance area. Bullish Momentum ???💎 UNI has been a focal point in the cryptocurrency market, having recently achieved a significant breakthrough by surpassing a key resistance area and breaking out of a bullish pennant pattern.
💎 This advancement indicates a potential retesting phase at what was previously resistance, now serving as support. Successful retesting could pave the way for continued upward movement, with the next target being a strong resistance area.
💎 During this retesting phase, it's crucial for UNI to demonstrate a robust bounce off the support area to maintain its upward trajectory. Failure to hold this support level could result in UNI retreating to the demand area, specifically around the $6.1 mark.
💎 The $6.1 demand zone becomes a critical point for UNI. For the asset to resume its upward path, a strong rebound from this level is necessary, aiming to surpass and sustain above the former resistance level.
💎 This action is vital for continuing the upward movement towards the strong resistance. Conversely, if UNI fails to hold this demand level and breaks down, it could signal a shift towards a stronger support area.

ALICE/USDT In the crucial Moment, Bounce or Dumping will coming!💎 In the current market scenario, ALICE has shown a commendable bounce from its support bullish trendline. However, its next crucial challenge is to sustain above the resistance level in the daily closing candle. If ALICE is unable to maintain its position above this resistance level, it could validate a false breakout, potentially leading to a breakdown of the support bullish trendline.
💎 On the other hand, if ALICE manages to close the daily candle above the resistance level, it could signify a continuation of its upward trajectory. This would be in line with the current bullish trend observed in ALICE, characterized by its tendency to create higher highs. Successfully closing above the resistance may set ALICE on a path to achieve new highs, aligning with our target area.
💎 A critical scenario to watch out for is if ALICE breaks below its support bullish trendline. Should this occur, ALICE's next key support level to watch would be around $1.088. This level is pivotal for maintaining the bullish trend. A breach of this support could signify a shift in momentum, turning the market trend bearish for ALICE. This would potentially lead to a further decline, with ALICE targeting lower levels of strong support.

VET/USDT Ready to continue Upward Movement?? VET Analysis Today💎 VET has been a notable focus in the financial market, recently achieving a breakthrough by surpassing a significant resistance area, marked by a strong green candle. Following this breakout, VET has entered a valid retesting phase at what was previously a key resistance, now acting as support. This development indicates a probability for continued upward movement, with our next target being the Bearish OB area.
💎 However, should VET struggle to achieve new highs and sustain its upward trajectory, it might retreat back to retest the support level around $0.0345 in an attempt to gather new momentum. If, during this retesting phase, VET fails to demonstrate a strong bounce or bullish candle confirmation, there’s a risk that it could lose this support level, leading it back towards the lower demand area of $0.0265.
💎 The $0.0265 demand area becomes crucial in this scenario. For VET to resume its upward journey, a strong rebound from this level is necessary, aiming to reclaim and sustain above the resistance level. Conversely, if VET shows a lack of strong response at this demand level, indicating a potential breakdown, it could signal a shift to a bearish trend, possibly leading VET towards a stronger support area.

FET/USDT Strong Bullish Movement, Could FET Bounce from support?💎 FET has been a significant player in the cryptocurrency market, and its current position is key to its market trajectory. FET is undergoing a retesting phase at a support area, which was previously a key resistance level. If this retesting phase proves to be successful, we can expect FET to bounce off this support and continue its ascent, potentially creating new highs at a strong resistance area.
💎 However, if FET struggles to recover during this retesting phase and fails to show a positive response at the support level, there's a risk it could lose this support or even break below it. Such a scenario would shift FET's direction towards a downward movement, with the Bullish OB area becoming the next critical point.
💎 The Bullish OB area, particularly around $0.465, is pivotal for FET's market direction. For FET to resume its upward trend, it’s essential that it rebounds from this area and reclaims a position above the resistance level.
💎 Failure to bounce from the Bullish OB area or a breakdown below it could signify a shift to a bearish trend, potentially leading FET towards further decline to the demand area or even a stronger demand zone.

RNDR/USDT In the Crucial Area. Break out or rejected ??💎 RNDR has been garnering considerable attention in the market, though it has faced challenges in breaching a strong resistance area. Recently, RNDR experienced a setback after being rejected upon reaching this zone. A successful breakthrough of this resistance probability could lead to a significant upward trend, taking RNDR towards our set target.
💎 However, if RNDR struggles to break out and remains in consolidation at this resistance level over the next few days, there's a likelihood of facing another rejection. This could result in RNDR reversing its course back towards the support area.
💎 In the support zone, it's crucial for RNDR to demonstrate a robust recovery and attempt to overcome the resistance once more. If RNDR fails to show a positive response at the support area and breaks down further, it could indicate a shift back to a bearish trend. This could lead RNDR into a downward movement, potentially heading towards the bullish OB area.

CYBER/USDT Break a key area, Possible continue upward !!💎 CYBER has recently encountered significant market dynamics. Presently, it is encountering resistance in its price movement.
💎 A successful breakthrough of this zone would facilitate an easier breach of the resistance trendline, probability leading to movement towards our target area.
💎 However, if CYBER fails to surpass this resistance and faces rejection, there is a possibility of a downward movement towards the support trendline.
💎 The support trendline holds significant importance, as a breakout above it would signal a bullish trend continuation. Conversely, if the support is breached, it could indicate a shift back to a bearish trend, with the next target being the strong demand area.
💎 The strong demand area has historically proven to be resilient, providing support for CYBER's price. A bounce from this area could signify a reversal in trend. Nevertheless, if CYBER breaks below this area, it would confirm a continuation of the downward movement, potentially leading to further declines.

RSR/USDT Break out descending channel, Bullish Momentum for RSR?💎 RSR has recently experienced significant market dynamics. After breaking out of a descending channel, the price is currently undergoing a retesting phase before probability continuing its upward movement towards our target Bearish OB area.
💎 However, if RSR fails to bounce during this retesting phase and breaks below the support area, it could indicate a reversal in momentum, leading the price back downward towards the Bullish OB area.
💎 Historically, the Bullish OB area has acted as a strong support zone, with the price bouncing after reaching this level. Yet, if the Bullish OB area is breached, it may signal further downward movement towards the strong support area.

COTI/USDT Break alert!!! Ready for continue upward after retest!💎 COTI has recently undergone significant market dynamics. After breaking out of a major descending channel, it is currently in the process of a retesting phase at the trendline, coinciding with the demand area that was previously the supply zone.
💎 If this retesting phase proves successful, indicated by a bounce in price, Probability we may witness a substantial upward movement toward our target strong resistance area.
💎 However, if during the retesting phase at the demand area, COTI fails to show a favorable response such as a bounce or bullish candle rejection, it could signify a false breakout.
💎 In such a scenario, COTI may revert into the descending channel, leading to a downward trajectory towards the support level, or potentially even lower.

COMP/USDT Breakout the pattern, Ready to continue upward ??💎COMP has undoubtedly attracted significant attention in the market. Currently, it has broken out of the resistance trendline, signaling a bullish momentum.
💎 However, there is potential for a retesting phase before the price continues its upward movement. In such a scenario, COMP probability may return to the strong resistance area, especially considering the overall trend appears to be massively bullish.
💎 On the flip side, if COMP fails to bounce when undergoing the retesting phase at the trendline or even breaks down the bullish trend support, this could be concerning. A broken bullish trend would indicate a shift to a downward movement, and the next target would be the Bullish OB area.
💎 When COMP reaches the Bullish OB area, it is crucial for it to bounce from this level. To sustain the upward movement, COMP would need to reclaim the area above the bullish trend support. Failure to do so may result in the demand area breaking down, leading to further downward movement in the price.

STX/USDT Could STX continue upward movement or Downward?💎 STX has recently captured significant market interest. Currently, STX is showcasing a positive trend, having broken through a key resistance level and now undergoing a retesting phase at a support level that previously acted as resistance.
💎 There is the probability for STX to resume its upward trajectory, aiming for the strong resistance area near its all-time high.
💎 However, should STX falter in its ascent, a reverse trend might ensue, leading it back to the support area for a potential rebound.
💎 In this crucial support zone, STX must demonstrate resilience and bounce back to maintain its upward trend. A failure to hold above this support level and a subsequent breakdown could be a negative indicator, signaling a possible shift to a bearish trend.
💎 This could lead to a downward movement towards the demand area, and potentially even to a more substantial support level. Such a development would require close observation for its impact on STX's market direction.

GTC/USDT Break Alert! If also break the supply. Pump is coming!💎 GTC has recently demonstrated notable market dynamics by breaking out of a descending triangle pattern and undergoing a retesting phase, signaling bullish momentum.
💎 However, a key obstacle lies ahead at the supply area. If GTC manages to successfully break out above this supply zone, we can anticipate significant upward movement, potentially targeting our desired Bearish OB area.
💎 Conversely, if GTC fails to breach the supply area and faces rejection, the price may retreat to the demand area around 1.06 to gather new momentum for another attempt at breaking above the supply zone.
💎 The demand area has historically served as a strong level of support for GTC, with previous bounces reinforcing its significance. Nevertheless, a failure to bounce and subsequent breakdown of the demand zone could signal further downward movement towards the strong support area.
💎 This strong support area presents a lucrative buying opportunity for GTC traders, as a significant bounce or further downward movement may ensue.

YGG/USDT Breakout the Bullish Pennant! Bullish Momentum for YGG💎 YGG has recently demonstrated notable market dynamics, breaking out of the Bullish pennant pattern, signaling bullish momentum for continued upward movement.
💎 The trend appears to be strongly bullish, consistently forming new higher highs. With this breakout, YGG may likely reach our target area near the bearish Order Block (OB).
💎 However, if YGG fails to sustain upward momentum and experiences a false breakout, there's potential for the price to retreat to the demand area to establish new momentum, or even descend towards the support of the bullish trendline.
💎 The support provided by the bullish trendline is a crucial level, necessitating a bounce to sustain upward movement. Conversely, if this support level is breached, it could indicate a bearish shift, prompting further downward movement.
