CTK/USDT in Danger? Key Levels That Will Decide the Next MoveYello, Paradisers! Is CTK/USDT on the verge of a major breakdown, or will bulls make a comeback? Let’s dive in!
💎#CTKUSDT has broken below its ascending channel, signaling a potential trend shift. Right now, the $0.41 - $0.42 level, which previously acted as strong support, has turned into resistance. This is a critical area if buyers fail to reclaim it, the selling pressure will likely continue. Adding to the bearish outlook, price is trading below both the EMA 50 and EMA 200, further confirming that sellers remain in control.
💎A fair value gap (FVG) near $0.41 could act as a magnet for a short-term bounce, but unless price reclaims this level with strength, the downtrend remains intact. If the rejection plays out, the next target to the downside is $0.3484, with a deeper drop potentially reaching the major support zone at $0.3091.
💎On the flip side, a break above the major supply zone at $0.4631 would completely invalidate the bearish setup and open the door for another strong rally. However, as it stands, the market structure favors further downside, and a rejection at resistance could accelerate the decline.
MyCryptoParadise
iFeel the success🌴
Cryptotraders

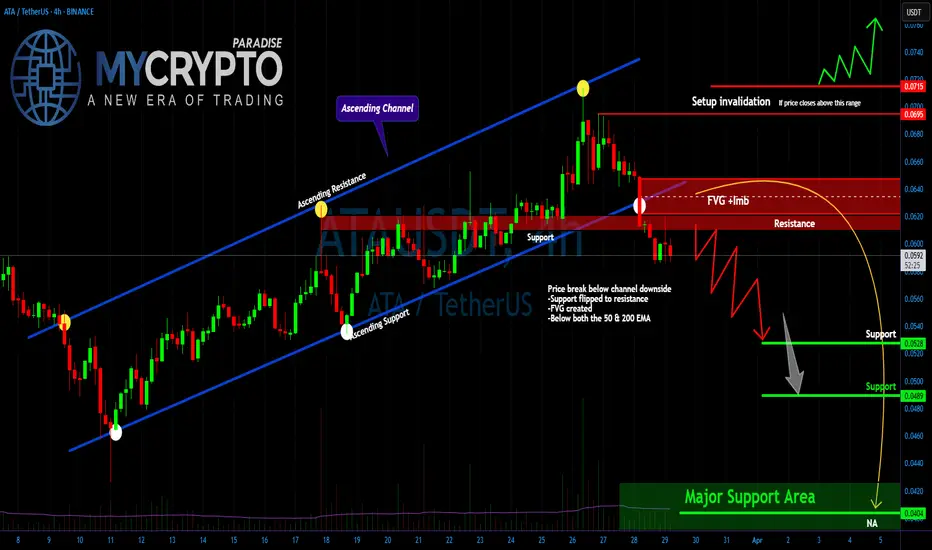
Major Breakdown Confirmed! Is a Bigger Dump Incoming? Yello, Paradisers! Did you catch this critical shift in price action? A major breakdown has occurred, flipping previous support into resistance and confirming a trend reversal from bullish to bearish. This shift has reinforced selling pressure, with price now trading below both the 50 & 200 EMA, signaling a strong bearish trend.
💎The market is currently testing resistance at $0.619. If this level holds, the probability of a significant drop increases. A Fair Value Gap (FVG) has also formed, indicating price inefficiency that may get filled before the next leg downward. If selling pressure remains dominant, a zig-zag decline toward lower support levels is likely. The key downside targets to watch are $0.0528, followed by $0.0489, with a major support zone resting at $0.0402.
💎Recent price action further supports the bearish bias. The last five candles have upper wicks, indicating strong rejection at higher levels. Volume is gradually declining, suggesting short-term consolidation before the next significant move. A bearish engulfing pattern has also emerged, reinforcing the likelihood of further downside.
💎To invalidate the bearish setup, price must close above the $0.0695 - $0.0715 range. A decisive breakout above this level would signal a possible trend reversal. Until that happens, the bias remains bearish, with expectations of continued downward momentum unless resistance is broken convincingly.
Stay patient, stay disciplined, and always wait for the highest probability setups. Those who follow the plan and avoid emotional decisions will be the ones who come out on top. Be a PRO!
MyCryptoParadise
iFeel the success🌴
APEUSDT: Will This Major Resistance Trigger a Sharp Rejection?Yello Paradisers, have you spotted what’s brewing on APEUSDT? We’re sitting at a critical zone—one that could either trigger a steep drop or trap late shorts before a breakout. Here's why this level demands your full attention.
💎APEUSDT is showing strong bearish potential, currently trading inside a rising wedge pattern accompanied by bearish divergence. What's even more crucial is that this price action is unfolding right at a key resistance zone, reinforced by both the 0.618 Fibonacci level and the 200 EMA. This confluence of technical factors significantly increases the probability of a bearish rejection from here.
💎If APEUSDT consolidates around this level and begins forming clear bearish structures—such as an M-pattern, a bearish CHoCH (Change of Character), a Head & Shoulders, or even an Inverse Cup & Handle—the bearish case strengthens further. This would also allow for a tighter risk setup, improving the risk-to-reward ratio for traders who are patient and precise.
💎On the flip side, if the price breaks and closes decisively above the invalidation level, this will invalidate the bearish setup entirely. In that scenario, the smart move would be to wait for a new structure or a clean retest before making any trading decisions.
🎖This is the only way you will make it far in your crypto trading journey. Be a professional—stick to your plan, reduce your risk, and never chase the market. Timing and discipline are what separate consistent traders from the rest. Stay sharp, Paradisers.
MyCryptoParadise
iFeel the success🌴

Warning: BCHUSDT Is Approaching a Dangerous Trap ZoneYello, Paradisers! Are you ready for what could be the next classic fakeout setup? BCHUSDT is heading straight into a high-probability reversal zone, and if you’re not paying attention, this could turn into another painful reminder of how quickly things change in crypto…
💎BCHUSDT is currently showing signs of weakness as it moves toward a major resistance zone. This area is reinforced by a 4H Fair Value Gap (FVG) and the critical 0.618 Fibonacci retracement level — both of which have historically acted as strong reversal points.
💎Adding to the confluence, we’re spotting clear bearish divergence on the chart, which further increases the likelihood of a downward move from this level.
💎If BCHUSDT taps into our resistance zone, we’ll be monitoring for bearish price action confirmation.
💎Ideal patterns to validate the setup include: M-formation, Head & Shoulders, Inverse Cup & Handle.
💎These patterns can help us reduce our stop-loss exposure and improve the overall risk-to-reward ratio — patience will be key here.
💎On the flip side, if price breaks out and closes above our invalidation level, the bearish setup will be completely invalidated. In that scenario, it’s smarter to wait for new, more favorable price action before making any trading decisions.
🎖This is the kind of moment that separates disciplined traders from the emotional ones. Don’t rush in blindly — timing, confirmation, and strategic entries are everything if you want to win consistently in this game.
MyCryptoParadise
iFeel the success🌴

ANKR/USDT Will Bulls Take Control or Are We Heading Lower?
Yello Paradisers! Are we about to see #ANKRUSDT break out, or is another rejection incoming? Let’s break it down this is a crucial moment in the market, and you don’t want to miss it.
💎Right now, the 4-hour chart shows SEED_DONKEYDAN_MARKET_CAP:ANKR sitting above the EMA 50, signaling a short-term bullish push. But don’t get too excited just yet—price is still below the EMA 200, which keeps the overall market bias neutral to bearish. For the bulls to take over, a clean breakout above the EMA 200 resistance is needed. If ANKR fails here, we could see another test of the supply zone between 0.02019 - 0.02271, followed by a potential pullback toward the 0.01504 support level.
💎Now, zooming out to the 1-day chart, the picture gets even more interesting. The price is still trading below both the EMA 50 and EMA 200, confirming that the bigger trend remains bearish. What does this mean? Any bullish moves on the 4-hour chart could just be temporary retracements within a larger downtrend. With this structure, selling pressure is still dominant, and unless we see a major reversal, further downside remains on the table.
💎So, what’s the key takeaway? Short-term bullish opportunities exist, but they’re facing strong resistance from the EMA 200 and supply zone. Meanwhile, the longer-term trend remains bearish, meaning any failure to break higher could increase the risk of a deeper drop possibly toward the 0.01294 support area.
Patience and precision are key in these conditions wait for strong confirmation before making your moves.
MyCryptoParadise
iFeel the success🌴

ADAUSDT Flashing Bearish Signals – Is a Drop Incoming?Yello, Paradisers! Are we about to see a strong rejection on ADAUSDT? Let’s break it down.
💎ADAUSDT has filled the Fair Value Gap (FVG) and formed a double top with bearish divergence. Notably, the right top is slightly above the left, signaling a liquidity grab. Following this, we’ve seen a Change of Character (CHoCH) to the bearish side, increasing the probability of a downside move.
💎If ADAUSDT retraces from this level, it will strengthen a high-probability bearish setup from the 1-hour FVG, where the 0.5 Fibonacci level aligns—offering an attractive risk-to-reward (RR) opportunity for shorts.
💎However, if price breaks and closes above the 0.786 Fibonacci level, our bearish outlook will be invalidated. In that case, it would be best to step back and wait for stronger confirmation before taking action.
🎖 Patience and discipline win the game, Paradisers! Don’t chase—wait for the best setups and protect your capital like a pro.
MyCryptoParadise
iFeel the success🌴

WLDUSDT: Is This the Last Chance Before a Major Breakdown?Yello Paradisers, are you prepared for what could be a textbook bearish opportunity on WLDUSDT? Because based on current price action and key confluences, this chart is screaming caution — and the next move might be much sharper than most expect.
💎WLDUSDT has broke down from a rising wedge pattern — a classic bearish signal that often leads to aggressive downside continuation. Alongside this, we’ve identified a clear internal Change of Character (I-CHoCH), followed by the formation of Fair Value Gaps (FVGs). These developments alone raise the probability of a bearish continuation, but that’s not all. The price structure is now forming a Head & Shoulders pattern — another strong reversal signal — increasing the bearish bias with multiple layers of confirmation.
💎If WLDUSDT pulls back from its current level and fills the FVG, we will be watching closely for a bearish candlestick pattern right around our defined resistance zone. This level also aligns perfectly with the Fibonacci golden pocket, adding even more weight to the area as a high-probability short entry. Should this setup form, the reward-to-risk (RR) potential becomes extremely favorable, providing an optimal entry for those waiting patiently.
💎On the other hand, for those considering entries from the current level — while the bearish probability still exists — the RR is much less attractive, hovering around 1:1 or even below. That’s not ideal, especially when managing risk like a pro. The probability of a pullback into the resistance area is still high, so it’s far better to wait for price to come to you. Only then will you have the proper setup to ensure a well-managed trade.
💎However, if WLDUSDT breaks above the resistance zone and we get a candle close above it, that would invalidate this bearish scenario entirely. In that case, it’s best to step aside and wait for better price action to develop. No need to force trades when the market is giving mixed signals — patience always pays.
🎖This is the only way you will make it far in your crypto trading journey. Be a PRO
MyCryptoParadise
iFeel the success🌴

ALGOUSDT Facing a Major Reversal? Bears Ready to Take Over!Yello, Paradisers! Is ALGOUSDT about to take a sharp dive? The price is currently hovering around a key supply zone, struggling to push higher. With buyers failing to break through, the risk of a strong bearish rejection is increasing, signaling a potential short opportunity.
💎The market structure has shown a clear Change of Character (CHoCH), suggesting a shift from an uptrend to a potential downtrend. Price remains below the 50 EMA, reinforcing the bearish momentum. If sellers step in with force, the downside move could accelerate quickly.
💎Key downside targets are forming around 0.2188 and 0.1663, where the next major support zones lie. If the bearish scenario plays out, these levels could be reached sooner than expected. Any failure to reclaim higher levels will only strengthen the case for further declines.
This is where patience and discipline pay off. Market traps are everywhere, and only those who stay focused and trade smart will come out on top. Be ready for the move, Paradisers!
MyCryptoParadise
iFeel the success🌴

ETCUSDT: Breakdown or Bounce? A Critical Move Is Coming!Yello, Paradisers! Is ETCUSDT about to collapse further, or are the bulls ready to fight back? Let’s break it down!
💎#ETCUSDT remains in a strong downtrend, continuously rejecting the descending resistance and struggling to hold above key levels. Recently, the price tested the imbalance zone at $18.995 but got smacked down, a clear sign that sellers are still in control.
💎Adding further bearish confirmation, the 50 EMA has crossed below the 200 EMA, reinforcing the downside momentum. This classic death cross signals that sellers have the upper hand, increasing the probability of further declines.
💎If ETC retests the $18.995 supply zone and faces rejection again, expect another leg down toward $17.590 and potentially the major support at $16.576. A failure to find strong buying interest at these levels would confirm further downside continuation.
💎However, if ETC manages to break and hold above $18.995, it could signal strength. In this case, price may push toward $21.288, but it must first clear $19.288 with strong volume to invalidate the bearish setup. A confirmed breakout would shift momentum bullish, opening the door for a potential rally toward $22 and beyond.
Stay patient, Paradisers! The market always rewards discipline. If we see confirmation, we take action. If not, we wait. Trade smart, not fast! 🎖
MyCryptoParadise
iFeel the success 🌴

FIL/USDT Breakdown – Is a Major Drop Coming? Yello, Paradisers! FIL/USDT has just broken below the EMA 50, and that’s a big red flag for bulls. This level had been acting as strong dynamic support, and now that it’s lost, the bearish momentum is strengthening. If buyers can’t reclaim it soon, the market could be gearing up for a deeper move to the downside.
💎The price is struggling around the major Supply Zone at $2.90 - $3.00, and the failure to hold above this level combined with the EMA 50 breakdown increases the likelihood of a drop toward the next Support Area at $2.467 - $2.209. With the EMA 50 now acting as resistance, any retest is likely to face heavy selling pressure.
💎The EMA 200 remains a key dynamic resistance, reinforcing the bearish bias. Unless FIL/USDT reclaims the EMA 50 and breaks convincingly above $3.306 with strong volume, the downward trend remains intact.
💎If the decline continues with increasing volume, sellers are firmly in control, making a deeper drop more likely. On the other hand, a weak move lower with low volume could indicate exhaustion, potentially leading to a short-term bounce or consolidation.
This is not the time to chase trades blindly. Patience and discipline always win in the long run, Paradisers. Stick to your levels and execute only high-probability setups. Stay sharp.
MyCryptoParadise
iFeel the success🌴

PIUSDT : Head & Shoulders Signals a Major Drop Incoming!Yello, Paradisers! PIUSDT is flashing strong bearish signals! The price has formed a Head & Shoulders pattern right on the resistance trendline of a descending channel—this combination significantly increases the probability of a sharp move to the downside.
💎PIUSDT breaks below the neckline and closed a candle which validates the bearish setup, increasing the likelihood of further downside.
💎However, We have to wait for the proper retest of the neckline, patience is key for the right entry.
💎On the flip side, if PIUSDT breaks above the resistance zone and closes candle above it, the bearish setup will be invalidated.
Stay disciplined and wait for confirmation, Paradisers. A fakeout could trap impatient traders—don’t be one of them! 🎖
MyCryptoParadise
iFeel the success 🌴

AVAXUSDT Breakdown Alert – Are Lower Lows Coming Next?Yello, Paradisers! Is AVAXUSDT gearing up for a bigger drop? Let’s break it down.
💎AVAXUSDT has turned bearish after breaking below its key support trendline. A Change of Character (CHoCH) confirms the shift to the downside, and right now, the price is rejecting from a critical 4H Fair Value Gap (FVG) and the 200 EMA resistance zone. Adding to the bearish pressure, we also see a 4H bearish divergence, making a downside move highly probable.
💎Moreover, AVAXUSDT is in the process of forming a Head & Shoulders pattern, which increases the risk-to-reward (RR) potential for short trades. On top of that, there’s liquidity resting below, which could act as a magnet, pulling the price further down.
💎However, if the price breaks out and closes a candle above the 200 EMA resistance zone, this bearish outlook will be invalidated. In that case, it’s better to wait for clearer price action before making any moves.
🎖Patience is key, Paradisers. Stick to the strategy, avoid emotional trading, and let the market come to you. The best setups will always present themselves to those who wait!
MyCryptoParadise
iFeel the success🌴

ATOMUSDT Nearing a Breakdown – More Pain Ahead?Yello, Paradisers! Is ATOMUSD gearing up for a deeper decline, or can the bulls pull off a breakout reversal? The latest price action suggests a major move is coming let’s break it down.
💎#ATOMUSDT remains in a strong downtrend, repeatedly rejecting from the key resistance trendline and the 200 EMA. The latest attempt to break above the supply zone $4.445 was firmly rejected, reinforcing bearish control. Sellers continue to dominate, keeping the price below the $4.445 supply zone, making ATOM vulnerable to further downside. Until this level is reclaimed, the trend remains bearish.
💎The next key downside target is the $3.740 support zone, where a temporary relief bounce could occur. However, if selling pressure persists, ATOM could drop further toward the $3.482 major support, a historically strong buying area.
💎For the bulls to regain control, #ATOM must break above $4.445 and push beyond the 200 EMA near $4.80. However, a true trend reversal will only be confirmed if ATOM closes above $5.90, invalidating the bearish setup.
Stay patient, Paradisers! The market rewards discipline. If we see confirmation, we take action. If not, we wait. Trade smart, not fast!
MyCryptoParadise
iFeel the success 🌴

XRPUSDT: A Massive Move Is Coming – But Will It Be Up or Down?Yello, Paradisers! Are we about to see an explosive breakout in XRP, or is a deeper pullback lurking around the corner? Let’s break it down.
💎XRPUSDT has formed a falling wedge alongside a bullish divergence, signaling a potential upside move. Adding to the bullish case, we also see an inverse head & shoulders pattern forming underneath – a combination that significantly increases the probability of a breakout.
💎For a high-probability bullish confirmation, we need a breakout and candle close above the falling wedge.
💎That said, if price retraces deeper, we should be watching the major support zone for a potential bounce. A bullish I-ChoCH on lower timeframes will serve as the key confirmation for a reversal.
💎The invalidation level? If XRPUSDT breaks down and closes candle below the major support zone, this bullish setup will be completely invalidated.
🎖Stay sharp, Paradisers. The next move will decide everything! As always, discipline and patience will separate the winners from the crowd. Be strategic, trade smart, and wait for the highest probability setups.
MyCryptoParadise
iFeel the success 🌴

ZILUSDT at a Breaking Point: Deeper Drop or a Surprise Reversal?Yello! Is ZILUSDT about to sink further, or are the bulls preparing for a comeback? The price action is flashing critical signals, and a major move is brewing traders, stay sharp.
💎#Zilliqa remains under heavy bearish pressure, struggling to reclaim the key $0.01503 resistance level. The price is trading below both the 50 and 200 EMAs, reinforcing the downtrend and showing that sellers are still in control. If GETTEX:ZIL fails to hold above the current trendline, it will likely retest $0.01278, where a rejection could send it lower. Until $0.01503 is reclaimed and sustained, the risk of further downside remains high.
💎The next major support sits at $0.01032, where a temporary bounce could occur. This is a crucial level, as it marks a strong historical support zone. However, if selling pressure persists, ZIL could drop further to $0.00879, a key accumulation area where bulls might step in—or where the bearish trend could deepen even further.
💎For the bulls to regain control, it must reclaim $0.01503 and break past the supply zone. A sustained push beyond this level, backed by strong buying momentum, could hint at the start of a trend reversal. However, a true shift in momentum will only be confirmed if ZIL closes above $0.01503, reclaims the 200 EMA, and invalidates the current bearish setup.
Patience is everything, traders. The biggest profits come from waiting for confirmation, not chasing every small move. Play it smart and stay disciplined only the prepared will win in the long run.
MyCryptoParadise
iFeel the success 🌴

VETUSDT on the Edge – Is a Major Breakdown Coming?Yello! Is VETUSDT on the verge of a bigger drop, or could a reversal be in play? The price action is signaling a critical moment, and traders need to stay sharp. A major move is brewing let’s analyze the setup.
💎#VETUSD remains under strong bearish pressure, repeatedly rejecting from the descending trendline and key supply zone. Price is also trading below the 200 EMA, reinforcing the bearish momentum and signaling that sellers remain in control. Until VET reclaims $0.02695, the risk of further downside remains high.
💎The next major support level to watch is $0.02117, where a temporary bounce could occur. However, if selling pressure continues, VET is likely to push lower toward $0.01906, a historically strong accumulation zone. This level will be crucial either it holds as a buying opportunity, or we see deeper downside continuation.
💎For the bulls to regain control, it must reclaim $0.02695 and break past the supply zone. A sustained push beyond $0.025, combined with strong buying momentum, could indicate the start of a recovery. However, a true trend reversal will only be confirmed if NYSE:VET closes above $0.02695 and reclaims the 200 EMA, invalidating the bearish setup and signaling bullish strength.
Patience is key, Paradisers. The market rewards those who wait for confirmation instead of chasing every move.
MyCryptoParadise
iFeel the success 🌴

AVAX Breakdown Incoming? Key Levels to Watch Now!Yello, Paradisers! Is AVAXUSDT about to take another dive, or are the bulls finally ready to step in? Let’s break it down!
💎#AVAXUSDT remains firmly in a downtrend, struggling to gain bullish momentum while continuously rejecting key supply zones. Recently, the price tapped into the imbalance zone around $21.5, but sellers smacked it right back down a clear sign that bears are still in control.
💎Adding to the bearish case, a descending trendline and moving averages are acting as resistance, keeping price action suppressed. The structure continues to form lower highs and lower lows, reinforcing downside momentum.
💎If Avalanche retests the $22.5 supply zone and faces rejection, another leg down toward $18.956 is likely, with the next major support sitting at $17.523. Right now, if the price closes below the 50 EMA, there’s a strong probability it will directly target our projected support levels. A failure to attract strong buying interest at these levels would confirm further downside continuation.
💎However, if AVAX manages to break through the $22.5 supply zone, our focus shifts to the next major resistance at $24.136. A breakout above this level with strong volume could invalidate the bearish setup, potentially pushing price toward $24 - $25. A confirmed move past $24.136 would shift momentum bullish, opening the door for a rally toward $26 and beyond.
Stay sharp, Paradisers! The market rewards patience and discipline. If we get confirmation, we act. If not, we wait. Trade smart, not fast! 🎖
MyCryptoParadise
iFeel the success 🌴

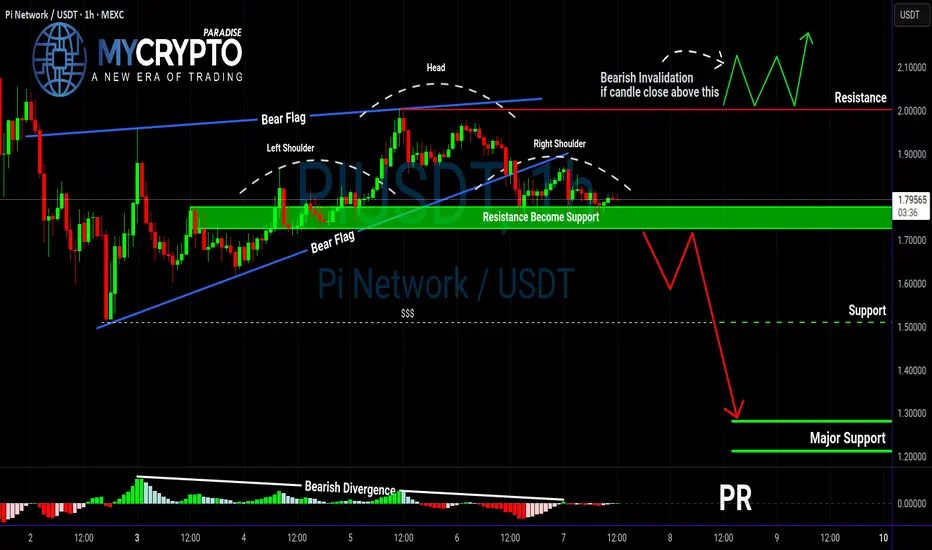
PIUSDT Breakdown Incoming? Bearish Patterns Are Stacking Up! Yello, Paradisers! Is PIUSDT about to break down hard? The charts aren’t looking great, and the confluence of bearish signals is something we can’t ignore.
💎PIUSDT has formed a bear flag on the higher timeframe, a classic continuation pattern that suggests further downside. This alone is already a bearish signal, but there’s more.
💎On the lower timeframe, we can see a head & shoulders pattern forming, along with bearish divergence. These factors together significantly increase the probability of a move to the downside.
💎In the case of PIUSDT breakdown and closes candle below the support zone, this will confirm the bearish setup and likely trigger selling pressure. A breakdown at this level would validate both the bear flag and the head & shoulders pattern.
💎If the price bounces from here, the bearish bias still remains, but there’s also a chance that the market is setting a trap within this range. This makes it a high-risk zone, so it’s better to avoid trading here until a clearer move develops.
💎However, If the price breaks and closes candle above the resistance zone, the bearish outlook will be completely invalidated. In that case, it’s smarter to wait for a more defined price action before making any moves.
🎖Patience is key, Paradisers. The market loves to shake out inexperienced traders before the real move happens. Stay disciplined, focus on high-probability setups, and trade like a pro. Only those who truly understand market cycles will capitalize in the end!
MyCryptoParadise
iFeel the success 🌴
DOTUSDT at a Make-or-Break Level – Big Move Incoming?Yello, Paradisers! Is DOTUSDT on the verge of a breakout, or will the bears crush the momentum? Read on this is a critical moment!
💎#DOTUSDT is showing strong bullish momentum, bouncing off the demand zone above $4.582, signaling that buyers are stepping in and defending key levels. The market structure remains favorable for the bulls, but a crucial test is ahead.
💎The price is trading above both the 50 EMA and the 200 EMA, which is a strong indication that the uptrend is intact. Volume is increasing near demand zones, suggesting that buyers are actively supporting the price. This reinforces the strength of the trend, with green candles showing a strong buying push and minimal wicks, indicating low selling pressure.
💎If POLKADOT successfully breaks and holds above $5.00 with strong volume, the next upside target is $5.30, a major resistance zone. A decisive breakout here could open the door for an even stronger rally. However, if DOT fails to break $5.00 and retraces, the lower demand zone at $4.465 will be a key area to watch for a potential bullish rebound. A close below $4.215 would invalidate the bullish setup and shift momentum in favor of the bears.
Patience is key, Paradisers! If we see a confirmed breakout, we act. If not, we wait. Discipline is what separates traders from gamblers. Stay sharp and trade smart! 🎖
MyCryptoParadise
iFeel the success 🌴

SOLUSDT at Critical Resistance – Will Bears Take Over? Yello, Paradisers! Is SOLUSDT setting up for a major drop? The technicals are flashing warning signs, and you need to pay attention.
💎SOLUSDT has broken down rising wedge, showing a loss of bullish momentum. On top of that, a bearish divergence is appearing, and the price is currently testing key resistance at the 200 EMA—a combination that significantly increases the probability of a bearish move.
💎If SOLUSDT retests the resistance zone and the 200 EMA again, a double top formation could play out. But before jumping in, waiting for bearish confirmation is the smart move.
💎If price breaks above and closes a candle above the resistance, it will invalidate the bearish thesis. In that case, patience is key—waiting for clearer price action will be the best approach.
🎖Trading isn’t about guessing—it’s about waiting for high-probability setups and executing with discipline. Stay sharp, Paradisers, and remember: the market rewards patience, not impulsive moves.
MyCryptoParadise
iFeel the success 🌴

LTCUSDT on the Edge – Major Breakdown or Fakeout?Yello, Paradisers! Is LTCUSDT on the verge of a major drop? The signs are stacking up, and if you’re not watching closely, you could miss a big move.
💎Right now, LTCUSDT is looking bearish as it forms an M-pattern near the resistance trendline of a descending channel. At the same time, a bearish divergence is confirming the weakness in momentum. On top of that, we’re seeing a triple-three wave pattern playing out, which further increases the probability of a downside move. All these signals combined suggest that sellers are gaining control.
💎If LTCUSDT breaks down and closes candle below the support level, the M-pattern will be validated, opening the door for a significant move lower.
💎However, if the price consolidates around this level without breaking down, the setup loses its strength, and in that case, it’s best to ignore it as a low-probability trade.
💎On the flip side, if LTCUSDT manages to break out and close candle above the resistance zone, the entire bearish outlook would be invalidated. In that scenario, waiting for fresh price action before making any moves would be the smartest approach.
🎖 Discipline and patience separate the pros from the amateurs. Stay sharp, Paradisers—trade only high-probability setups, and you’ll always stay ahead of the game!
MyCryptoParadise
iFeel the success🌴

ADAUSDT Breakout Incoming or Another Fakeout?Yello, Paradisers! Are we about to see ADAUSDT explode, or is this just another trap for impatient traders? Let’s break it down!
💎ADAUSDT is looking solid after completing a proper double zig-zag corrective phase. The key to confirming the next move lies in breaking and closing a candle above the resistance level. If this happens, it significantly increases the probability of a bullish breakout. Why? Because ADA is still trading in the discount range of a descending channel, and we’re also seeing bullish divergence—a strong confluence signal for upside momentum.
💎However, if ADA pulls back or retraces further, the smartest play is to wait for inducement. Ideally, we want to see bullish structures form, such as a bullish I-CHoCH or well-known bullish patterns like a W formation or inverse head and shoulders on lower timeframes. If those confirmations appear, the probability of a bullish move shifts in our favor.
💎On the flip side, if ADA falls sharply or closes a candle below the support zone, it would invalidate our bullish scenario. This would likely extend the corrective wave into a deeper structure, signaling that it’s best to stay patient and wait for clearer price action.
🎖 Bottom line? The market is setting up for a major move—either a powerful breakout or a deeper retracement. Only those who wait for the right confirmations will come out on top. Stay disciplined, Paradisers! 🚀
MyCryptoParadise
iFeel the success🌴

HOOKUSDT Breakdown Incoming? Key Signals Point to Bearish Move!Yello, Paradisers! Is HOOKUSDT gearing up for a major drop? The current structure suggests a strong probability for further downside as the price follows a triple three-wave pattern within a descending channel.
💎HOOKUSDT recently faced strong resistance from multiple confluences: 50 EMA rejection, Key resistance zone, Descending channel’s trendline, Formation of an "M" pattern. These factors increase the likelihood of a wave Z move downward. However, for confirmation, we need a clear breakdown of the support level with a candle close below it and high volume.
💎The broader crypto market also leans bearish, but waiting for the actual breakdown will further strengthen our probability of a successful trade.
💎Invalidation? If the price bounces and closes candle above the resistance zone, the bearish outlook gets invalidated. In that case, it’s smarter to stay patient and wait for a stronger setup.
🎖 Discipline and patience are key, Paradisers! The market always rewards those who wait for the highest-probability trades. Stay sharp!
MyCryptoParadise
iFeel the success🌴
