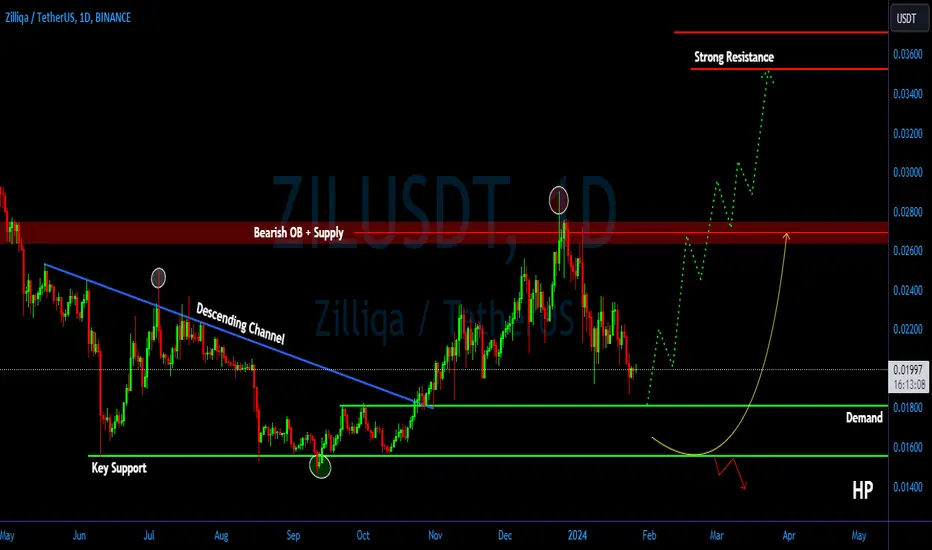
ZIL/USDT Keep an eye on the demand area. Possible Strong Bounce!💎 ZIL has witnessed significant developments in the market.
💎 After experiencing a hard rejection upon hitting the Bearish OB area, ZIL has undergone a 30% drop, with the potential for further decline until reaching the demand area around 0.01815.
💎 A bounce from this demand area could signify a reversal, and if confirmed, ZIL may resume its upward movement, attempting to break out of the Bearish OB area and proceed towards the strong resistance area.
💎 However, if ZIL fails to bounce when reaching the demand area or even breaks down below it, this would be a concerning sign. The price could then continue its downward movement towards the key support area or potentially go even lower.
Cryptotraders
CHZ/USDT Break out the key level resistance. Bullish Momentum??💎 CHZ has undergone significant developments in the market. Currently, CHZ has successfully broken out of a key resistance area, indicating a bullish momentum for its next move.
💎 The chart is now in a retesting phase, initially at the support level, which was previously resistance. After this retest, there's a probability of CHZ continuing its upward movement and reaching our target strong resistance area.
💎 However, if during the retesting phase CHZ fails to bounce from the support and instead moves sideways for an extended period, it raises concerns. This scenario could be a sign of potential support breakdown. If this occurs, the price may switch back to a downward movement, with the target set on the Bullish OB area.
💎 The Bullish OB area serves as the last support for CHZ, coinciding with the support trendline. Bouncing from this area and reclaiming the position above the resistance is crucial for CHZ to resume its upward trajectory. Failure to do so may result in continued downward movement, returning to the bottom support level.

WOO/USDT Bullish reversal from lower demand?👀WOO Today Analysis💎 Attention, Paradisers! #WOOUSDT is ready to soar, as it shows strong momentum from its lower demand zone.
💎 Looking at #WOO recent trends, it dipped slightly below the support level, creating a bearish sentiment. However, the price is still close to the buying liquidity at this crucial point, which could trigger a bullish bounce from the lower demand at $0.2366.
💎 If FWB:WOO maintains this speed after reaching this level, we could see a rise towards the attractive supply zone at $0.5240.
💎 But remember, the trading game is all about being proactive. If our star player loses its bullish force from its lower position, a further decline could happen.

XVS/USDT Indicating downward movement retrace on support!💎 XVS has witnessed significant developments in the market.
💎 Presently, XVS has broken down the support trendline, indicating the potential for a downward movement with a retracement to the support area around 9.5. A prudent strategy involves waiting for XVS to reach this support level.
💎 If it successfully bounces, there's a possibility of a return to upward movement, probability aiming to break and reach our target strong resistance area
💎 However, if XVS reaches the support area and shows weak consolidation with low volume, it raises concerns. A lack of a robust response may signify the risk of XVS losing support. In such a scenario, a bearish trend is confirmed, and the next downward target could be the demand area around 6.3.
💎 To maintain an upward trajectory, XVS must bounce at the demand area and reclaim the position above the resistance area. Failure to do so may result in a continued downward movement, potentially reaching the strong support area.

LDO/USDT Perfect bounce from the support. Ready for Back to Up??💎 LDO has undergone significant developments in the market. Recently, LDO executed a flawless bounce from the support area, previously acting as resistance.
💎 Observing the candle patterns suggests a probability continuation of the upward movement, aiming to revisit our target resistance and possibly achieve a new all-time high (ATH).
💎 However, if LDO retraces back to the support and fails to bounce or, worse, breaks below the crucial support area, it raises bearish concerns. The support zone holds immense significance, and a breach may trigger a reversal to downward movement, with the next target being the demand area.
💎 To sustain upward momentum, LDO must bounce at the demand area and reclaim the position above the support. Failure to do so could lead to a continued downward trajectory and further price decline.

MASK/USDT Could MASK Bounce from the support and back to upward?💎 MASK has recently witnessed notable developments in the market.
💎Currently resting on a crucial support area, MASK exhibits resilience, evident from the historical strength of this support zone. There's a possibility that MASK will experience a bounce from this support, paving the way for an upward movement towards the resistance area.
💎 A successful breakout of the resistance probability could facilitate a smooth continuation towards our target strong resistance area.
💎 However, if MASK fails to maintain support at this level, it could signal a concerning trend reversal. The breach of this critical support may lead to a shift in momentum, with the next potential downward stop being the demand area.
💎 At the demand area, a bounce is essential for reclaiming the area above the support zone, sustaining upward momentum, and reaching our target area. If MASK shows prolonged sideways movement without positive signs, there's a risk of losing demand, potentially resulting in further downward movement.

ARB/USDT Bullish continuation from demand ?🚀ARB Today Analysis💎 Get ready, Paradisers! #ARBUSDT is on the brink of what looks like a profitable leap, showing all the signs of picking up steam from its current demand zone.
💎 Diving into #ARBITRUM latest trends, it took a little dip below the demand level, nudging the market vibe towards the sell side. Yet, with the price brushing against buying liquidity around this key point, a bullish rebound from the deeper demand at $1.3823 seems on the horizon. If LSE:ARB can keep up the pace after hitting this mark, we're potentially looking at a climb towards the juicy supply zone at $2.4078.
💎 But let's not forget, the trading arena is all about staying one step ahead. Should our star player fail to keep the bullish energy alive from its lower stance, a further drop could be in the cards.

FTM/USDT Key Support Bullish reversal?👀🚀Fantom💎 Yello Paradisers, let's zoom in on #FTMUSDT! It's caught in a fascinating moment, right at a pivotal support level, sparking whispers of an upcoming bullish leap.
💎 Taking a closer look at #FANTOM latest moves, we've seen it dipping to fresh lows, painting a somewhat gloomy picture. But don't let that dampen your spirits! There's a silver lining here: the stage is set for a bullish turnaround from the key support mark of $30.78. Holding firm at this ground could launch us into a bullish bounce, challenging any resistance that lies ahead.
💎 We, the quick-witted traders, are always on our toes, ready for whatever comes our way. If #FTM doesn't kick off the rally we're rooting for, we're eyeing a plan B at the support backup of $3.58. Should things slip below that, it might signal a deeper dive into the bear zone.

QNT/USDT Glimmer of Bullish Potential Amidst the Dips?👀🚀Quant💎 Paradisers, let's dive into #QNTUSDT, where an intriguing pattern has emerged right at a key demand zone, hinting at a possible upswing ahead.
💎 Peeking at #QUANT recent journey, we've seen a bit of a downhill trend, marking a series of new lows that suggest a bit of a slump. However, it's key to point out that the mood has been mostly bearish of late.
💎 Here's where it gets interesting: the price has just hit a sweet spot at the crucial demand level of $95.7. If it can keep steady here, we might just see a strong bounce back, potentially shaking up the supply status quo.
💎 Ready for anything, we traders have our eyes on different paths. If #QNT doesn't kick off the expected bullish flip, we might look to regroup at a slightly softer demand level of $89.5. But, a slip below this floor could spell out a deeper dive into bear territory.

MINA/USDT Perfect Bounce On the support. Ready for Continue UP??💎 MINA has recently undergone significant developments in the market. Presently, MINA has executed a flawless bounce from the support area, previously acting as resistance.
💎 Observing the candle, there's a likelihood that MINA will sustain the upward movement and attempt to break out of the pattern. A successful breakout, probability could a continuation of the upward trend, reaching our target Bearish OB area.
💎 However, if MINA fails to bounce from the support and breaks down this crucial area, it could signal a bearish trend. The support zone holds immense significance, and a movement back to the downside is plausible, targeting the key support area, and potentially extending further downward.

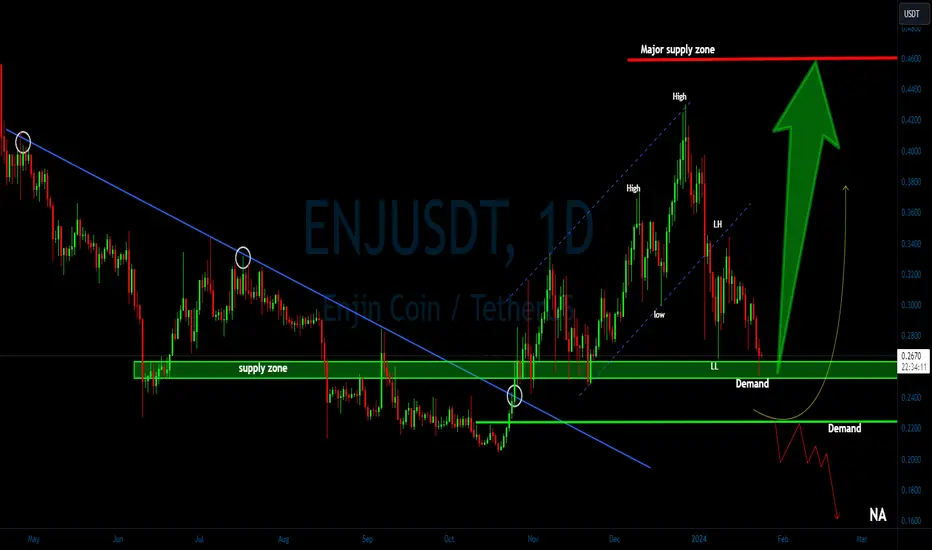
ENJ/USDT Bullish Reversal at Key Demand Level ?👀🚀 ENJ Analysis💎 Paradisers, take note of #ENJUSDT as it showcases a noteworthy pattern, securely positioned at an essential demand level, signaling the possibility of a bullish turn.
💎 In reviewing #ENJIN's recent movements, a pattern of descending to new lows has been observed, indicating a bearish trend. Yet, it's important to highlight that prior to this, ENJ was tracing an ascending channel pattern, from which it has recently deviated.
💎 This break presents an opportunity for a bullish reversal, especially since the price has now tapped into liquidity at the critical support level of $0.2529. Maintaining this level could spark a robust rally to challenge the existing supply.
💎 As experienced traders, we're prepared for various outcomes. If #ENJ does not achieve the anticipated bullish reversal, a push from a lower demand level at $0.2248 could be next in line. Nonetheless, falling beneath this level may indicate a deeper bearish trend is taking hold.
EGLD/USDT Primed for Bullish Turnaround from Key Support? 👀🚀💎 Paradisers, #EGLDUSDT as it unfolds a significant pattern, nestled at a crucial support level, and hinting at a potential bullish upswing.
💎 Observing #Multiversx's recent activity, we've noted a trend of breaking to new lows, suggesting a prevailing bearish sentiment. However, a notable aspect is the potential for a bullish reversal from the critical support of $39.48. Achieving stability at this level could catalyze a strong ascent to counter the overhead supply.
💎 As savvy traders, we're equipped for a range of scenarios. Should #EGLD fail to materialize the expected bullish reversal, we might see a rebound from a secondary demand level at $34.97. A breach below this threshold, however, could signify a significant shift to bearish momentum.

FXS/USDT Break out the Supply or Back to the demand area ??💎 FXS has recently experienced notable shifts in the market. A week ago, FXS faced a robust rejection upon reaching the Bearish OB area.
💎 The current scenario suggests the possibility of FXS resuming an upward climb to retest the supply area. A successful breakout at this juncture could instigate a bullish momentum, propelling FXS upward significantly and the probability aiming to reach our targeted strong resistance area.
💎 Conversely, if FXS fails to break out, not revisiting the Bearish OB, the price may retreat to the demand area, initiating a new momentum.
💎 The demand area holds immense significance, necessitating a bounce to make subsequent attempts at breaking out the supply and Bearish OB areas. A breakdown at the demand zone signals a bearish turn for FXS, leading to potential downward movement and a return to the robust demand area.

PNT/USDT Bounce from the key area. Bullish Momentum ??💎 PNT's recent market dynamics have been noteworthy, particularly with its positioning in the bullish area.
💎 Currently, PNT has executed a perfect bounce after reaching this bullish zone. The upcoming target for PNT may be the resistance area at 0.187. A successful breakout from this resistance, probability could pave the way for a smoother movement towards our target, the bearish OB area.
💎However, should PNT struggle to sustain itself in the bullish OB area, resulting in a breakdown, this could be indicative of a bearish shift. The subsequent movement would likely be downward, with the next significant level being the demand area.
💎 The demand area acts as the final stronghold for the bullish trend in this scenario. PNT must respond positively in this area, initiating a bounce and reclaiming the position above the bullish OB area. Failure to exhibit strength in the demand area could lead to a breakdown, signaling a continued descent.

BAND/USDT bullish ride from support?👀🚀Band Analysis💎Paradisers, take note of the #BANDUSDT chart, which is showing a compelling pattern and anchoring at a pivotal support level.
💎 This indicates a strong chance for a bullish trend. After being rejected from strong supply above #BAND, the price has restored momentum at support $1.328. If the price sustains momentum at this level, there are substantial chances that it will take an upward move to mitigate above the strong supply level of $2.526.
💎 As prudent traders, we should remain prepared for various outcomes. If the price does not follow through on the anticipated scenario, a bullish rebound from a lower support level at $1.334 might be in play. However, dipping below this level could lead to a marked bearish downturn

CRV/USDT Key Support Hints at Bullish Potential?👀🚀CRV💎 Paradisers, observe closely as #CRVUSDT demonstrates a compelling pattern, anchoring at a pivotal support level and signaling a strong chance for a bullish trend.
💎 Historically,#CRV has adhered to a descending channel, consistently exhibiting a pattern of lower lows and lower highs. Currently, it's positioned at a crucial support level of $0.4808. Should the price sustain its momentum at this point, we're poised for a significant bullish surge.
💎 As prudent traders, we remain prepared for various outcomes. Should the price not follow through on the anticipated scenario, a bullish rebound from a lower support level at $0.3940 might be in play. However, dipping below this level could lead to a marked bearish downturn.
