RUNEUSDT: A Major Breakout or a Deeper Correction?Yello, Paradisers! Is RUNE about to explode or will it face a major rejection? Here's what you need to watch closely to avoid any costly mistakes.
💎Currently, RUNE is testing a critical resistance level at $7.7. A confirmed breakout above this zone will signal a bullish continuation, potentially opening the path for a mid-term rally towards our target major resistance area.
💎However, if RUNE faces rejection at $7.7, the price could pull back to the key demand area around $5.6. This level has acted as strong support before, and a successful bounce from here could reignite the bullish momentum.
💎But what happens if RUNE fails to hold at $5.6? Here's where caution is needed. Below the demand zone lies a key support trendline. If a breakdown occurs, this would trigger a bearish signal, increasing the probability of a move towards the next strong support area.
💎Looking back at RUNE's price history, the strong support area has been respected multiple times, making it a significant level to watch. Should RUNE retest this zone, there's potential for a rebound.
💎If RUNE closes a candle below $4.2, this would invalidate the bullish outlook. A breakdown here could lead to deeper losses, so stay cautious if price approaches this zone.
If you want to be consistently profitable, you need to be extremely patient and always wait only for the best, highest probability trading opportunities.
MyCryptoParadise
iFeel the success🌴
Cryptotraders

ICXUSDT:Critical Moment Approaching–Will Bulls Hold the Demand?Yello Paradisers! Have you spotted the massive shift in ICXUSDT? After breaking through a long-term downtrend resistance that had held since April, ICX surged explosively, but the momentum now faces its first real test. Is this the perfect re-accumulation opportunity, or are we gearing up for further downside? Let’s dive into the key areas you need to watch.
💎The descending trendline, acting as a strong resistance for over 8 months, has been decisively breached. Notice the sharp breakout in late November, accompanied by a significant volume spike – a clear sign of bullish interest.
💎 Price is now retracing into the demand zone at $0.2000. Price already respected this demand previously, so if bulls step in here with conviction, expect a strong bounce and continuation of the uptrend.
💎If the demand zone fails to hold, the next area of interest is the broader support zone around $0.1662–$0.1741. A deeper retracement here would still maintain the bullish structure, but failure to hold could trigger a bearish move.
💎Pay close attention to the volume during this pullback. A decline in volume while price drops would signal a healthy correction. Conversely, an increase in bearish volume could indicate growing selling pressure.
💎This is the make-or-break zone for ICXUSDT. Bulls need to hold the demand zone for any chance of continuation. A rejection here could fuel another bullish impulse, rewarding patient traders. On the other hand, failure to hold this level could trigger a deeper retracement, shaking out weak hands.
Stay focused, play it smart, and keep following strategy – because only the strategic traders will capitalize on moves like this. Be a PRO!
MyCryptoParadise
iFeel the success🌴

MKRUSDT: Key Breakout or Major Reversal? Critical Zone in Play!Yello, Paradisers! Is this the moment where #MKRUSDT sets the stage for a powerful rally, or are we staring at the potential for a deeper plunge? The price is at a make-or-break level, and what happens next could shape the market trend for weeks to come.
💎Recently, #MKR faced a significant rejection at $2,143. Now, the price is approaching the $1,700–$1,800 zone, a crucial level that has historically acted as strong support. If bulls can step in and defend this area, keeping the price above $1,800, a sharp bounce could follow. Upside probable targets in this scenario would be around $2,300 and potentially as high as $2,900, confirming a bullish breakout and suggesting that a new leg of the uptrend is underway.
💎On the other hand, failure to hold the $1,700 support zone would signal weakness. A breakdown below this level could trigger a swift decline toward $1,400 and possibly even $1,200. Such a move would indicate a bearish reversal and allow bears to seize control of the market direction.
💎This is a critical juncture for #MKR. A strong bounce here could reignite bullish momentum, while a breakdown could lead to a significant reversal. As always, patience and disciplined risk management are essential. Let the price action confirm its direction before committing to any trades.
Trade smart, Paradisers. Consistency and strategy are the keys to long-term success. Stay focused and keep mastering the art of trading because that’s how winners are made.
MyCryptoParadise
iFeel the success🌴

APTUSDT Is a Bullish Breakout Coming, or Will Support Give Way?Yello, Paradisers! Are you keeping an eye on #APTUSDT? This setup could deliver significant gains or signal a sharp pullback—let’s break it down.
💎#APT recently made a strong rebound from its support zone, suggesting the potential for bullish continuation if it can break above the minor resistance at 15.36. A successful breakout here could trigger a mid-term rally, with the major resistance zone as the next target.
💎However, there are critical levels to watch. If APT fails to break 15.36, the price might pull back to the support area between 11.20 and 10.40. If this zone holds, we could see a rebound and another attempt at the minor resistance.
💎If the 11.20–10.40 support doesn’t hold, the price could dip further into the demand zone at 9.60. A liquidity sweep here might spark a stronger rebound and a renewed upward movement.
💎It’s important to stay cautious. If APT breaks below the strong support at 9.60 and closes a daily candle below it, the bullish case will be invalidated, and further downside may follow.
Be patient, wait for clear confirmations, and manage your risks wisely. Consistency and discipline are the keys to navigating opportunities like this one. Stay focused and trade strategically.
MyCryptoParadise
iFeel the success🌴

Will MKRUSDT Hold or Break? Critical Levels You Must Watch! Yello, Paradisers! Are you watching #MKRUSDT closely? This critical moment could set the stage for a massive move—don’t miss out!
💎#MKR is currently showing respect for its support levels, with potential for bullish continuation if it successfully breaks the minor resistance area near $2,400. A breakout above this resistance could ignite a mid-term bullish rally, with the highest probability of reaching the major resistance zone as our next target.
💎However, the picture isn’t all bullish. If MKR fails to approach or break this minor resistance, there’s a significant chance it will retrace back to the demand zone at $1,887. At this level, price action will be critical: if MKR finds support and rebounds, the bulls might regain control, setting up another attempt to break the minor resistance.
💎But what if MKR fails to rebound at $1,887? In this scenario, we could see the price retesting a lower demand zone between $1,700 and $1,600. A failure here could signal deeper downside potential, putting MKR at risk of falling even further.
💎When analyzing MKR’s price history, the support zones have repeatedly held firm, showing strong buying interest when the price dips into these areas. If history repeats itself, MKR could again find support and bounce. However, a confirmed break and daily candle close below $1,600 would invalidate the bullish outlook and could lead to a deeper correction.
Avoid emotional trades, stay focused on your strategy, and always manage your risks. Consistency, not speculation, is how you win in this market.
MyCryptoParadise
iFeel the success🌴

Will YGGUSDT Break Above Resistance or Face a Pullback? Yello, Paradisers! Is #YGGUSDT setting up for a bullish breakout, or is it gearing up for a deeper correction? Let’s analyze the current market structure to prepare for the next move.
💎YGGUSDT is approaching a crucial resistance level at $0.85, a level that has rejected the price twice in recent weeks. If the price manages to break above this barrier, it’s likely to target the psychological resistance at $0.9423. Beyond that, a continuation toward the $1.00 mark is on the cards if bullish momentum remains strong.
💎However, a rejection at this resistance could lead to a pullback toward the key support level in the $0.6693–$0.6995 zone. This area has proven to be a strong base for buyers and is aligned with the demand zone below. If the price fails to hold here, a deeper correction into the $0.5733 demand zone is possible. A break below this zone could trigger further declines, potentially testing the $0.35 level.
💎At this point, staying disciplined is crucial. If YGG breaks above $0.85, it may offer a solid long opportunity, but only if momentum confirms the move. On the other hand, Paradisers should watch for weakness or bearish candles at resistance, as these could indicate a deeper retracement.
Success in trading comes from patience, Paradisers. Wait for the market to confirm its direction before making a move, and always protect your capital with appropriate risk management. The next major trend will reward those who remain focused and disciplined. Stay sharp, and let’s conquer the charts together!
MyCryptoParadise
iFeel the success🌴

LPTUSDT: Critical Levels to Watch – Will Bulls Defend the Line?Yello, Paradisers! Are you prepared for the critical moves ahead on #LPTUSDT? This setup is heating up, and the next few days could define the trend’s future. Let’s dive in.
💎#LPT is eyeing a retest of the $17.7 - $16.4 support zone. If this area holds, we could see buyers stepping in to fuel a bullish continuation, potentially targeting the major resistance zone. This would align with the broader bullish trend we’ve been tracking.
💎But here’s where it gets tricky. Things could turn ugly if LPT fails to rebound at this support and breaks below it. The price could spiral down toward the $13.7 - $12.5 demand zone. From here, bulls must make a stand and reclaim the lost support to keep the bullish scenario alive.
💎If the daily candle closes below the demand zone, it will confirm a bearish breakdown, with the potential for an even deeper dip.
Stay focused and wait for clear signals before making your move. This is how you ensure long-term profitability.
MyCryptoParadise
iFeel the success🌴

#FETUSDT Analysis: Is a Big Move Brewing? Yello ,#FETUSDT has shown remarkable bullish momentum recently, breaking through key resistance levels and forming a clear upward trajectory. However, after reaching a high near $2.199, the price is retracing, signaling a potential opportunity to reevaluate key levels for the next move.
💎The price is currently approaching the critical support zone around $1.699–$1.744. This area coincides with the 100 EMA on the 4-hour chart, which adds confluence to its significance. If bulls successfully defend this zone, we could see a continuation of the upward move, with potential targets at $2.199and beyond. A breakout above this level would likely accelerate bullish momentum, pushing the price toward the psychological resistance of $2.697.
💎On the downside, the demand zone near $1.522-1.550 is the next key area to monitor if the current support fails. This zone has historically provided strong buying interest, and a bounce from here would offer another chance for bulls to regain control. However, if the price closes a daily candle below $1.550, it would invalidate the bullish structure and open the door for further downside, potentially toward $1.30 or lower.
💎Currently, the market is at a decisive point. Bulls must step in and hold above support to maintain the momentum, while bears are eyeing a deeper retracement to key demand levels.
Paradisers, remember that trading is a game of probabilities, not certainties. Stay disciplined, plan your entries carefully, and always manage your risk. The next move in #FETUSDT could be a game-changer for those who stay prepared and patient!
MyCryptoParadise
iFeel the success🌴

ZKUSDT Ready for a Breakout or About to Fail?Yello, Paradisers! ZKUSDT has formed a classic cup-and-handle pattern, and it looks like it’s about to challenge the key resistance trendline. But is this the moment we’ve been waiting for?
💎If ZKUSDT successfully breaks through both the resistance trendline and the resistance zone, it will validate the cup-and-handle pattern, significantly increasing the odds of a strong bullish move.
💎However, if we see a pullback, we can anticipate a bounce from the support zone—but to truly tip the scales in our favor, we’ll need to see an I-CHoCH (Internal Change of Character) on lower timeframes.
💎On the flip side, if ZKUSDT breaks down and closes candle below the support zone, it will invalidate our entire bullish thesis. In that scenario, it’s wiser to stay patient and wait for clearer price action to form before jumping back in.
🎖As always, discipline and patience are your best tools in these situations. If you're serious about consistent profits, waiting for high-probability setups is key. Trade smart, Paradisers! Stay focused and keep mastering your strategy to be in the winner's circle.
MyCryptoParadise
iFeel the success🌴

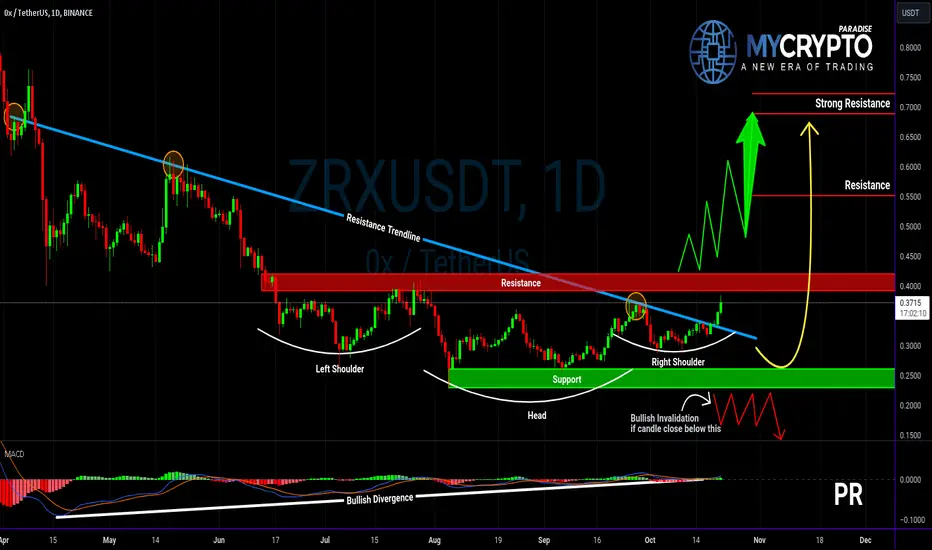
Will ZRXUSDT Ignite a Bullish Reversal? Yello, Paradisers! Have you noticed the key breakout on ZRXUSDT? 🚨 The pair has just broken out of a major resistance trendline and formed an Inverse Head and Shoulders pattern, all while showing a bullish divergence. Are we about to witness a strong reversal, or will this be a fake-out?
💎If ZRXUSDT manages to break and closes candle above the resistance zone, it will confirm the Inverse Head and Shoulders pattern, significantly increasing the probability of a bullish reversal. The bullish divergence adds even more weight to this potential move.
💎In the event of a pullback, a bounce from the support zone is expected. To increase the odds in our favor, we’ll be looking for a bullish I-CHoCH (Internal Change of Character).
💎However, if the price breaks down and closes below the support zone, the entire bullish setup will be invalidated. In that case, the best approach would be to wait for a clearer price action before taking any new positions.
🎖 As always, patience is key, Paradisers! Stick to the strategy, wait for confirmation, and avoid impulsive decisions. Successful trading is all about timing and discipline—don’t rush it!
MyCryptoParadise
iFeel the success🌴
IDUSDT: Bullish Breakout or Panic-Inducing Breakdown?Yello, Paradisers! Are you ready for a major move on IDUSDT? If you’ve been keeping an eye on this one, you might be in for a game-changer!
💎IDUSDT is approaching the resistance trendline, forming a classic Cup & Handle pattern—and we’ve got a bullish divergence in play.
💎If IDUSDT breaks and closes a candle above the resistance zone, it will confirm the Cup & Handle pattern, significantly increasing the odds of a bullish reversal. This could be your signal to ride the wave up!
💎Now, if we get a pullback, don’t panic. We’re eyeing a bounce off the support zone. But for a safer bet and higher probability in our favor, we need to see a bullish I-CHoCH in lower timeframes for confirmation.
💎On the flip side, if the price breaks down and closes candle below the support zone, that’s a red flag. It will invalidate our bullish scenario altogether.
Be patient, wait for the right confirmation, and avoid emotional decisions. Smart trading is about following the strategy and never rushing the market. Stay sharp and disciplined, Paradisers! 💪
MyCryptoParadise
iFeel the success🌴

Is THETAUSDT on the Verge of a strong bullish move?Yello, Paradisers! Are you ready to catch a potential surge in THETAUSDT? We’ve got our eyes on this one, and it’s time you should too!
💎 #THETAUSDT has successfully broken out of a descending channel. Now, we’re expecting a retest of the descending resistance. If the price completes this retest phase, it could pave the way for a bullish move from the demand zone around $1.231.
💎But what if momentum stalls and the price of #thetausd drops below this demand zone? Don’t worry; we’ve planned for that too. In such a case, we’re looking at a potential bullish rebound from the lower support zone at $0.902. This support is crucial due to its historical price action, and if the pattern holds, we anticipate a strong bullish move toward the next significant resistance level.
💎 However, if the price breaks below this support, it would invalidate the bullish setup and could lead to a significant drop.
As always, employ prudent trading strategies and ensure you have proper stop-loss measures in place. Stay vigilant to market movements, and we’ll keep you updated with more insights.
MyCryptoParadise
iFeel the success🌴

Is #CRVUSDT About to Explode? Here’s Why You Can’t Afford to MisYello, Paradisers! Are you prepared for what could be a massive game-changer in the market? Let’s dive into our latest analysis of #CRVUSDT and see what’s brewing!
💎#CRVUSDT is hovering around a critical support zone at $0.2944, showing strong potential for a bullish continuation We’ve been closely monitoring #CURVE as it follows a falling wedge pattern, and after a perfect breakout, it has successfully completed a retest of the descending resistance signals that the bulls might be gearing up for action. The next key level to watch? The internal minor resistance at $0.5249.
💎If #CRV can hold its ground at this level, we could witness a significant bullish rally, echoing previous major market moves. A decisive breakout above the crucial $0.5249 resistance could set the stage for a surge toward even higher resistance zones.
💎But remember, caution is key. If momentum fades at this critical juncture, a pullback to the lower demand area around $0.2431 is on the table. A daily close below this level could invalidate the bullish outlook and lead to further declines.
💎Stay sharp and keep a close eye on the price action. The next move could define the trajectory of #CRVUSDT in the coming days.
Stay focused, patient, and disciplined Paradisers.
MyCryptoParadise
iFeel the success🌴

Fantom (FTM) Poised for a Massive Breakout or a Major Drop? Yello Paradisers! Are you ready for the next big move in Fantom ? It looks like FTMUSDT is preparing for a massive bullish run that could be just around the corner!
💎Right now, Fantom is forming an inverted head and shoulders pattern—a strong bullish signal. It's currently testing the neckline, and a breakout above this level, confirmed by a surge in trading volume, would give us the green light to plan our entry for a buying opportunity.
💎For this bullish scenario to materialize, FTM needs to break above the critical resistance level at $0.5300. A successful move past this resistance could trigger a significant rally, targeting the next resistance zone around $0.7717.
💎However, caution is crucial here! If the upward momentum falters, we might see a retreat to the lower support area near $0.3664. A daily close below this support would invalidate the bullish outlook and could signal further declines.
Stay focused and disciplined, Paradisers! Remember, only the patient and strategic will reap the rewards in this market.
MyCryptoParadise
iFeel the success🌴

BAT About to Break Out or Break Down? Critical Levels You Can't Yello, Paradisers! Could #BAT Be Ready to Explode? Here’s Why You Need to Watch Closely!
💎#BATUSDT is currently sitting at a critical demand zone of $0.1690, and it’s showing signs of a potential bullish continuation. We’ve been tracking #BAT closely as it navigates a descending channel, and it’s now on the brink of a breakout. If the price maintains this upward momentum, a powerful bullish surge could be on the horizon.
💎For this bullish scenario to play out, #BAT needs to break above the internal resistance level at $0.2070. A successful break here could ignite a significant rally, with the initial target set at the minor resistance zone of $0.2715.
💎 However, stay alert! If momentum fades at the demand zone, a rebound could occur from the lower support area around $0.1482. A daily close below this support would invalidate our bullish outlook and potentially lead to further declines.
💎Stay sharp, Paradisers! Keep a close eye on #BAT's price action because the next move could be a true game-changer. Remember, patience and discipline are key to capitalizing on these market opportunities!
Trade smart and stay focused – the best opportunities are often just around the corner!
MyCryptoParadise
iFeel the success🌴

Is #TRXUSDT About to Skyrocket? Don’t Miss This Critical Move!Yello, Paradisers! Is #TRXUSDT About to Explode? Here’s Why You Must Pay Attention!
💎#TRXUSDT is setting up for a potential bullish continuation from the key demand zone at $0.1460. If the price manages to hold within this zone, there’s a high probability of a strong bullish move to test the resistance above.
💎We’ve been tracking #TRON closely, especially after it broke above a previous major resistance. Now, with the price hovering near a descending resistance, the chances of a bullish breakout are increasing. The current trend is clearly upward, and market sentiment is on the bullish side.
💎For this bullish scenario to materialize, #TRXUSDT must break above the descending resistance. A successful break could trigger a significant rally, with the first target aimed at the key resistance zone around $0.1913.
💎However, be cautious! If momentum weakens at the demand zone, we could see a bounce from the lower support area near $0.1392. A daily close below this level would invalidate the bullish outlook, opening the door to further declines.
💎Stay sharp, Paradisers! The next move in #TRX could be a real game-changer. Patience and discipline are key to seizing these opportunities.
Trade smart and stay focused—the best setups are often just around the corner!
MyCryptoParadise
iFeel the success🌴

Is #TWTUSDT About to Explode or Collapse? Brace for a Major MoveYello, Paradisers! Are we on the verge of a massive breakout for #TWTUSDT? It's time to dive into the latest analysis and uncover what’s brewing for Trust Wallet Token.
💎We’ve been keeping a close eye on #TWTUSDT, and the signs suggest an explosive move could be on the horizon from the key support level at $1.0276. The price has followed a descending resistance pattern in the past, and when it broke through, it consistently formed higher highs and higher lows. Now, it's regaining momentum at support, hinting at a potential bullish run.
💎If #TWT holds steady at the $1.0276 support level, a powerful rally up to the $1.3576 resistance zone could be next, echoing previous upward trends. However, caution is warranted; if momentum fails, there’s a risk of a drop to the lower demand zone near $0.9455, where a bullish rebound may occur.
💎This is a critical moment,Paradisers. Stay vigilant and closely monitor price action around the demand area. A daily close below $0.9455 could invalidate the bullish outlook and signal further declines.
Stay patient, stick to your strategy, and avoid emotional decisions. That’s how we make it in the long run!
MyCryptoParadise
iFeel the success🌴

#DOGEUSDT: Massive Bullish Move or Major Reversal Ahead?Yello, Paradisers! Are we on the verge of a massive breakout on #DOGEUSDT, or is a reversal looming?The stakes are high, so let’s dive into the analysis and find out what's next.
💎#DOGEUSDT has recently broken above a key resistance level, marked by big green candles, showing strong bullish momentum. If this momentum holds, we may see a significant rally, especially after a potential retest of this resistance (which could flip to support). This would be our ideal setup, as a confirmed support level offers a prime entry for a bullish position.
💎To lock in a high-probability trade, we're watching for a clean retest and avoiding premature “sniper entries.” Once the retest completes, and if price action picks up again with strong engulfing candles, we’ll enter our trade confidently. Until these signals appear, however, staying cautious and resisting the urge to jump in early will keep us protected.
💎Still, there's always the risk of momentum fading. If #DOGECOIN fails to retest at $0.14887 or shows signs of weakening, sellers could gain control. The key level to monitor is the lower support at $0.12709, a historically strong barrier. A bounce here would keep the bullish outlook intact, but if price breaks below $0.12709, the bullish setup could be invalidated, potentially leading to a sharper decline.
The next move will be pivotal, Paradisers. Whether we see a breakout or a reversal, maintaining a disciplined, strategic approach with robust risk management will give us the edge. Patience and a well-executed plan will separate the winners from the rest.
MyCryptoParadise
iFeel the success🌴

Will #TONUSDT Break Out or Break Down?Yello, Paradisers! Is #TONUSDT preparing for a massive breakout, or are we standing on the edge of another downward spiral? Let’s break it all down in this critical #TON analysis:
💎#TONUSDT has been following the descending channel and is now teetering on the brink of a breakout. The key support at $5.172 has repeatedly held firm against selling pressure, giving bulls a reason to stay optimistic. However, momentum is everything #TON must stay above this level to sustain any hopes of breaking free from the descending pattern.
💎 For a confirmed bullish breakout, $6.062 is the level to watch. This minor resistance is the critical gateway to stronger upward momentum. A clear break above this zone, marked by powerful bullish candles and increased trading volume, would indicate genuine market conviction and pave the way for further upside.
💎 On the flip side, if #TON fails to break through $6.062, the bears may regain control. In this scenario, the spotlight shifts to the crucial $4.412 support level. If this zone holds, it could attract renewed buying interest, setting the stage for a rebound.
💎 However, a decisive break below $4.412 would invalidate any bullish outlook and could trigger deeper bearish action. At that point, we’d need to reassess the situation entirely.
As always, patience pays in trading. Don’t let FOMO guide your decisions wait for clear confirmations before taking action. Discipline and strategy are the keys to long-term success.
MyCryptoParadise
iFeel the success🌴

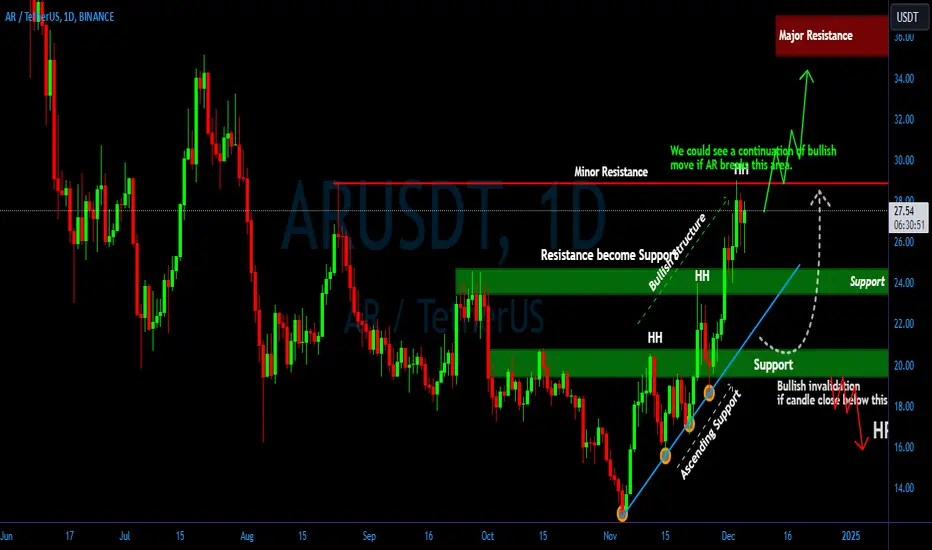
ARUSDT Will the Bulls Take Control or Are We Heading for a Deep?Yello, Paradisers! Is #ARUSDT about to break free and soar, or are we staring at a potential drop to key support zones? Let’s dive in and unpack this critical setup.
💎Currently, #AR is respecting its support level, showing signs of a potential bullish continuation. if it successfully breaks the minor resistance at $28.85. Should this breakout occur, we anticipate a mid-term bullish movement, with the highest probability of the price reaching our target at the major resistance zone.
💎However, if AR fails to break the minor resistance, the price may consolidate in a sideways range between $24.60 and $23.00, as it seeks to decide its next move.
💎If AR breaks down below the support, the price could retrace significantly, potentially testing the **second support area at $20.70 - $19.40. Historically, this support zone has held strong multiple times, offering buyers a solid re-entry point. Should the price revisit this area, we expect a similar reaction.
💎However, bullish invalidation occurs if the price closes below $19.40. In such a case, AR could continue its downward trend, exposing the market to further dips.
Stay alert and remember, disciplined trading is the only way to navigate uncertain markets. Always plan your trades carefully, wait for confirmations, and protect your capital. Let’s stay smart and focused, Paradisers!
MyCryptoParadise
iFeel the success🌴
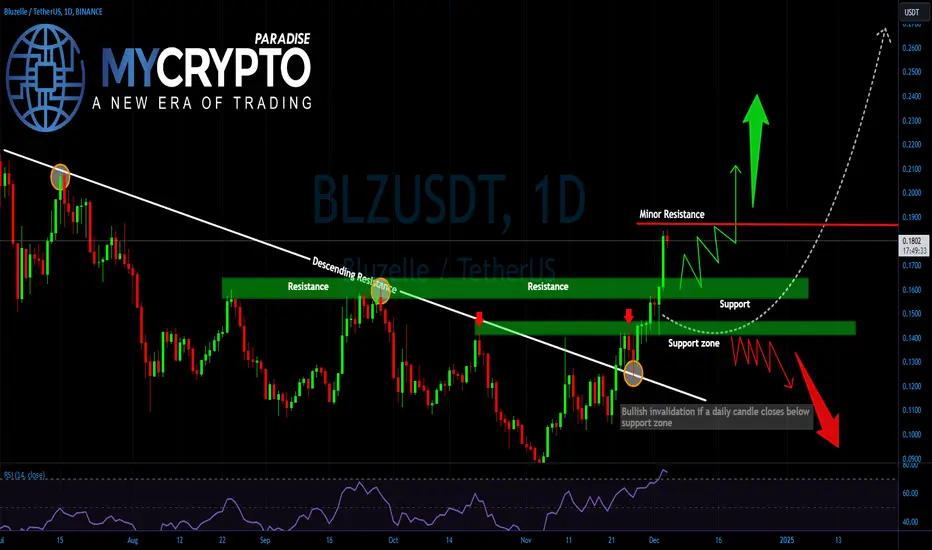
Is BLZ About to Explode? Critical Levels You Can't Miss!Yello, Paradisers! Are you ready to spot the next big move on BLZ/USDT? The price action is at a make or break moment, and understanding these key levels could define your next trading decision. Let’s dive into it.
💎 BLZ/USDT surged past a descending resistance line that had suppressed price action for months, signaling a potential bullish breakout. For now, the price is approaching the current minor resistance around $0.1866, which is capping upward movement. If BLZ manages to break above this zone with conviction, we could see a strong rally targeting the $0.25–$0.27 region, which represents the next significant resistance level.
💎 If the price fails to break above the minor resistance, it could retrace to the $0.1563–$0.1638 support zone, which is now a crucial area to watch. This zone, previously a resistance level, is acting as a foundation for further upside momentum. As long as this level holds, the bulls remain in control.
💎However, if the price falls below the $0.1563–$0.1638 support zone, a deeper correction toward the $0.1412–$0.1461 lower support zone could unfold. Buyers are likely to step in aggressively at these lower levels. A decisive daily close below the lower support would invalidate the bullish structure, potentially leading to a sharp decline and trapping late buyers.
Trade smart, Paradisers, and let the market come to you. It’s all about consistency and strategy. Stay focused and keep mastering the art of trading.
MyCryptoParadise
iFeel the success🌴
Will ROSE Break the 0.85 Support or Continue Its Bullish Move?Hey there, ✌By analyzing the daily chart of BINANCE:ROSEUSDT , we see that the price has had a significant upward movement from the 0.060 level, which led to breaking the supply zone. As shown in the chart, after breaking the supply zone, the price entered a range after reaching 0.090 and has now returned to the breakout level, which has turned from resistance into support.
If the price stabilizes above 0.085, I expect it to move towards the target range of 0.10 (descending orderblock zone) and eventually reach the supply zone between 0.11500 and 0.11800. To understand the next movement, we need to observe how the price reacts at these levels.
💡 Keep in mind, this is just my personal perspective and shouldn't be considered as financial advice. I’d love to hear your thoughts and engage in a discussion!
Happy trading!✌😎
Feel free to reach out if you have any questions or need more clarification. I'm always here to assist!✌
If you want any further adjustments, just let me know!

CHZUSDT: Is a Major Bullish Reversal on the Horizon?Yello Paradisers! Are you ready for what might be a big move in CHZUSDT? It’s starting to show some strong bullish signals, and missing this could be a mistake. 👀
💎CHZUSDT has displayed a Change of Character (CHoCH) along with a Break of Structure (BOS), pointing towards a bullish market structure shift. Additionally, the formation of an Inverse Head and Shoulders pattern is further boosting the probability of a potential bullish move.
💎But here’s the crucial part! If CHZUSDT breaks out and closes a candle above the resistance zone, it will validate the pattern and increase the probability of bullish move.
💎In case of a pullback, we’re looking at the strong demand zone as a potential bounce area. However, we’d prefer to wait for an Internal CHoCH that realigns the market structure into bullish territory before making any moves. This confirmation would enhance the probability in our favor.
💎On the flip side, if CHZUSDT breaks down and closes below the strong demand zone, it would invalidate the entire bullish setup. At that point, it’s wiser to step back and wait for a clearer price action to develop.
🎖Patience and discipline are key here, Paradisers. Wait for the best setups, and don’t rush into trades without solid confirmation. Trade smart, and stay ahead of the crowd!
MyCryptoParadise
iFeel the success🌴
