At ATH, blast continuation or tap and turn?If you find this information inspiring/helpful, please consider a boost and follow! Any questions or comments, please leave a comment!
🚀 Tap & Turn… or Blast?
Bitcoin is reacting well to mapped levels, maintaining structure and respecting key zones. Price action continues to print HLs and HH keeping the bulls confident, atm.
💥 Levels Still Respecting
Recent price action has shown solid reactions at prior resistance and support zones. Nothing overly aggressive, but clean enough to keep structure traders engaged.
🐂 Bulls Still in Control (for Now)
Higher lows remain intact, keeping the bullish structure alive. I did take a lower-degree short, but without a clean break of those HLs, there's no reason to call a shift yet. A break of that pattern would be the first real sign of momentum fading.
🚧 Key Watch Zone: 106K–104K
This is where things get more critical. A clean break below that zone could tilt the balance.
Trade safe, trade smart, trade clarity.
Cryptotrading

BTCUSD Buy CallBuy BTC on current price it can retest it all time high,
Risk reward is also mentioned act accordingly.

ETHUSD: Consolidation before the Megaphone targets 4,100Ethereum is on a strong bullish 1D technical outlook (RSI = 63.675, MACD = 190.470, ADX = 31.885) despite the current technical pullback which is happening due to the rejection on the 1D MA200. Once crossed, we expect a test of the Megaphone's top (TP = 4,100).
## If you like our free content follow our profile to get more daily ideas. ##
## Comments and likes are greatly appreciated. ##

BTCUSD: Going for the decisive breakout that opens path to 155,0Bitcoin is almost overbought on its 1D technical outlook (RSI = 69.391, MACD = 3884.400, ADX = 20.801), which during rallies is the starting condition that fuels bullish breakouts and continuations. Such a breakout is about to take place right now as the price is on the LH trendline coming from the ATH. As this chart shows, once Bitcoin breaks over a LH trendline on this Cycle, it has always delivered (much) more upside. Assuming we are currently on the 0.5 Fibonacci level of that breakout, the pattern gives a TP = 155,000.
## If you like our free content follow our profile to get more daily ideas. ##
## Comments and likes are greatly appreciated. ##

Bitcoin - All time highs will come next!Bitcoin - CRYPTO:BTCUSD - prepares a significant move:
(click chart above to see the in depth analysis👆🏻)
Over the past couple of months, we basically only saw sideways price action on Bitcoin. However, this does not mean, that Bitcoin is now slowing down; actually the opposite is true and Bitcoin is setting up for a major move higher. New all time highs will come very soon.
Levels to watch: $100.000
Keep your long term vision!
Philip (BasicTrading)

LTC will this Demand Zone Trigger a Reversal or a Full Crash?Yello,Paradisers! Is this the calm before a major bounce, or the final warning before Litecoin breaks down completely? This current zone is absolutely critical ignore it, and you risk missing the next big move.
💎#LTCUSDT has completed a strong 5-wave impulsive move within an ascending channel. The recent correction has now brought the price back down into a very important demand zone near $90. This level isn’t just a random number it’s sitting right on top of a previous major support zone that held back in early April, just before the entire leg up began.
💎Price is now also testing the lower boundary of the ascending channel. As long as #Litecoin holds this demand zone between $90 and $93, the bullish structure remains intact. This could be the perfect reload zone for bigger players preparing for the next leg up. If the price begins to form higher lows from here and reclaims the $96–98 region with strength, it could open the path toward the moderate resistance at $110. And if that level breaks with momentum, we’re likely looking at a full extension into the major resistance above $115.
💎However, if #LTC closes a candle below major support at $80 with volume and structure confirming the breakdown, the setup will be invalidated. In that case, we’re potentially heading for a much deeper flush into the $72–75 range, which aligns with the next HTF liquidity pool and potential weekly support.
Stay sharp, Paradisers. The market will soon decide and if you're ready, you'll be on the right side of the move.
MyCryptoParadise
iFeel the success🌴

TOTAL3 Update: Potential Recovery on the Daily ChartLooking at TOTAL3 on the daily:
Yesterday, we saw a wick below the 200MA, but the price managed to close above it by the end of the day—a good sign for recovery. 🔄
Although the MLR < SMA < BB Center isn't ideal, we continue to monitor price action in relation to the 200MA. If we close above it again today, things might start to turn positive. 🌱
⚠️ Keep an eye on macro news and hope for no more downgrades from agencies like Moody’s.
Thanks for reading! Stay safe and manage your risk. 📊

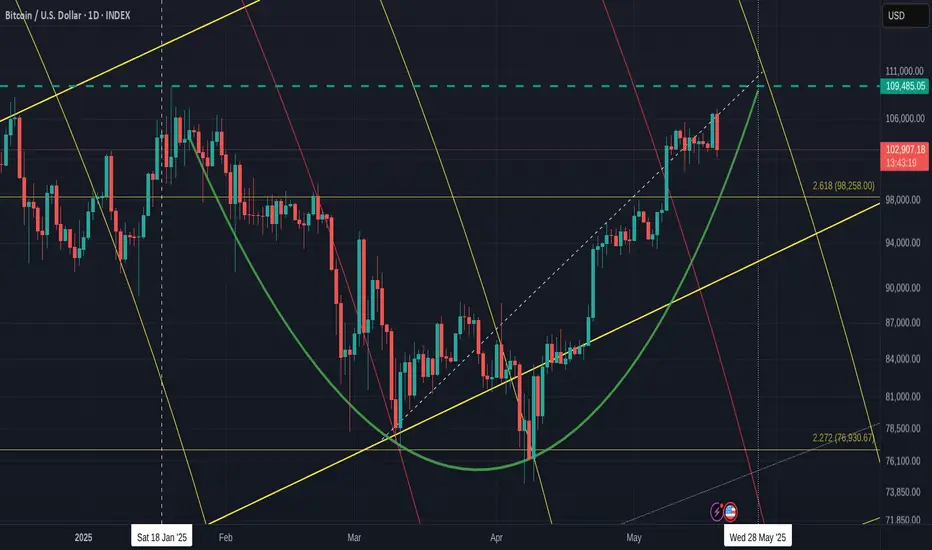
BITCOIN Daily Bullish / Bearish days ahaed with Big push after
Even though I have mentioned that we maybe in for some RED days this week, this chart shows how, ultimately, we are in a Bullish momentum still.
The CUP pattern that we have printed ( adjusted since I last posted this) , Goes from ATH line back to the ATH line.
We also see how there is this APEX that PA has fallen into that has its peak at the end of this month.
PA always reacts before the APEX
But before this, we may range across or drop down onto the CUP. This has Strong support and could possibly propel PA above thaT ATH line.
We do need to also understand, there is a 618 Fib circle at this intersection and that may not be easy to break through.
But PA has often searched out intersections of resistance to break through and so I am looking to this as the way forward.
The 2.618 Fib Ext on this chart may also offer support at around 98K if we loose support higher.
The RSI is already dropping from OverBought and so will probably continue to do so till we reach Neutral / Over Sold again.
And the Daily MACD, is also turning Bearish, But as mentioned before, this is possibly repeating what happened in Nv 2024
See the Arrow on the left...The Histogram is the one to take note of. Two Green peaks and then a red Dip
We have just begun the Red bit after the two Green peaks.
The scale is larger here and so we may have to wait longer till we return out of the green.
In 10 dayts, we will be near end of month
So, for me, this week will be possibly Red but towards the end of the month, things will begin to move higher.
All depends on PA following expected patterns and that does not always happen
We can only look, plan and react.
BTCUSD: is far away from its Sell Zone.Bitcoin remains overbought on its 1D technical outlook (RSI = 70.017, MACD = 4154.600, ADX = 16.535) but still in the middle of the Cycle's Channel Up. After a 1W MA50 rebound (April 7th) on the bottom quarter, it is aiming for the blue Sell Zone of the top quarter of the Channel Up where the last two tops were priced. A +93.64% rise has been the most common inside this pattern. Based on that the minimum TP for this run is 140,000.
## If you like our free content follow our profile to get more daily ideas. ##
## Comments and likes are greatly appreciated. ##

NEOUSD: Minimum target for the end of this Cycle $30.Neo turned marginally bullish on its 1D technical outlook (RSI = 56.743, MACD = 0.356, ADX = 25.407) as it has validated the start of the new bullish wave, rebounding on the same level as it did on March 9th 2020. This is the least aggressive Bull Cycle for new but the presence of a HH trendline implies that a Cycle high can be minimum made on it. With the 1W MACD about to form a Bullish Cross, we expect the HH to get hit by the end of the year (TP = 30.000).
## If you like our free content follow our profile to get more daily ideas. ##
## Comments and likes are greatly appreciated. ##

Will #JASMY Retest Trigger a Rebound or a Breakdown? Key LevelsYello Paradisers! Have you prepared yourself for what’s about to unfold with #JASMYUSDT? The #JasmyCoin setup is showing signs of a major move:
💎#JASMYUSD has just completed an impulsive move from the Major Demand Zone around 0.01509 and is currently retesting the ascending support after breaking down from the short-term channel. This is the critical moment where disciplined traders prepare their next move, not after the bounce, but before it.
💎What we’re seeing now is a textbook retest of the ascending support, after an aggressive move from the major demand zone. The price is currently hovering just above the 0.01742 support level, a critical area that aligns with the high-volume node from the visible range volume Profile (VRVP), making this a high-probability reaction zone.
💎If the #JASMY price holds here, and we start seeing buyer strength reclaim the broken ascending channel, this could trigger a sharp bounce targeting the mid-term resistance at 0.02221. Above that, the next magnet will be the major resistance sitting around 0.02512, a level likely to attract profit-taking or even large-scale short entries from smart money.
💎However, failure to hold this support and a confirmed breakdown below the 0.01509 zone would invalidate the bullish structure entirely. In that case, we would be looking for a possible bearish continuation, driving the price toward 0.01400 and possibly lower, where more liquidity pockets remain untapped. That move would also trap late long entries and clean out weak hands — the exact kind of shakeout we warn about.
Play it safe, respect the structure, and let the market come to you!
MyCryptoParadise
iFeel the success🌴

BTCUSDT 4H | Rebound, Consolidation, Down or Up?Hello Everyone,
Greetings,
BTCUSDT 4H |
As we can see together, BTCUSDT is experiencing a rebound in the WEEKLY trendline resistance area & WEEKLY FVG.
If we observe further, we can also see the 200 Moving Average (MA) at the $84,000 area, and there’s also a Triple Bottom marked with a red circle.
So it can be assumed that the BTCUSDT market is likely to consolidate further while waiting for a strong Volume/Candle to either GO UP (target $99,000) or GO DOWN (target $73,800).
Remember, trading involves high risk, so please do your own research.

BTCUSD: This is a one way trip to $150k.Bitcoin is rising towards the overbought barrier on its 1D technical outlook (RSI = 68.126, MACD = 4169.000, ADX = 23.891) and that has rearely been a problem in the past as the market tends to thrive on overbought conditions. The minimum rally it delivered after a 1W MA50 rebound (like the one it is on now) has been +100%. TP = 150,000 by the end of summer.
## If you like our free content follow our profile to get more daily ideas. ##
## Comments and likes are greatly appreciated. ##

ETHBTC: Ethereum to gain massively against Bitcoin.Ethereum is overbought on its 1D technical outlook (RSI = 72.854, MACD = 228.230, ADX = 38.542) due to the rebound it initiated last week. Even though it is still on its very early stages, this rebound and statement of its strength is better viewed on the ETHBTC pair against Bitcoin. As you can see, ETHBTC bottomed on a level that it hasn't seen since January 6th 2020. The massive downtrend since 2023 is comparable to the one that started in 2018. Similar bottoms, similar 1W RSI sequences. We expect this rebound to be the main driver all the way to the 7 year Resistance level (R1). Traders of this pair can target 0.0800 on the long term.
## If you like our free content follow our profile to get more daily ideas. ##
## Comments and likes are greatly appreciated. ##

XRP – Long Swing Trade Setup Near Key SupportXRP is pulling back toward a major support zone around $2.25, a level that previously acted as a breakout region. With the market showing signs of rotating into strength across large caps, this could offer a solid risk-reward entry for a medium- to long-term swing trade.
🔹 Entry Zone:
$2.25 support zone
🎯 Take Profit Targets:
🥇 $2.60 – $2.75 (prior supply zone & range mid-point)
🥈 $3.15 – $3.40 (macro resistance / high timeframe target)
🛑 Stop Loss:
Just below $2.15 (invalidates the reclaim thesis & opens risk to deeper correction)

SUI/USDT: Key Support Test Within Ascending ChannelThe SUI/USDT market recently retested the $4.00 resistance after an extended period of ranging and has since slipped toward the lower boundary of its ascending channel. The price is now approaching the $3.50 support zone, a critical area that may spark a bullish rebound and continuation of the current structure.
The trend remains defined by higher lows, with price action contained within the upward-sloping channel. A strong reaction near the blue trendline support could pave the way for a move toward the $4.50 resistance

DEEP 2H AnalysisHey traders! 👋
I’m watching a potential Wave 3 impulsive move forming on DEEP/USDT that could present a strong bullish opportunity. Let’s break it down 👇
🔹 Structure Overview:
We’ve completed a five-wave impulse upward (Wave 1 ✅), followed by an irregular corrective Wave 2 (ABC correction). This setup opens the door for a classic Elliott Wave 3, which tends to be the strongest leg in the sequence.
🟩 Entry Zone: 0.195 – 0.205
🎯 TP: 0.256
🛑 SL: 0.182
⚖️ Risk/Reward Ratio: 1:3
📌 Remember:
Take care of your risk and money management. Always size your positions according to your plan.
💬 What do you think? Does this count look solid to you, or are you seeing a different wave scenario? Drop your thoughts below ⬇️

Thu 15th May 2025 BTC/USD Daily Forex Chart Sell SetupGood morning fellow traders. On my Daily Forex charts using the High Probability & Divergence trading methods from my books, I have identified a new trade setup this morning, and this is a BTC/USD Sell trade. As usual, you can see the details of the trade/s on the chart. Keep in mind that I am generally looking to buy when the MACD is below the zero level & sell when it is above the zero level. The red/blue QMP Filter dots on the price chart produce the actual trade signal. I am also considering things like divergence, support/resistance, round numbers etc, and these will be marked up on the chart. Enjoy the day all. Cheers. Jim

SHIB to pop 400% very soon.SHIB appears poised for a potential breakout, mirroring XRP's historical price action. After consolidating for approximately 1,000 days, SHIB has reached a key Fibonacci time extension (1.618), a significant technical milestone often associated with trend reversals. The chart structure shows similarities to XRP before its major rally to previous highs, suggesting a possible repeat scenario.
On the daily timeframe, SHIB is forming an inverse head-and-shoulders pattern, a bullish reversal setup indicating potential upward momentum.
As a "forgotten" meme coin, SHIB could see renewed interest, especially with positive ecosystem developments like Shibarium upgrades, token burns, and new token launches (TREAT and SHI), which may act as fundamental triggers. The diminishing exchange supply and broader market sentiment (e.g., a Bitcoin super-cycle) could further support a rally, similar to XRP’s unexpected surge on positive news.

CHILLGUY/USDT — Bearish Reaction from Supply Zone Ahead?The price is currently reacting from a well-defined supply zone around 0.1150–0.1203 after forming multiple rejections near the highs. This area aligns with prior resistance, which could now serve as a pivot point for a short opportunity.
Key Technical Highlights:
Price made a strong move up but failed to break and hold above 0.1203.
A minor range has formed, signaling distribution characteristics.
The recent wick into supply followed by a bearish rejection indicates possible exhaustion.
Trade Setup:
Entry Zone: 0.115 (within supply)
Stoploss: Above 0.1205
Targets:
• TP1: 0.107
• TP2: 0.0995
• TP3: 0.0880
Watch for bearish confirmation before entering, as price is still testing the upper boundary of the range.

SOLUSD: Can it hit $1000?Solana is heavily bullish on its 1D technical outlook (RSI = 67.130, MACD = 11.423, ADX = 35.600) and just last week only crossed over its 1W MA50 again. This rebound started exactly on the 1W MA200, after holding the HL trendline of the Bull Cycle. Last time SOL crossed above its 1W MA50 after a HL, was on September 25th 2023 and a +1,122% rally unfolded. If macro and fundamentals assist, SOL can repeat this and reach the 1k mark (TP = 1,000).
## If you like our free content follow our profile to get more daily ideas. ##
## Comments and likes are greatly appreciated. ##

BTCUSD: The 1W MACD Bullish Cross eyes $160k.Bitcoin is on excellent bullish levels on its 1D technical outlook (RSI = 67.904, MACD = 4228.900, ADX = 24.411) and even better on 1W where the MACD just formed a Bullish Cross. All such formations since October 2022 led to at least a + 72.93% rally from the moment of the formation. This suggests that Bitcoin's next high on this Channel Up pattern can be around $160,000.
## If you like our free content follow our profile to get more daily ideas. ##
## Comments and likes are greatly appreciated. ##

BTCUSD 1H Short Setup | Order Block + Premium Rejection⚠️ BTCUSD | 1H Rejection at Supply Zone | May 10, 2025
Bitcoin is showing signs of exhaustion after a sharp rally into a high-value Supply Zone marked by a bearish Order Block at ~$104.1k–$106.4k. Price tapped right into premium levels, triggering potential Smart Money distribution.
🔍 KEY CONFLUENCES:
🧱 1H Bearish Order Block at 104,139–106,477
⚖️ Price in premium zone (>50% range)
🧠 Clean liquidity grab from prior swing high
🚫 Signs of buying weakness inside OB
📉 Anticipated move down toward imbalance and demand zone near $96k
📊 Setup Specs:
Pair: BTCUSD
Timeframe: 1H
Entry Zone: 104,139 – 106,477
SL: 106,477
TP: 95,789
RR: Approx. 1:4+
📌 Smart Money Breakdown:
After explosive rallies, institutions often offload in supply-rich OB zones while retail buys the top. This setup shows textbook SMC signs of distribution, imbalance below, and a clean trade idea toward unmitigated demand.
🧠 Chart Ninjas Tip:
“Never short early — wait for price to enter the OB and show weakness. That’s where smart entries live.”
