One Last Drop Before Take Off?Price is still in a pullback phase, and the next potential target zone is around 0.07488 – 0.07334.
We might see one last dip before BINANCE:STPTUSDT resumes its uptrend.
If the price reaches this pullback zone with a bullish divergence, that would be a strong confirmation for a possible reversal.
But even without divergence, we can still rely on candlestick patterns to signal a potential reversal at that level.
What do you think — will BINANCE:STPTUSDT bounce from this zone or break lower?
Cryptotrading

Is the CGPT Retest a Setup-Are You Ready for It?Yello, Paradisers! Have you been watching CGPT closely? Because what we’re seeing now could be a textbook setup to liquidate early longs before a brutal downward move. This is the exact type of trap that punishes undisciplined traders and rewards those who wait.
💎After weeks of bullish momentum with clean higher highs and higher lows, #CGPTUSDT has now printed a clear change of character (CHoCH). The previous low was taken out, and now price has pulled back right into a high-probability resistance zone. This zone, between $0.115 and $0.118, aligns perfectly with a broken ascending trendline adding confluence that strengthens our bearish bias. Traders who aren't careful might interpret this retest as a sign of strength, but this could just be the market setting up its next liquidation wave.
💎Adding even more weight to this bearish thesis is the fact that #CGPT is currently trading below its 50 EMA on the 4H timeframe, showing clear weakness and confirming that the short-term momentum has already shifted in favor of sellers. This acts as dynamic resistance and makes it even harder for price to reclaim bullish control without a significant effort from buyers.
💎The structure is showing all signs of a classic trap. Price action is hesitant at resistance, and with momentum waning, a rejection from this level could spark a swift move down toward $0.09188, our first support zone. But that may not be the end of it. If selling accelerates, we are eyeing the $0.07133 area as a potential major demand zoneour strong support and where true smart money will likely accumulate. However, we must always remain tactical. If CGPTUSDT flips above $0.12526, this bearish scenario is invalidated and we would reassess for possible bullish continuation.
Discipline, patience, robust strategies, and trading tactics are the only ways you can make it long-term in this market.
MyCryptoParadise
iFeel the success🌴

ORDIUSDT — channel, high risks, high rewards.ORDI is the first BRC-20 token based on the Ordinals protocol on Bitcoin. Since its launch in March 2023, the token quickly gained popularity and a significant market cap, being integrated into the Bitcoin blockchain. This integration is made possible through the Ordinals protocol developed by Casey Rodarmor. The protocol allows inscriptions - text, images, audio, or video - to be made directly on satoshis, the smallest unit of Bitcoin, giving Bitcoin new functionality that was not originally envisioned. You can now create NFTs and other digital assets and trade them directly on the blockchain.
____________
The token was listed at a fortunate time - late 2023 - amid overall market growth and positive sentiment. At the time, everything looked promising, but now the price has dropped by 94% from the zones where “hype was being sold.”
🔻 Structure:
The token is moving within a large descending channel. Recently, the price tested the outer support of this channel.
A local downtrend channel was also broken - its retest and a rise within the main trend are possible.
📊 Scenarios:
Retest and upward movement as part of a correction.
Consolidation in the current zone with a possible breakout to the upside.
Further decline amid overall negative market sentiment.
💥 Risks:
The token is traded on all major exchanges, including Binance. However, if it gets delisted (which has been happening more often recently), this is the main risk: loss of liquidity!
🎯 Approach:
With such tokens, it’s crucial to distribute volume wisely and accept risk in advance. I mark out interesting zones and place limit orders accordingly.
Considering the overall market and news backdrop, the token does have bounce potential, especially now that faith in the project is nearly lost.
💭 Opinion:
From my years of experience, I’ll say it again: the goal isn’t to guess where the price will go - it’s to be ready for it. Not everyone will understand that, but then again, not everyone consistently makes money in this market.
_________
📌 Not financial advice. This material reflects personal observations and a risk management approach.

MEMEFI/USDT Bearish Rejection at Supply Zone Incoming? Down!!Price is currently approaching a key supply zone after a sharp drop, with signs of weakness on the lower timeframe. The recent bullish push appears corrective, forming a potential lower high structure.
Looking for price to tap into the highlighted supply area and show rejection — this could confirm a short opportunity.
Entry: 0.00447
Stoploss: 0.00466
Target:
• TP1: 0.00428
• TP2: 0.00412
• TP3: 0.00398
• Final TP: 0.00370
This setup aligns with a bearish continuation bias unless price breaks cleanly above the zone.

"BTC Just Slammed Into a Major OB! Will Bears Strike Back Hard?"⚡ BTCUSD Analysis - 4H Timeframe | April 28, 2025
📈 What's Happening:
BTC has pushed deep into the Premium Area and wicked into a key Order Block (OB).
Strong bearish reactions are starting to show = potential trap for late buyers! 🚨
🚨 Critical Levels Highlighted:
Strong High = Main invalidation level (~99,999).
Order Block (OB) = Primary supply zone where Smart Money could step in.
Weak Low = Major liquidity target (~74,458).
🧠 Key Observations:
Smart Money hunted liquidity by forcing price into Premium.
OB Reaction shows potential rejection = perfect sniper hunting zone!
If bears step in, that Weak Low will be the magnet 🧲.
🎯 2-SCENARIO PLAN:
Plan A — Short Setup (Main Bias):
✅ Watch for strong bearish reaction inside the OB.
✅ Confirm short entries with bearish structure shift on M15/M5.
✅ TP1 = Minor lows around 88,000–90,000. TP2 = Full Weak Low sweep (~74,458).
✅ SL = Above Strong High (~99,999).
Plan B — Breaker Play (Alternative):
✅ If BTC breaks Strong High cleanly, flip bias to bullish.
✅ Look for Breaker retest setups targeting new highs.
📊 Risk Management Tip:
"Patience at Premium Zones = Maximum Risk-to-Reward setups. No chasing allowed."
🧘♂️ Summary:
✅ Liquidity Swept
✅ OB Reaction Starting
✅ Premium Area Reached
✅ Weak Low Target In Sight
🔥 Smart Money has a saying: "Trap first, profit second."
➡️ Save this setup to your playbook!
➡️ Comment "TRAP THEN ATTACK" if you're locking in for that premium sniper shot! 🧨

XLMUSD: Aggressive surge expected to at least 0.5500Stellar (XLMUSD) just turned bullish on its 1D technical outlook (RSI = 55.377, MACD = 0.005, ADX = 37.056), extending the rebound on its 1W MA50. The long term pattern is a Triangle so for the medium term the upside is limited to 0.55000. Since however the structure from mid 2024 resembles late 2016 onwards (price rising then pulling back to the 0.5 Fib), we expect a rise to the 1.618 Fib (TP = 2.5000) if the price crosses above the LH trendline.
## If you like our free content follow our profile to get more daily ideas. ##
## Comments and likes are greatly appreciated. ##

Sell in May and go away, but when? 🧭 Current Situation:
📈 Market remains bullish, but I anticipate possibility for S&P500 to drop on US open. If that happens, BTC can also make a dip, but since it looks much stronger than stocks, that drop might not be a big one. Nevertheless area around 95k looks very attractive.
⚠️ Price will need to show stronger bearish pressure to trigger any real panic or sell-off. Until then, this looks more like healthy volatility within trend continuation.
🧱 The breakout level at 95770 was already re-tested, so it’s now off my watchlist. The next meaningful support is around 95K flat.
---
🔥 CME Gap Update:
4H CME gap has expanded — now stretching from 95280 to 96560
This zone will act as a magnet in the coming sessions until it gets filled.
Just a quick reminder — 4H CME gaps are not as strong or reliable as Daily gaps. They don’t carry the same close rate or magnetism.
However, they can still offer directional hints and serve as target zones, especially in short- to mid-term setups. Use them as guidance — but don’t treat them like guaranteed gravity wells.
🎯 Key Levels to Watch
• Bullish Targets: 97666 / 98500 / 99431
• Bearish Targets: 94971 / 94125 / 93550
---
🔥 BTC Liquidation Heatmap
Above: 97530 / 98191 / 98998 / 100100
Below: 96063 / 95623 / 94670 / 93715

BTCUSD: The catching up to Gold has started.Bitcoin is having an excellent day turning almost overbought on its 1D technical outlook (RSI = 69.867, MACD = 3107.700, ADX = 41.327) and that is normally a signal for more upside to come. Adding Gold to the mix, we see that in recent past when Gold topped, Bitcoin was at the start of its uptrend and eventually caught up to Gold. Today's rise is probably similar to early November 2024, so we expect another 1.5 - 2 month upside before the next short term pullback.
## If you like our free content follow our profile to get more daily ideas. ##
## Comments and likes are greatly appreciated. ##

#Near Ready For a Major Breakdown? Let's Breakdown Key Levels Yello Paradisers! Is #NEAR about to trap thousands of traders chasing this last move up, only to reverse and flush hard? Let’s take a closer look at the #NearProtocol setup:
💎#NEARUSD is trading at $2.585, slowly grinding higher within a clearly defined Ending Diagonal structure. This textbook formation often tricks even experienced traders into entering too early. The current wave count suggests we’re in the final leg, Wave 5 is still in play, but it’s unfolding suspiciously close to a heavy resistance zone, one that previously acted as strong resistance and rejected it.
💎This zone, sitting around the $2.80–$2.90 area, is the key pivot for this entire setup. The bearish structure would be invalidated if #NEAR manages to break and close above this resistance with conviction, especially backed by strong volume. That kind of breakout would suggest the market still has bullish momentum and could drive the price toward the $3.00 region or higher. However, without a convincing breakout, the odds are still skewed to the downside.
💎As long as the price remains under this critical resistance zone, the Ending Diagonal pattern remains valid, and history has shown how brutal the reversal from this structure can be. A failure to break out cleanly is likely to lead to a sharp and rapid decline. The first area of interest on the way down would be the $2.153 level, an important support that the price has reacted to in the past.
💎Should this level break, the door opens to a deeper correction targeting $1.819, where the Volume Profile begins to rise again and buyers have previously stepped in. Momentum indicators are also not aligning with the bullish case. The RSI is showing clear signs of weakening strength, failing to keep up with the price as the move extends into the final wave.
Play it safe, respect the structure, and let the market come to you!
MyCryptoParadise
iFeel the success🌴

SEI/USD Long Setup (3D Timeframe)
📈 Overview:
Yesterday, the last 3D bar closed, triggering a LONG entry signal. The price is above the MLR, SMA, and PSAR, which are positive indicators that align with a bullish trend. However, caution is required as the price is currently below the key 200 MA, a level that can act as a strong resistance.
📊 Entry Conditions:
- Price > MLR > SMA > PSAR: Bullish alignment across all key indicators.
- Long Entry: Triggered by the 3D bar close and the alignment of indicators.
⚠️ Risk Warning:
- 200 MA: The price is below the 200-day moving average, which could act as resistance. This is a critical level to watch out for.
- Market Caution: While the signals point towards a potential uptrend, the 200 MA being below the current price adds a layer of risk. We need to be cautious, especially as price could face rejection at this level.
📍Trade Strategy:
- Stop Loss (SL): Consider setting it below last PSAR level to manage downside risk effectively.
- Since the stop loss (SL) is wide, a spot entry is preferred
🔍 Conclusion:
This is a high-risk, high-reward setup. Given the 200 MA resistance, it’s important to monitor price action closely for signs of rejection. If the price breaks above the 200 MA, this could turn into a strong uptrend. Stay flexible and adjust your risk management as needed.
💬 Drop a comment with your thoughts and follow for more updates! 🚀

XRP/USDT – 3D Long Signal Setup
📅 April 29, 2025
The system is about to trigger a long entry on the 3D timeframe.
All major conditions are now aligned:
✅ MLR > SMA > BB Center > PSAR
✅ Price is above the 200 MA on both the 3D and 1D timeframes — reinforcing the bullish bias.
📍 Entry Plan:
Prepare for a potential long entry at this 3D bar close.
Suggested stop-loss: around 2.08, matching the current PSAR level on the 1D chart.
This setup shows system strength across multiple timeframes, but as always — discipline first, excitement second.
🔔 Keep an eye on updates and thank you for reading! 📈📊

SOL/USDT – 3D Long Signal Active📅 April 29, 2025
The system triggered a long entry at the last 3D bar close.
Currently, the price remains around the same levels.
✅ System conditions for a long are fully met:
MLR > SMA > BB Center > PSAR
Price is trading above the 200 MA on the 3D timeframe.
⚠️ Caution:
On the 1D timeframe, price is still below the 200 MA, which suggests some lingering weakness. Proceed carefully.
📍 Strategy Plan:
Consider entering long at today’s daily close or at the next 3D bar close.
Suggested stop-loss: below the latest PSAR dot for system integrity.
🔔 Keep an eye on updates and thank you for reading! 📈📊

ADA/USDT – 3D Long Signal Active
📅 April 29, 2025
The system triggered a long entry at the last 3D bar close.
Currently, the price remains around the same levels.
✅ System conditions for a long are fully met:
MLR > SMA > BB Center > PSAR
Price is trading above the 200 MA on the 3D timeframe.
⚠️ Caution:
On the 1D timeframe, price is still below the 200 MA, which suggests some lingering weakness. Proceed carefully.
📍 Strategy Plan:
Consider entering long at today’s daily close or at the next 3D bar close.
Suggested stop-loss: below the latest PSAR dot for system integrity.
🔔 Keep an eye on updates and thank you for reading! 📈📊

DOGE/USDT – 3D Long Signal Active📅 April 29, 2025
The system triggered a long entry at the last 3D bar close.
Currently, the price remains around the same levels.
✅ System conditions for a long are fully met:
MLR > SMA > BB Center > PSAR
Price is trading above the 200 MA on the 3D timeframe.
⚠️ Caution:
On the 1D timeframe, price is still below the 200 MA, which suggests some lingering weakness. Proceed carefully.
📍 Strategy Plan:
Consider entering long at today’s daily close or at the next 3D bar close.
Suggested stop-loss: below the latest PSAR dot for system integrity.
🔔 Keep an eye on updates and thank you for reading! 📈📊

XLM/USDT – 3D Long Signal Active 📅 April 29, 2025
The system triggered a long entry at the last 3D bar close.
Currently, the price remains around the same levels.
✅ System conditions for a long are fully met:
MLR > SMA > BB Center > PSAR
Price is trading above the 200 MA on the 3D timeframe.
⚠️ Caution:
On the 1D timeframe, price is still below the 200 MA, which suggests some lingering weakness. Proceed carefully.
📍 Strategy Plan:
Consider entering long at today’s daily close or at the next 3D bar close.
Suggested stop-loss: below the latest PSAR dot for system integrity.
🔔 Keep an eye on updates and thank you for reading! 📈📊

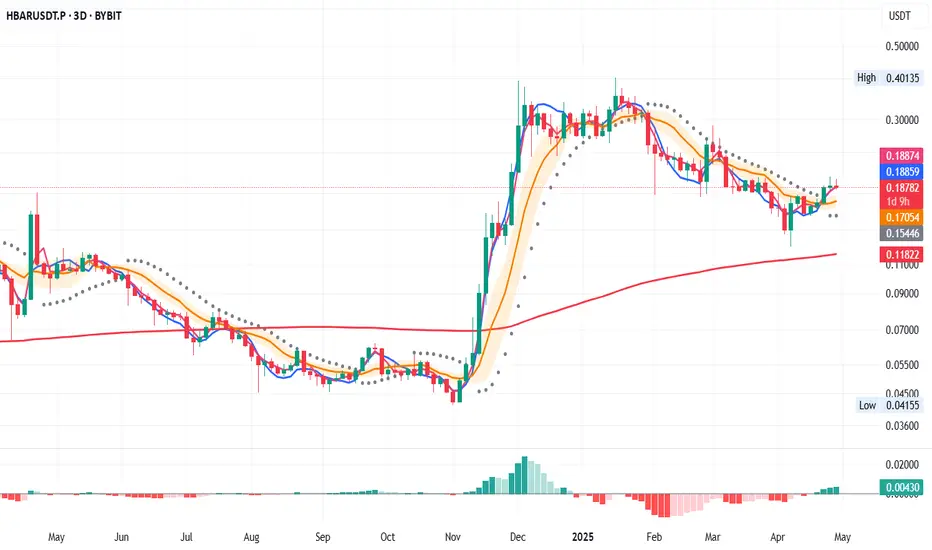
HBAR/USDT – 3D Long Signal Active📅 April 29, 2025
The system triggered a long entry at the last 3D bar close.
Currently, the price remains around the same levels.
✅ System conditions for a long are fully met:
MLR > SMA > BB Center > PSAR
Price is trading above the 200 MA on the 3D timeframe.
⚠️ Caution:
On the 1D timeframe, price is still below the 200 MA, which suggests some lingering weakness. Proceed carefully.
📍 Strategy Plan:
Consider entering long at today’s daily close or at the next 3D bar close.
Suggested stop-loss: below the latest PSAR dot for system integrity.
🔔 Keep an eye on updates and thank you for reading! 📈📊
BTCUSD: The final 7 months of the Bull Cycle have begun.Bitcoin remains on excellent bullish 1D technicals (RSI = 65.277, MACD = 2917.800, ADX = 44.478) as it is recovering from this months Low. A recovery that will close today the monthly candle in green, the first after 2 bearish 1M candles. This has technically kickstarted the final 7 months of the Bull Cycle, which have historically been a straight rally to the Cycle's Top. The last 2 Cycles took 35 months from bottom to top and based on that we expect the current one to peak in October (2025).
## If you like our free content follow our profile to get more daily ideas. ##
## Comments and likes are greatly appreciated. ##

COOKIE/USDT Short Setup Loading - High-Probability DropPrice recently pumped into a premium zone and gave us a clear Change of Character (ChoCh) — a classic signal that momentum is shifting from bullish to bearish. Now, we’re seeing a pullback into the 0.5–0.618 Fibonacci retracement zone, which often acts as a key area for entries.
📍 Trade Plan
Entry: 0.182 USDT
Stop-Loss: 0.191 USDT (above recent high / invalidation point)
Target: 0.173 - 0.1657 - 0.153
🔎 Why This Setup Stands Out:
✅ ChoCh Confirmed – Momentum has shifted, suggesting the bulls are losing control.
✅ Fibonacci Confluence – Price is pulling back right into the golden zone (0.5–0.618), offering a textbook short entry.
✅ Clean Risk/Reward – With a tight stop and a defined target, the setup offers solid R:R potential.
💭 Final Thought:
Now it’s all about confirmation. If we see a solid rejection in the zone, this setup could play out with strength. Patience is key — let the market come to you.

Price Takes a Breath Before the Next RunBINANCE:HBARUSDT has been moving in a smooth uptrend, followed by a brief consolidation — forming a classic bullish pennant pattern. This indicates a temporary pause before a potential continuation toward the main target zone at 0.21182 – 0.21855.
A breakout above 0.19195 confirms the validity of the pennant pattern, especially after the price successfully held above the demand zone at 0.18907 – 0.18633. The next key level to watch is the prior high of the pennant (highlighted with a red arrow).
For a solid bullish continuation, ensure the breakout is clean — no fakeouts or re-entries back into the pennant. If a false breakout occurs, it's wise to either trim your position or set a break-even stop to protect your capital.
Note: Manage risk with proper stop loss just below the demand zone.

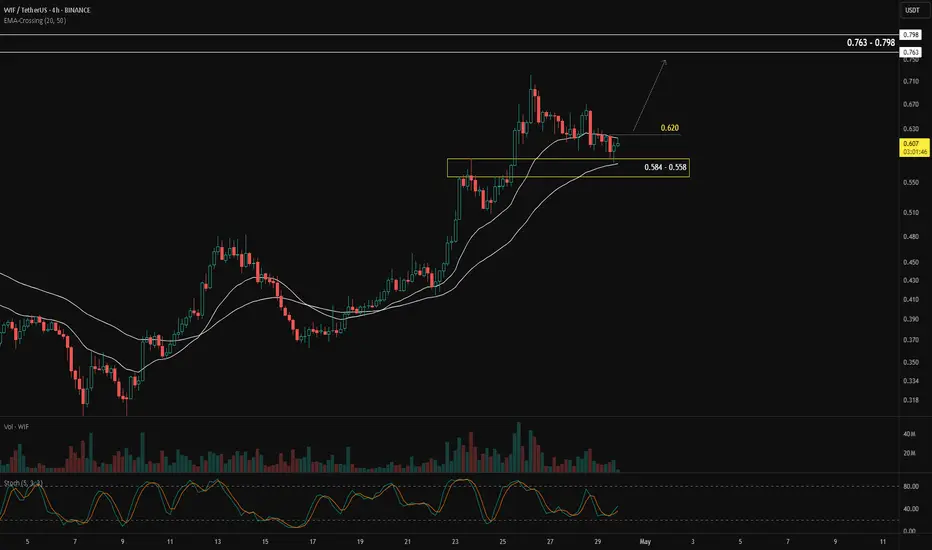
When Moving Averages Meet the Demand ZoneOne of the simplest ways to identify the market trend is by using the moving average (MA) indicator.
When price moves above the MA, it's generally considered an uptrend.
When price moves below the MA, it's seen as a downtrend.
Aside from showing the trend, moving averages can also act as dynamic support and resistance:
In an uptrend, the MA acts as support — meaning if price retraces into the MA, it often bounces back and continues upward.
In a downtrend, the MA acts as resistance — price tends to reject the MA and move lower.
In BINANCE:WIFUSDT , the moving average is currently acting as support, and price is pulling back into a confluence zone between 0.584 – 0.558, where the MA meets a demand zone. This setup increases the probability of the pullback ending and the uptrend continuing.
The confirmation for a bullish continuation would be a break and close above 0.620.
If that happens, the next target zone is between 0.763 – 0.789.
Keep a close eye when price approaches the previous high. The ideal scenario is a strong impulsive breakout. The worst-case scenario would be a rejection or false breakout from that level.
Alright, what's your take on BINANCE:WIFUSDT ?
RNDR Trade Setup – Double Bottom & Support ReclaimRender (RNDR) has shown strong resilience by forming a double bottom and reclaiming the key $4 level, signaling potential strength. We’re now watching for a sweep into downside liquidity (sub-$4 wick), with a daily close still holding above $4—this would confirm a strong long opportunity.
🔹 Entry Zone:
$3.50 to $4.00
🎯 Take Profit Targets:
🥇 $5.64
🥈 $6.70
🛑 Stop Loss:
Daily close below $3.00

Pullback's Almost Over — Get In Before It RunsThe best time to enter in a bull market is during a pullback — when price temporarily retraces before continuing its upward trend.
In the case of BINANCE:SUPERUSDT , price is currently pulling back into a demand zone between 0.7178 – 0.7109. The overall structure remains bullish, with the blue arrows showing a series of higher lows and the red arrows indicating higher highs.
We expect the price to bounce from this demand zone and potentially break the previous high, continuing the bullish trend.
To confirm the pullback is ending and a reversal is underway, we’ll watch for candlestick patterns. Here are two possible bullish confirmation scenarios:
Price breaks and closes above the high of the last red candle — a bullish engulfing setup.
Price dips deeper into the demand zone, then forms a bullish pattern such as:
Bullish Engulfing
Bullish Harami
Other reversal signals, like a close above the high of the previous two candles.
These are the scenarios I’m watching for on $SUPERUSDT.
Let me know your thoughts!

ALGO/USDT - Long Setup Update on 3D Time Frame29.04.2025
On April 22, we had a long entry signal on the 3D time frame. As of today, the price remains around the same level.
The system’s rules are favourable for another long entry:
- Price > MLR > SMA > PSAR
- Price is above the 200 MA, reinforcing the bullish bias.
Consider a long entry at today’s close or at the close of this 3D bar. However, note that on the 1D time frame, the price is still below the 200 MA, which could act as resistance.
The PSAR stop-loss is a good option for spot trading, given its placement.
Keep an eye on updates and thank you for reading! 📈📊
